Bahaa Fakhry Shehab | Aneed Maher Lafta | Zaid Luay Hadi*
© 2026 The authors. This article is published by IIETA and is licensed under the CC BY 4.0 license (http://creativecommons.org/licenses/by/4.0/).
OPEN ACCESS
The present study investigates the effects of nominal Ag content on the structural characteristics and NO₂ sensing performance of ZnO/Ag/Ag₂O thin films prepared by pulsed laser deposition (PLD). Films containing 0%, 5%, and 10% of Ag were deposited on porous silicon and characterized by X-ray diffraction (XRD), Fourier-transform infrared spectroscopy (FTIR), and field-emission scanning electron microscopy (FE-SEM). All samples were found to contain polycrystalline wurtzite ZnO, according to XRD, but films containing Ag exhibited extra reflections that were attributed to phases related to Ag₂O. Rather than significantly distorting the ZnO lattice, the minor variation in the recalculated lattice parameters with Ag content suggests that Ag mainly introduced a secondary phase. FE-SEM images showed that the porous silicon architecture remained accessible after deposition; the 5% Ag film exhibited the most uniform surface coverage, whereas the 10% Ag film showed greater agglomeration. FTIR spectra revealed the Zn-O vibration together with bands associated with surface hydroxyl Ag/Ag₂O and adsorbed species. Gas-sensing measurements toward 50 ppm NO₂ at 200-300 ℃ showed that the resistance of all films increased during gas exposure, consistent with n-type sensing behavior. The 5% Ag film delivered the highest sensitivity, reaching 68.0% at 250 ℃ with response and recovery times of 20 and 60 s, respectively, whereas undoped ZnO reached 31.0% under the same conditions. The results show that moderate Ag addition improves the NO₂ sensing performance of ZnO/Ag/Ag₂O thin films, while excessive Ag loading is less beneficial.
NO₂ gas sensing, zinc oxide, Ag, porous silicon, pulsed laser deposition, Ag sensitization
Hazardous gases are commonly divided into oxidizing and reducing gases, and nitrogen dioxide (NO₂) is among the most important oxidizing gases because of its toxicity and its role in atmospheric photochemical processes that contribute to ground-level ozone and acid rain [1, 2]. Low-cost resistive gas sensors are still appealing for environmental monitoring due to their sensitivity to surface adsorption processes, ease of fabrication, and integration with electronic circuits [3, 4]. The target gas and adsorbed oxygen species interact in these sensors to alter the carrier concentration and potential barrier at the surface of the semiconductor, resulting in a detectable change in resistance [5-7].
The temperature-dependent performance of the %Ag sample reveals a distinct operating regime that is affected by thermal activation of the surface. It is hypothesized that high silver concentration may act as a physical barrier or create deep electron traps, such as Schottky barriers, thereby reducing the response [8]. Due to its high specific surface area, open transport channels, and compatibility with silicon technology, porous silicon is a useful substrate for gas sensing [9-13]. Due to its n-type semiconducting behavior [14], wide direct band gap (~3.37 eV) [15], chemical stability [16], and ease of preparation by several thin-film routes including pulsed laser deposition (PLD) [17], zinc oxide (ZnO) is also a well-established gas-sensing material [18-20]. Combining ZnO with a porous substrate is therefore an effective strategy for increasing the density of active sites available for gas adsorption [21, 22]. A further route to improving ZnO-based sensors is the addition of a catalytically active second phase [23]. Adding Ag is of particular interest because it can modify the adsorption chemistry [24], promote spillover-type effects [25], and change the electronic barrier structure at the ZnO surface [26, 27]. Recent studies on Ag-decorated ZnO for NO₂ sensing have shown that moderate Ag loading can enhance the response substantially, but the improvement is not monotonic with Ag content [28-32]. Despite this general trend, the role of Ag addition in PLD-grown ZnO/Ag/Ag2O thin films remains insufficiently clarified, especially when Ag loading was varied systematically on a PS [33, 34]. The aim of the present work is therefore to examine the effect of nominal Ag content on the structural, morphological, and NO₂ gas-sensing properties of ZnO/Ag/Ag2O thin films prepared by PLD. The discussion focuses on the internal consistency of the measured data, the relationship between structure and sensing behavior, and the identification of the Ag content that provides the best performance within the studied range.
The films were deposited using a composite target made of mixed ZnO and Ag2O powders, which were mixed with selected percentages of 0%, 5% and 10% of the nominal atomic percentages of Ag based on the starting mass ratios of the precursor powders during target preparation. The measured atomic percentages of Ag in the films are 4 ± 0.2 for the nominal 5% sample and 8 ± 0.2 for the nominal 10% sample. These quantified results, along with their respective uncertainties.
Porous silicon is a unique nanomaterial produced by the electrochemical etching of crystalline silicon. p-type (boron-doped) orientation is typically <100> for mesoporous/microporous layers. Resistivity could be defined as the doping concentration, critical for the pore formation mechanism, where p-type, for example, is low resistivity 0.01–0.05 Ω for mesoporous/microporous.
The p-type Si, as an example: High resistivity within the range (50–80 Ω·m) for macroporous. Its integration with metal oxides, such as ZnO, is highly advantageous due to the following properties:
High surface area-to-volume ratio: Porous silicon possesses an immense internal surface area (often exceeding 500 m2/cm3). Significance: It serves as an ideal scaffold for ZnO deposition, increasing the contact area at the heterojunction interface, which significantly enhances the performance of gas sensors and catalytic devices. In addition to Surface Chemical Reactivity, Ag/Ag₂O is typically hydrogen-terminated, making the surface highly reactive.
ZnO/Ag/Ag₂O thin films with nominal Ag contents of 0%, 5%, and 10% were deposited on electrochemically etched Porous silicon substrates via PLD. The PLD system employed a Quanta-Ray Spectra-Physics Nd: YAG laser operating at a wavelength of 1064nm, pulse energy of 30 mJ, and repetition rate of 10 Hz. The beam was focused by a 150 mm plano-convex lens onto a rotating target inside a vacuum chamber operated at around 1.5 Torr with O₂ background gas.
The substrate was positioned 5 cm from the target at an angle of 45°, and the deposition time was 30 min. After deposition, the coated substrates were annealed at 200 ℃ for 5 hours. Ag₂O formation is fully expected under these growth parameters. Thermodynamically, the phase stability of silver oxides depends heavily on the temperature and oxygen partial pressure. Film thickness, measured by optical spectroscopic reflectometry (TF Probe, Angstrom Sun Technology Inc.), was 250 ± 10 nm. Structural properties were examined by X-ray diffraction (XRD) using a SHIMADZU XRD-6000 diffractometer. Surface morphology was investigated by FE-SEM (JEOL JSM-7600F). Fourier-transform infrared spectroscopy (FTIR) spectra were used to examine surface bonding states within the range (4000–400 cm-1).
Aluminum mesh electrodes were deposited on the thin surface using a high-vacuum thermal evaporation process with an Edwards coating system. Using a thermocouple and a temperature-controlled hot plate, gas-sensing measurements were carried out in a sealed chamber. The standard experimental parameters for creating and validating a 50 ppm NO₂ environment in a controlled lab chamber with a volume of around 0.3 L. The gas flow rate ranged from 0.1 to 2.0 L/min, and a purge time between 10 and 30 minutes.
At operating temperatures of 200, 250, and 300 ℃, a multimeter connected to a computer was used to continuously record the sensor resistance while clean air and around 50 ppm of NO2 were introduced alternately. The prepared thin films' sensitivity was calculated as [S% = [(Rg - Ra)/Ra] × 100], where Rg and Ra are the resistances in NO₂ and clean air, respectively, since NO₂ is an oxidizing gas and the films function as n-type sensors [29].
According to the Ellingham diagram data for the Ag₂O system, an oxygen partial pressure of 1.5 Torr combined with a moderate deposition temperature (200 ℃) and subsequent post-annealing (200 ℃ for 5 hours in air) provides a sufficient chemical potential of oxygen to cross the phase boundary from metallic Ag₂O to stable crystalline Ag₂O [35]. Under deposition conditions of 1.5 Torr and 200 ℃, pressure reduction changes the effective Gibbs free energy, resulting in a shift of the equilibrium boundary. The deposition pressure, being far below atmospheric pressure, supplies the necessary thermodynamic driving force for the reaction to enter the negative Gibbs free energy region, thereby making the oxidation of silver thermodynamically favorable.
3.1 X-ray diffraction analysis
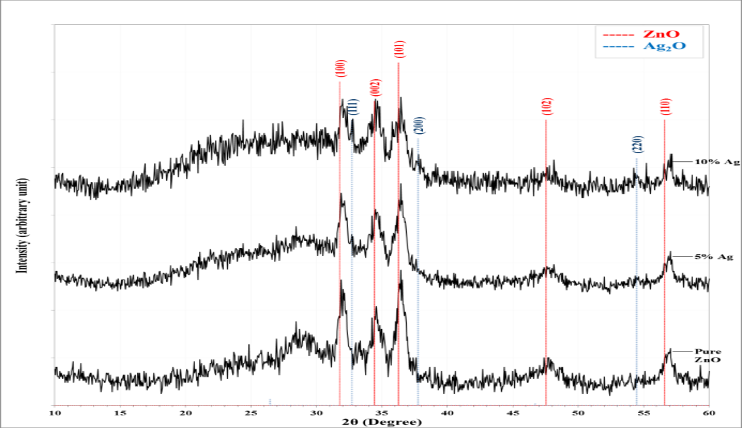
According to the assignments, the standard reference cards are JCPDS 36-1451 for hexagonal wurtzite ZnO and JCPDS 43-1038 for cubic Ag₂O. It was carefully considered that metallic Ag (JCPDS 04-0783) was an alternative candidate. The XRD patterns of the ZnO/Ag/Ag₂O films are shown in Figure 1. The prepared film exhibits the characteristic reflections of hexagonal wurtzite ZnO at 2θ ≈ 31.7°, 34.6°, 36.5°, 47.7°, and 56.8°, corresponding to the (100), (002), (101), (102), and (110) planes, respectively [28, 36]. A broad feature centered near 28.5° is assigned to the porous silicon substrate.
Figure 1. X-ray diffraction (XRD) patterns of ZnO/Ag/Ag₂O thin films with nominal Ag contents of 0%, 5%, and 10% deposited on porous silicon
In the 5% Ag and 10% Ag films, additional peaks appear near 32.7°, 37.8°, and 54.5° [37]. These additional reflections are confidently assigned to the cubic Ag₂O phase by more reasonably assigning these peaks to Ag₂O-related reflections than to additional ZnO planes.
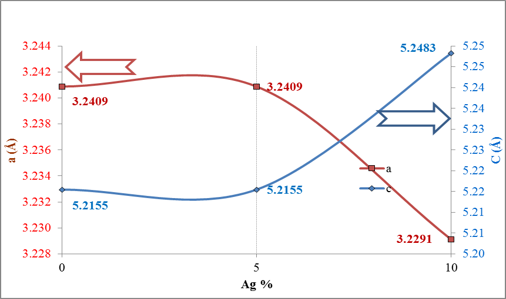
The corrected peak positions and assignments are shown in Table 1. In contrast to the Ag₂O-related peaks, which provide somewhat larger values up to 20.6 nm, ZnO peaks are associated with crystallite sizes (D) roughly within range (5.5–12 nm). In Table 2 and Figure 2, the recalculated lattice parameters from the ZnO (100) and (002) reflections are detailed [38]. The values change only slightly across the series (a = 3.2255 Å and c = 5.1731 Å), indicating that Ag addition does not strongly distort the ZnO lattice within the resolution of the present XRD data.
Figure 2. Variation of recalculated lattice parameters with nominal Ag content
Table 1. Corrected X-ray diffraction (XRD) peak positions and phase assignments for ZnO/Ag/Ag₂O thin films
|
Ag (%) |
2θ (deg) |
d (Å) |
FWHM (deg) |
D (nm) |
Miller Indices (hkl) |
Phase |
|
0 |
31.7 |
2.7934 |
0.7326 |
11.3 |
(100) |
ZnO |
|
34.6 |
2.5892 |
0.7692 |
10.8 |
(002) |
ZnO |
|
|
36.4 |
2.4608 |
0.6960 |
12 |
(101) |
ZnO |
|
|
47.6 |
1.9054 |
1.5751 |
5.5 |
(102) |
ZnO |
|
|
56.8 |
1.6183 |
0.8791 |
10.3 |
(110) |
ZnO |
|
|
5 |
31.9 |
2.7965 |
0.6594 |
12.5 |
(100) |
ZnO |
|
32.7 |
2.7355 |
0.4762 |
17.4 |
(111) |
Ag₂O |
|
|
34.6 |
2.5866 |
0.8059 |
10.3 |
(002) |
ZnO |
|
|
36.4 |
2.4656 |
0.6228 |
13.4 |
(101) |
ZnO |
|
|
47.6 |
1.9054 |
1.3919 |
6.2 |
(102) |
ZnO |
|
|
54.5 |
1.6811 |
0.8059 |
11.1 |
(220) |
Ag₂O |
|
|
56.9 |
1.6144 |
0.6960 |
13 |
(110) |
ZnO |
|
|
10 |
31.9 |
2.7965 |
0.6594 |
12.5 |
(100) |
ZnO |
|
32.6 |
2.7385 |
0.4029 |
20.6 |
(111) |
Ag₂O |
|
|
34.6 |
2.5892 |
0.9890 |
8.4 |
(002) |
ZnO |
|
|
36.3 |
2.4680 |
0.9524 |
8.8 |
(101) |
ZnO |
|
|
37.7 |
2.3802 |
0.6594 |
12.7 |
(200) |
Ag₂O |
|
|
47.5 |
1.9095 |
1.1355 |
7.6 |
(102) |
ZnO |
|
|
54.5 |
1.6822 |
0.8425 |
10.6 |
(220) |
Ag₂O |
|
|
56.9 |
1.6154 |
0.8059 |
11.2 |
(110) |
ZnO |
Note: D = crystallite size, FWHM = full width at half maximum. D is the lattice parameter of the hexagonal wurtzite ZnO structure.
Table 2. Recalculated lattice parameters of ZnO/Ag/Ag₂O thin films from the ZnO (100) and (002) reflections
|
Ag (%) |
a (Å) |
c (Å) |
|
0 |
3.2255 |
5.1784 |
|
5 |
3.2291 |
5.1731 |
|
10 |
3.2291 |
5.1784 |
Note: a and c are the lattice parameters of the hexagonal wurtzite ZnO structure.
The principal structural effect of Ag addition is therefore the appearance of a secondary Ag-containing phase rather than a large shift of the ZnO host lattice [39].
The sensing mechanism of the chemical state was selected by the optimal sample that was found to be 5% Ag before and after thermal treatment at the working temperature (250 ℃) with the target gas ambient and NO₂. According to reference [40], the core-level Ag 3d₅/₂ spectra reveal that at RT. Predominantly, silver exists as Ag⁺ in the Ag₂O state with a binding energy of 367.8 eV, aligning with the XRD findings.
At 250 ℃, a highly dynamic induced redox equilibrium was enhanced by the sensing mechanism, whereas the co-existence of Ag₂O and metallic Ag clusters drives two complementary processes, Electronic Sensitization and Chemical Sensitization [41].
The crystallite sizes were estimated using the standard Scherrer equation; we have updated the text to confirm that the observed FWHM was corrected for instrumental broadening using a crystalline standard. Furthermore, a clarifying statement was added to the text emphasizing that, because the Scherrer equation does not decouple size from macrostrain effects, these values are considered order-of-magnitude estimates rather than absolute physical sizes and were added to the crystallite size values in Table 1.
As detailed in Table 2 and Figure 2, the calculated lattice parameters from the ZnO (100) and (002) reflections exhibit a distinct composition-dependent behavior. For the 5% Ag film, the lattice parameters show only minor variations (a = 3.2291 Å and c = 5.1731 Å) compared to the undoped ZnO. This suggests that at moderate concentrations, Ag predominantly segregates to form a secondary Ag₂O phase without severely distorting the host ZnO lattice. However, increasing the nominal Ag content to 10% induces a significant anisotropic structural distortion, characterized by a drastic expansion of the c-axis (c = 5.1784 Å) and a noticeable contraction of the a-axis. This pronounced shift indicates that excessive Ag loading generates substantial interfacial stress and macrostrain between the ZnO matrix and the heavily agglomerated Ag₂O secondary phase. Furthermore, it may also reflect the forced interstitial incorporation or substitution of the larger Ag⁺ ions (compared to Zn²⁺) into the ZnO crystal lattice at higher concentrations.
3.2 Field-emission scanning electron microscopy morphology
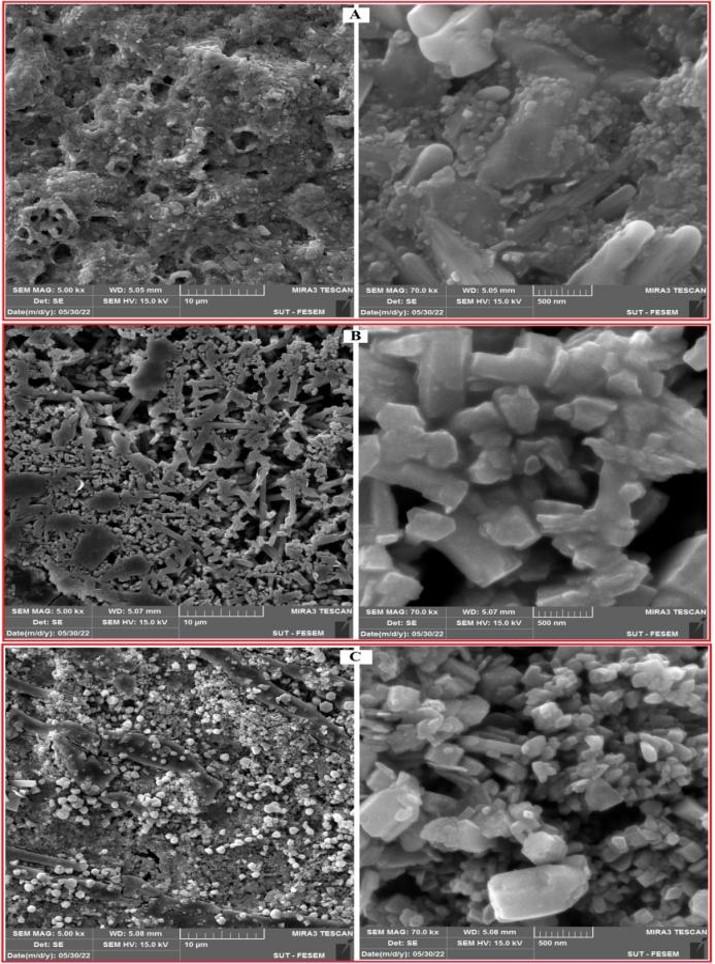
Figure 3 presents top-view FE-SEM images at low and high magnification. A cross-sectional and top-view FE-SEM image of the bare porous silicon substrate before thin-film deposition has been investigated. The bare substrate exhibits an average pore diameter around 45 nm and a cross-sectional layer thickness up to 3.2 µm. All samples retain the porous architecture of the Ag/Ag₂O substrate, with pore openings on the order of micrometers and thin separating walls. The undoped ZnO/Ag/Ag₂O film shows an open porous network with comparatively fine surface coverage.
Figure 3. Field-emission scanning electron microscopy (FE-SEM) images of ZnO/Ag/Ag₂O thin films with nominal Ag contents of (A) 0%, (B) 5%, and (C) 10% at two magnifications
The 5% Ag film exhibits more uniform decoration of the pore walls by faceted grains, while the porous structure remains clearly accessible. In contrast, the 10% Ag film appears denser, with larger aggregates and more local pore coverage. From a gas-sensing perspective, the 5% Ag morphology is the most favorable because it combines accessible pores with an increased density of surface-active grains. The FE-SEM observations, therefore, agree with the electrical measurements, where the 5% Ag film gives the highest NO₂ response.
3.3 Fourier-transform infrared spectroscopy analysis
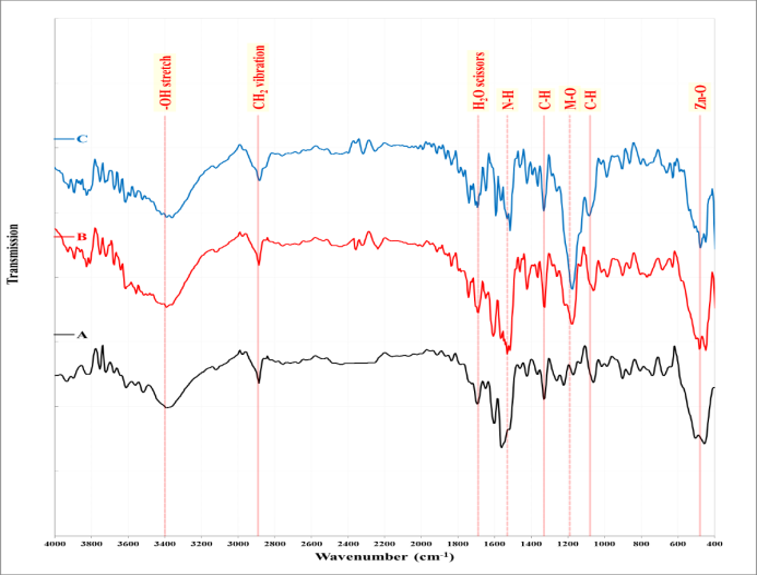
Table 3 summarizes the bands observed, and Figure 4 displays the FTIR spectra, where a = 0%, b = 5%, and c = 10% of the added Ag ratio. The wide band observed at 3367-3392 cm⁻¹ is attributed to the O-H stretching of surface hydroxyl groups and/or adsorbed water [42].
Table 3. Tentative Fourier-transform infrared spectroscopy (FTIR) band assignments for ZnO/%Ag/Ag2O thin films
|
Band Assignment |
0% Ag |
5% Ag |
10% Ag |
Interpretation |
|
O–H stretching |
3385 |
3392 |
3367 |
Surface hydroxyls and/or adsorbed water |
|
C–H stretching |
2886 |
2882 |
2882 |
Residual carbonaceous species |
|
H–O–H bending |
1695 |
1688 |
1695 |
Adsorbed water |
|
1513-1559 cm⁻¹ |
1559 |
1531 |
1513 |
Surface adsorbates; not assigned definitively |
|
1328 cm⁻¹ |
1328 |
1328 |
1328 |
Residual C–H |
|
1175 cm⁻¹ |
- |
1175 |
1175 |
C–O stretching |
|
1059–1084 cm⁻¹ |
1059 |
1066 |
1084 |
C–H and C–O |
|
Zn–O stretching |
455 |
476 |
476 |
Zn–O vibration |
The band near 1688–1695 cm⁻¹ is attributed to the bending vibrations of molecular water [43]. The bands in the 2882–2886 and 1059–1084 cm⁻¹ regions are tentatively attributed to surface vibrations related to C–H and C–O [44], as well as residual carbonaceous species. The low wavenumber band at 455–476 cm⁻¹ is consistent with a Zn–O vibration [45].
In addition, Ag shows an extra band near 1175 cm⁻¹. This feature is regarded as a potential band related to the surface rather than conclusive evidence of a particular metal-oxygen bond. Therefore, the FTIR results corroborate the existence of ZnO and common surface adsorbates; however, they should not be overinterpreted beyond that threshold.
Figure 4. Fourier-transform infrared spectroscopy (FTIR) spectra of ZnO/Ag/Ag2O thin films with nominal Ag contents of 0%, 5%, and 10%
3.4 NO₂ sensing performance
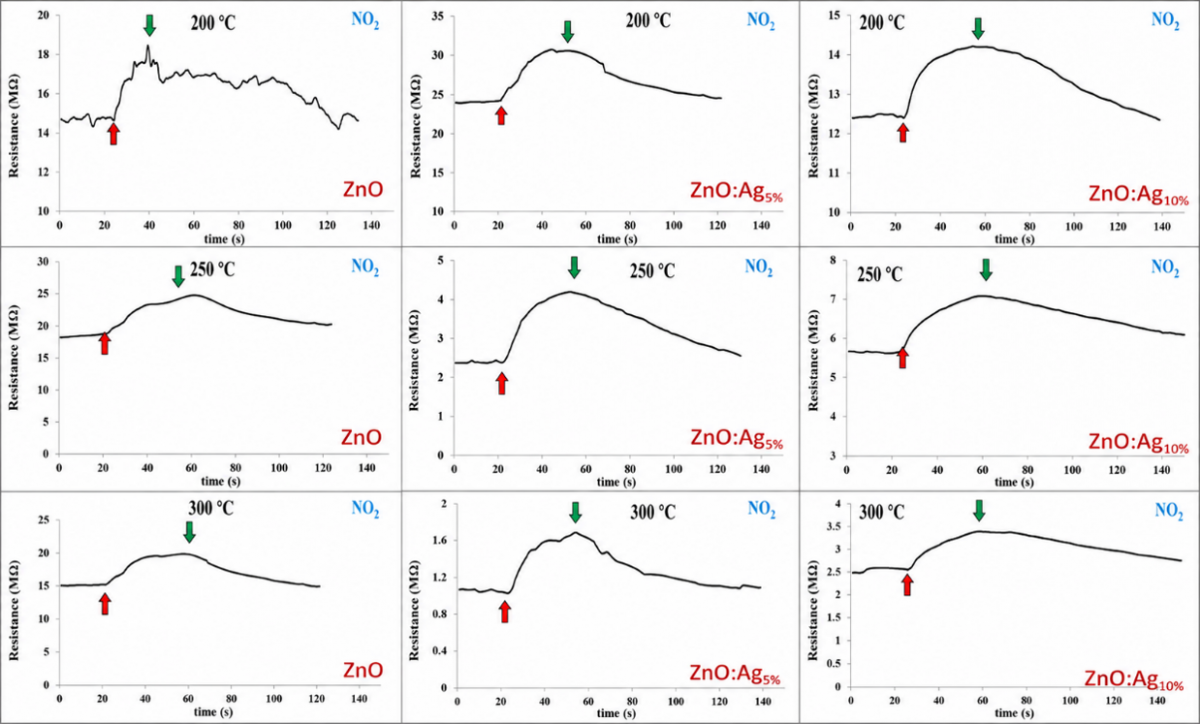
Dynamic resistance transients for 50 ppm NO₂ at 200, 250, and 300 ℃ are shown in Figure 5. For all compositions, the resistance increases during NO₂ exposure and decreases when clean air is reintroduced, which is the expected behavior of an n-type oxide exposed to an oxidizing gas. The response is reversible over the recorded cycles, although the recovery behavior depends strongly on temperature and Ag content.
Figure 5. Dynamic resistance transients of ZnO/Ag/Ag₂O sensors toward 50 ppm NO₂ at 200, 250, and 300 ℃
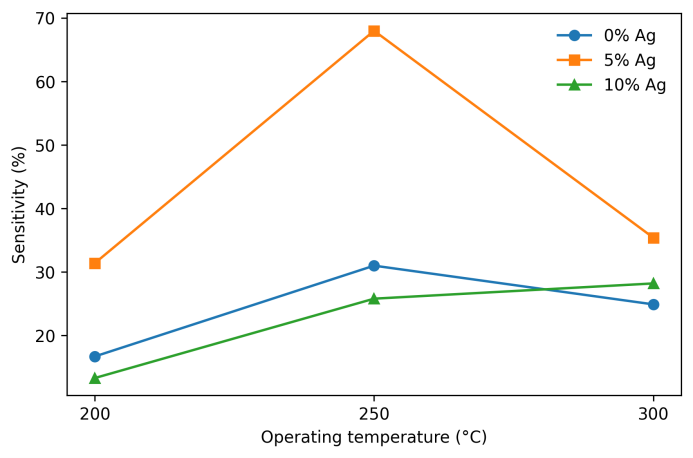
Figure 6 and Table 4 summarize sensitivity, response time, and recovery time. The undoped film shows its maximum sensitivity at 250 ℃ (31.0%). The 5% Ag film also reaches its optimum at 250 ℃, but with a much larger sensitivity of 68.0%. This value is about 2.19 times that of the undoped film at the same temperature and about 2.64 times that of the 10% Ag film at 250 ℃. The 10% Ag film exhibits distinct behavior, with its sensitivity increasing gradually from 13.3% at 200 ℃ to 28.2% at 300 ℃. This suggests that the optimal response moves toward a higher operating temperature as the Ag loading increases.
Figure 6. Sensitivity of ZnO/Ag/Ag₂O sensors toward 50 ppm NO₂ as a function of operating temperature
Table 4. Sensitivity, response time, and recovery time of ZnO/Ag/Ag₂O sensors toward 50 ppm NO₂
|
Ag (%) |
Temperature (℃) |
Sensitivity (%) |
Response Time (s) |
Recovery Time (s) |
|
0% Ag |
200 |
16.7 |
20.0 |
60.0 |
|
250 |
31.0 |
25.0 |
40.0 |
|
|
300 |
24.9 |
20.0 |
30.0 |
|
|
5% Ag |
200 |
31.4 |
20.0 |
50.0 |
|
250 |
68.0 |
20.0 |
60.0 |
|
|
300 |
35.4 |
20.0 |
40.0 |
|
|
10% Ag |
200 |
13.3 |
15.0 |
60.0 |
|
250 |
25.8 |
22.0 |
80.0 |
|
|
300 |
28.2 |
30.0 |
70.0 |
Response and recovery times should be interpreted together with sensitivity rather than separately. For the undoped film, the shortest recovery time (30 s) occurs at 300 ℃ rather than at the maximum sensitivity. For the 5% Ag film, the response time remains 20 s at all three temperatures, while the recovery time decreases from 60 s at 250 ℃ to 40 s at 300 ℃. The 10% Ag film shows the slowest overall activity behavior at 300 ℃ with time (30 s response and 70 s recovery). Within the tested range, 5% Ag therefore provides the best overall trade-off between response magnitude and dynamic behavior.
3.5 Sensing mechanism
Resistance characteristics and formal time criteria are critical for an objective comparison of gas-sensing dynamics. The formal definitions of response and recovery times clarify the baseline metrics, and standard deviations from multiple repeated cycles are shown in Table 4. The sensing behavior can be interpreted in terms of adsorption-induced modulation of the electron depletion layer in ZnO [31, 32]. In the ambient air, oxygen adsorbs on the surface and captures electrons from the conduction band.
In the 200–300 ℃ range, O-species become increasingly important. When NO₂ is introduced, the oxidizing gas further withdraws electrons either directly or through reactions involving preabsorbed oxygen, which widens the depletion layer and increases the sensor resistance. The higher NO₂ response (68%) were observed, which allows electrons to be captured directly from the ZnO matrix conduction band. The introduction of the Ag/Ag₂O phase boosts this pathway by forming local p-n heterojunctions.
These heterojunctions undergo a massive depletion width modulation exclusively in the presence of strongly oxidizing gases, rather than non-specifically shifting general adsorption behavior [46]. Ag addition can enhance this process in two complementary ways. First, Ag/Ag₂O-related surface sites may promote catalytic adsorption and activate surface oxygen.
Second, the interface between ZnO and the Ag-containing phase can increase electronic sensitization and strengthen the modulation of the interfacial barrier [47]. The superior performance of the 5% Ag film suggests that moderate Ag loading increases the density of active sites without destroying the open porous network. The weaker response is in line with the larger Aggregates seen by FE-SEM at 10% Ag, which probably lessens the benefit of porosity and introduces less favorable conduction pathways. The sensing mechanism is driven by the formation of local ZnO/Ag₂O heterojunctions.
In clean air, the band alignment causes electrons to flow from ZnO/Ag₂O, generating a wide depletion region and a high baseline resistance. When exposed to the strongly oxidizing NO₂ molecules extract additional electrons from both phases, further widening the space-charge layer and triggering a sharp increase in resistance. This directly justifies why the silver-modified films display markedly higher baseline changes compared to pristine ZnO [48].
In the present study, ZnO/Ag/Ag₂O thin films with nominal Ag contents of 0%, 5%, and 10% were fabricated on porous silicon by PLD and evaluated for NO₂ sensing. XRD confirmed the formation of polycrystalline wurtzite ZnO in all films, while Ag-containing samples exhibited additional Ag₂O-related reflections. Recalculated lattice parameter changes, although small, point to Ag’s primary contribution via a secondary phase, rather than strong ZnO lattice distortion. Although the 10% Ag film showed more noticeable agglomeration, FE-SEM demonstrated that the porous silicon framework stayed open after deposition. Zn–O bonding, along with surface species related to hydroxyls and adsorbates, was confirmed by FTIR. Every sample showed n-type behavior in gas-sensing measurements toward 50 ppm NO₂, but the 5% Ag film performed the best overall. The maximum sensitivity of this composition was 68.0% at 250 ℃, and its response and recovery times were 20 and 60 seconds, respectively. The optimal composition for NO₂ sensing within the range studied is 5% Ag, as the results show that moderate Ag addition creates the best balance between surface activation and preservation of the porous morphology.
The authors thank Dr. Mohmmed Shareef Mohammed for his help.
[1] Khudiar, S.S., Nayef, U.M., Mutlak, F.A.H., Abdulridha, S.K. (2022). Characterization of NO2 gas sensing for ZnO nanostructure grown hydrothermally on porous silicon. Optik, 249: 168300. https://doi.org/10.1016/J.IJLEO.2021.168300
[2] Franco, M.A., Conti, P.P., Andre, R.S., Correa, D.S. (2022). A review on chemiresistive ZnO gas sensors. Sensors and Actuators Reports, 4: 100100. https://doi.org/10.1016/j.snr.2022.100100
[3] Kadhim, M.A., Ramadhan, A.A., Al-Gburi, M.O.S. (2021). Effect of PEG addition on an SnO2 gas sensor fabricated using spin coating. Karbala International Journal of Modern Science, 7(1): 9. https://doi.org/10.33640/2405-609X.2486
[4] Mourya, S., Kumar, A., Jaiswal, J., Malik, G., Kumar, B., Chandra, R. (2019). Development of Pd-Pt functionalized high performance H2 gas sensor based on silicon carbide coated porous silicon for extreme environment applications. Sensors and Actuators B: Chemical, 283: 373-383. https://doi.org/10.1016/J.SNB.2018.12.042
[5] Montoro, C., Kim, J.Y., Mirzaei, A., Lee, J.H., et al. (2024). MOF-derived metal oxide (Cu, Ni, Zn) gas sensors with excellent selectivity towards H2S, CO and H2 gases. Composites Part B: Engineering, 283: 111637. https://doi.org/10.1016/J.COMPOSITESB.2024.111637
[6] Deb, S., Mondal, A., Ashok Kumar Reddy, Y. (2024). Review on development of metal-oxide and 2-D material based gas sensors under light-activation. Current Opinion in Solid State and Materials Science, 30: 101160. https://doi.org/10.1016/J.COSSMS.2024.101160
[7] Lv, J., Zhang, C., Qu, G., Pan, K., et al. (2024). Modification strategies for semiconductor metal oxide nanomaterials applied to chemiresistive NOx gas sensors: A review. Talanta, 273: 125853. https://doi.org/10.1016/J.TALANTA.2024.125853
[8] Mehani, H., Djerad, S., Alleg, S., Abadlia, L., Daoudi, M.I., Caschera, D. (2026). Effect of silver addition on the structure of microwave-synthesized Cu-Ag solid solutions for organic pollutant degradation. Applied Physics A, 132(2): 102. https://doi.org/10.1007/s00339-025-09234-y
[9] Khoshnevis, S., Dariani, R.S., Azim-Araghi, M.E., Bayindir, Z., Robbie, K. (2006). Observation of oxygen gas effect on porous silicon-based sensors. Thin Solid Films, 515(4): 2650-2654. https://doi.org/10.1016/J.TSF.2006.05.044
[10] Alwan, A.M., Abed, H.R., Rashid, R.B. (2021). Enhancing the temporal response of modified porous silicon-based CO gas sensor. Solid-State Electronics, 181-182: 108019. https://doi.org/10.1016/J.SSE.2021.108019
[11] Jwied, D.H., Nayef, U.M., Mutlak, F.A.H. (2021). Synthesis of C: Se nanoparticles via laser ablated with magnetic field on porous silicon for gas sensor applications. Optik, 242: 167207. https://doi.org/10.1016/J.IJLEO.2021.167207
[12] Kumar, A., Kumar, A., Chandra, R. (2018). Fabrication of porous silicon filled Pd/SiC nanocauliflower thin films for high performance H2 gas sensor. Sensors and Actuators B: Chemical, 264: 10-19. https://doi.org/10.1016/J.SNB.2018.02.164
[13] Choi, M.S., Na, H.G., Mirzaei, A., Bang, J.H., et al. (2019). Room-temperature NO2 sensor based on electrochemically etched porous silicon. Journal of Alloys and Compounds, 811: 151975. https://doi.org/10.1016/J.JALLCOM.2019.151975
[14] Al-Hardan, N.H., Alghamdi, N., Keng, L.K., Salman, J.M., Abdul Hamid, M.A. (2025). The role of semiconducting metal oxide sensors in hydrogen detection and monitoring. International Journal of Hydrogen Energy, 188: 152073. https://doi.org/10.1016/J.IJHYDENE.2025.152073
[15] Srivastava, T., Sadanandan, A., Bajpai, G., Tiwari, S., et al. (2017). Zn1−xSixO: Improved optical transmission and electrical conductivity. Ceramics International, 43(7): 5668-5673. https://doi.org/10.1016/J.CERAMINT.2017.01.103
[16] Mahmood, K., Sani, A., Sadiq, H., Tang, J., Li, Q. (2024). Modification of silicone rubber by nanocomposites for enhancing physicochemical properties: A review. Materials Science and Engineering: B, 310: 117664. https://doi.org/10.1016/J.MSEB.2024.117664
[17] Jamal, R.K., Mutlak, F.A.H., Ibrahim, F.T., Nayef, U.M. (2020). Synthesis of Ag2O films by pulsed laser deposited on porous silicon as gas sensor application. Optik, 218: 164971. https://doi.org/10.1016/J.IJLEO.2020.164971
[18] Chou, C.H., Nagarjuna, Y., Yang, Z.C., Hsiao, Y.J., Wang, S.C. (2022). Catalytic effect of Ag embedded with ZnO prepared by Co-sputtering on H2S gas sensing MEMS device. Vacuum, 202: 111210. https://doi.org/10.1016/J.VACUUM.2022.111210
[19] Drmosh, Q.A., Al Wajih, Y.A., Alade, I.O., Mohamedkhair, A.K., Qamar, M., Hakeem, A.S., Yamani, Z.H. (2021). Engineering the depletion layer of Au-modified ZnO/Ag core-shell films for high-performance acetone gas sensing. Sensors and Actuators B: Chemical, 338: 129851. https://doi.org/10.1016/J.SNB.2021.129851
[20] Zhang, Q., Xie, G., Xu, M., Su, Y., Tai, H., Du, H., Jiang, Y. (2018). Visible light-assisted room temperature gas sensing with ZnO-Ag heterostructure nanoparticles. Sensors and Actuators B: Chemical, 259: 269-281. https://doi.org/10.1016/J.SNB.2017.12.052
[21] Ren, X., Xu, Z., Liu, D., Li, Y., Zhang, Z., Tang, Z. (2022). Conductometric NO2 gas sensors based on MOF-derived porous ZnO nanoparticles. Sensors and Actuators B: Chemical, 357: 131384. https://doi.org/10.1016/J.SNB.2022.131384
[22] Yadav, A., Langyan, R., Dhankhar, R. (2026). A review on the fabrication and applicability of ZnO nanoparticles for adsorption of heavy metals from wastewater: A prospect towards sustainability. Next Sustainability, 7: 100332. https://doi.org/10.1016/J.NXSUST.2026.100332
[23] Kamble, V.S., Zemase, R.K., Gupta, R.H., Aghav, B.D., et al. (2022). Improved toxic NO2 gas sensing response of Cu-doped ZnO thin-film sensors derived by simple co-precipitation route. Optical Materials, 131: 112706. https://doi.org/10.1016/J.OPTMAT.2022.112706
[24] Sağlam, H.K., Sarıtaş, S., İskenderoğlu, D., Güney, H., Ertuğrul, M. (2022). Ag-doped ZnO hydrogen sensor grown by the USP method. Optical Materials, 133: 112903. https://doi.org/10.1016/J.OPTMAT.2022.112903
[25] Zhang, T., Cai, R., Zhang, J., Li, F., Li, J. (2026). Ag decoration promotes charge-state stabilization of Cu2O and CO spillover for CO2 electroreduction to ethanol at a low potential. Chemical Engineering Science, 323: 123184. https://doi.org/10.1016/J.CES.2025.123184
[26] Li, F., Jia, P., Zhang, Q., Liu, Y., Vinokurov, V.A., Huang, W. (2023). Electronic control of catalytic activity of ZnO for higher alcohols synthesis via tailoring Fermi level. Fuel Processing Technology, 241: 107600. https://doi.org/10.1016/J.FUPROC.2022.107600
[27] Luo, N., Wang, J., Ren, J., Meng, X., et al. (2025). Highly active and stable amorphous PtCu decorated ZnO sensor with improved capability for hydrogen detection. International Journal of Hydrogen Energy, 170: 151260. https://doi.org/10.1016/J.IJHYDENE.2025.151260
[28] Kumar, R., Al-Dossary, O., Kumar, G., Umar, A. (2015). Zinc oxide nanostructures for NO2 gas-sensor applications: A review. Nano-Micro Letters, 7(2): 97-120. https://doi.org/10.1007/s40820-014-0023-3
[29] Chow, L., Lupan, O., Chai, G., Khallaf, H., et al. (2013). Synthesis and characterization of Cu-doped ZnO one-dimensional structures for miniaturized sensor applications with faster response. Sensors and Actuators A: Physical, 189: 399-408. https://doi.org/10.1016/J.SNA.2012.09.006
[30] Tebizi-Tighilt, F.Z., Zane, F., Belhaneche-Bensemra, N., Belhousse, S., Sam, S., Gabouze, N.E. (2013). Electrochemical gas sensors based on polypyrrole-porous silicon. Applied Surface Science, 269: 180-183. https://doi.org/10.1016/j.apsusc.2012.10.080
[31] Francioso, L., Forleo, A., Capone, S., Epifani, M., Taurino, A.M., Siciliano, P. (2006). Nanostructured In2O3 – SnO2 sol – gel thin film as material for NO2 detection. Sensors and Actuators B: Chemical, 114(2): 646-655. https://doi.org/10.1016/j.snb.2005.03.124
[32] Sun, Y.F., Liu, S.B., Meng, F.L., Liu, J.Y., Jin, Z., Kong, L.T., Liu, J.H. (2012). Metal oxide nanostructures and their gas sensing properties: A review. Sensors, 12(3): 2610-2631. https://doi.org/10.3390/s120302610
[33] Amedome Min-Dianey, K., Zhang, H.C., Brohi, A.A., Yu, H., Xia, X. (2018). Optical spectra of composite silver-porous silicon (Ag-pSi) nanostructure based periodical lattice. Superlattices and Microstructures, 115: 168-176. https://doi.org/10.1016/J.SPMI.2018.01.028
[34] Hu, S., Bao, P., Cao, Y., Zhao, Z., et al. (2024). Giant lateral photovoltaic effect in Ag/porous silicon/Si structure for high-performance near-infrared detection. Nano Energy, 120: 109167. https://doi.org/10.1016/J.NANOEN.2023.109167
[35] Epifano, E., Monceau, D. (2023). Ellingham diagram: A new look at an old tool. Corrosion Science, 217: 111113. https://doi.org/10.1016/J.CORSCI.2023.111113
[36] Umar, A., Ibrahim, A.A., Algadi, H., Albargi, H., Alsairi, M.A., Wang, Y., Akbar, S. (2021). Enhanced NO2 gas sensor device based on supramolecularly assembled polyaniline/silver oxide/graphene oxide composites. Ceramics International, 47(18): 25696-25707. https://doi.org/10.1016/J.CERAMINT.2021.05.296
[37] Grace, M.A.L., Rao, K.V., Anuradha, K., Jayarani, A.J., Kumar, A.A., Rathika, A. (2023). X-ray analysis and size-strain plot of zinc oxide nanoparticles by Williamson-Hall. Materials Today: Proceedings, 92: 1334-1339. https://doi.org/10.1016/J.MATPR.2023.05.492
[38] Kumar, T.M., Sagar, D.K. (2022). Structural and optical characteristics of nanoparticles of zinc oxide based ternary compounds generated by simple sol-gel technique. IOP Conference Series: Materials Science and Engineering, Kollam, India, 1263(1): 012009. https://doi.org/10.1088/1757-899X/1263/1/012009
[39] Munna, N., Jamal, M.S., Rahim, A., Islam, M.K., Shakil, A.R., Kamruzzaman, M. (2025). In-depth crystallographic structure and optoelectrical properties of ZnO nanoparticles synthesized by a facile precipitation method. Next Materials, 9: 100960. https://doi.org/10.1016/J.NXMATE.2025.100960
[40] Aspromonte, S.G., Mizrahi, M.D., Schneeberger, F.A., López, J.M.R., Boix, A.V. (2013). Study of the nature and location of silver in Ag-exchanged mordenite catalysts. Characterization by spectroscopic techniques. Journal of Physical Chemistry C, 117(48): 25433-25442. https://doi.org/10.1021/JP4046269
[41] Qin, J., Dou, Y., Wu, F., Yao, Y., et al. (2022). In-situ formation of Ag2O in metal-organic framework for light-driven upcycling of microplastics coupled with hydrogen production. Applied Catalysis B: Environmental, 319: 121940. https://doi.org/10.1016/J.APCATB.2022.121940
[42] Hadi, Z.L., Chiad, B.T. (2019). Study of mixing different volume ratios for preparing Cu2SnS3 thin films using computerized spray pyrolysis system. Iraqi Journal of Science, 60(Special Issue): 22-27. https://doi.org/10.24996/ijs.2019.60.S.I.4
[43] Lafta, A.M., Hadi, Z.L., Shehab, B.F. (2024). Gas sensing examination of CdO-%NiO thin films deposited via spraying process. Journal of Optics, 55(2): 1872-1879. https://doi.org/10.1007/s12596-024-02243-9
[44] Syzrantsev, V.V., Paukstis, E.A., Larina, T.V. (2020). Surface polymorphism of silica nanoparticles. IOP Conference Series: Materials Science and Engineering, 1008(1): 012030. https://doi.org/10.1088/1757-899X/1008/1/012030
[45] Murtaza, G., Abbas, Y., Ahmed, F. (2025). Theoretical and experimental study of structural, electronic and optical properties of cobalt-doped zinc oxide. Physica B: Condensed Matter, 712: 417283. https://doi.org/10.1016/J.PHYSB.2025.417283
[46] Shi, Y., Xing, X., Hong, M. (2025). Pulsed laser synthesis of Ag/ZnO heterojunction for enhanced photocatalytic performance. Applied Physics A, 131(4): 271. https://doi.org/10.1007/s00339-025-08403-3
[47] Huang, H., Pan, Z., Wang, J., Wang, T., et al. (2026). Synergistically enhanced NO2 sensing via Ag nanoparticles decorated on SnS2/ZnS/ZnO heterojunctions for ultra-sensitive detection. Sensors and Actuators B: Chemical, 451: 139422. https://doi.org/10.1016/J.SNB.2025.139422
[48] Saini, S., Kumar, A., Ranwa, S., Tyagi, A.K. (2022). Highly sensitive NO2 gas sensor based on Ag decorated ZnO nanorods. Applied Physics A, 128(5): 454. https://doi.org/10.1007/s00339-022-05606-w