Dunya Abdulsahib Hamdi
© 2026 The author. This article is published by IIETA and is licensed under the CC BY 4.0 license (http://creativecommons.org/licenses/by/4.0/).
OPEN ACCESS
This study investigates the surface modification of Ti13Nb13Zr alloy using a barium titanate (BaTiO₃)-polyetheretherketone (PEEK) composite coating combined with neodymium-doped yttrium aluminum garnet (Nd:YAG) fiber laser treatment to improve corrosion resistance and bioactivity for biomedical applications. The coating suspension was prepared by dissolving 2 g of polyvinylpyrrolidone (PVP) in 30 mL of water and 70 mL of absolute ethanol, followed by the addition of 12 g of BaTiO₃ and 4 g of PEEK. The alloy discs were preheated at 80 ℃ for 3 minutes, spray-coated with four layers, and subsequently treated with an Nd:YAG fiber laser at scan speeds of 100, 300, and 500 mm/s. The phase composition and elemental distribution of the coated surfaces were characterized using X-ray diffraction (XRD) and energy dispersive spectroscopy (EDS), while the surface morphology was examined by field emission scanning electron microscopy (FESEM). The results showed homogeneous spherical particles ranging from 418.72 nm to 1.570 µm, with particle size increasing with laser scan speed. In vitro tests were used to evaluate the corrosion behavior and bioactivity of the treated samples in simulated body fluid (SBF). The corrosion test included open circuit potential (OCP), potentiodynamic polarization, and electrochemical impedance spectroscopy (EIS). The polarization resistance (Rp) increased from 3.345 × 10⁵ Ω·cm² for the untreated alloy to 1.90838 × 10⁷ Ω·cm² for the sample treated at 500 mm/s. The total resistance (Rt) increased from 1190 Ω to 19009 Ω. After immersion in SBF, Rt reached 51044 Ω and the protection efficiency increased to 99.24%. Bioactivity shows the surface attracted the hydroxyapatite (HAp) particles formed from SBF solution. These results demonstrate that the combination of Nd:YAG laser treatment at 500 mm/s and BaTiO₃-PEEK composite coating significantly enhances the corrosion resistance and bioactivity of Ti13Nb13Zr alloy, with reduced porosity due to lower heat exposure.
neodymium-doped yttrium aluminum garnet fiber laser, Ti13Nb13Zr alloy, barium titanate, polyetheretherketone, corrosion behavior, bioactivity
The properties of biomaterials, such as biocompatibility, bioactivity and mechanical performance, determine their classification and suitability for biomedical applications. Polymers (i.e., polyetheretherketone (PEEK) and polyvinylpyrrolidone (PVP)), ceramics (hydroxyapatite (HAp) and zirconia (Zr)) and glasses (i.e., SiO₄) have emerged as the most successful biomaterials applied in the fields of orthopedics, coating and dentistry [1-3]. The biomedical alloys, such as stainless steel and titanium alloys, possess high mechanical properties in addition to their biocompatibility. These alloys are designed to be compatible with the human body, exhibiting no toxicity, allergies, or immune system responses, while also offering exceptional corrosion resistance. The surface of biological material has garnered attention from researchers because it is in direct contact with body fluids and tissues, and therefore determines the material's acceptance or rejection by the environment. Surface properties include biocompatibility, corrosion resistance, adhesion and wettability with human tissue, and other properties of the material. Composite techniques mixing with different materials or coatings have been applied to enhance the properties. RF magnetron sputtering was used to coat Ti 6Al4V and cpTi alloy with TiO₂, Al₂O₃ and HAp, while other methods used composite CNT and polymers to enhance the surface of Ti alloy for orthopedics, scaffolds, and dentistry [4, 5]. Some studies have investigated modifying the surface of Ti6Al4V alloy using Nd:YAG laser treatment followed by microarc oxidation (MAO) to improve the bio-enhanced surface and its corrosion resistance. Another study investigated coating Ti13Nb13Zr alloy with carbon using an electrodeposition method, followed by high-energy laser treatment to form titanium carbides. The coated layer after treatment improved properties such as the mechanical properties and corrosion resistance of the surface. Another method used MAO with Nd:YAG laser treatment to modify the surface of Ti13Nb13Zr alloys, showing improvements in corrosion resistance, bio-enhanced properties, and changes in surface roughness [6-9].
Some trends have emerged in the use of materials that possess not only biocompatibility and corrosion resistance but also antibacterial properties, including advanced materials such as barium titanate (BaTiO₃). Methods for its preparation and applications have varied. For example, co-precipitation has been used to treat wounds, where it acts as an antibacterial agent, promotes tissue healing, and stimulates fibroblasts. Functionalization and integration of BaTiO₃-based nanocarriers have emerged as promising platforms for targeted drug delivery due to their unique combination of biocompatibility, piezoelectric properties, and responsiveness to external stimuli [10]. Another approach involved the fabrication of titanium-titanium nanoparticles (BTNPs) using the co-precipitation method of barium carbonate and titanium dioxide at five different concentrations to study their anticancer activity and the effect of material concentration. The study demonstrated their effectiveness in combating cancer cells at increasing concentrations [11]. BaTiO₃ powders were used at concentrations ranging from 30% to 80% by volume to form a graphene/BaTiO₃/PMMA composite. The results showed that the biomaterial's ability to stimulate bone formation increased proportionally with increasing concentration, thus making it applicable in dentistry and bone cement [12]. The focus was not only on manufacturing advanced ceramic materials but also on developing metals to obtain materials with suitable mechanical properties or properties close to those of human bone and with less toxicity. The biomedical titanium alloy (CPTi, Ti-Al-V, Ti-Al-Nb, Ti-Nb-Zr...) was specially designed to have distinctive mechanical properties and to withstand the corrosive environment in the body due to the titanium oxide layer TiO, TiO₂..., which ensures the long-term sustainability of the implant [13]. The Ti-Nb-Zr alloy possesses mechanical properties, wear and elasticity that enable it to withstand stress during movement. Furthermore, it does not have toxic elements such as Al and V, making it an ideal material for use in bone and dental implants. It also exhibits good corrosion resistance, as demonstrated in previous studies. To achieve even better results, research has focused on coating titanium alloys with a composite of advanced materials, ensuring a material with superior mechanical properties and suitable surfaces within the body. Various coating technologies have emerged, each with its own specifications. The most prominent of these is nano-coating of biomedical materials, which has become a key area of research for improving their frictional properties, durability, and performance [14, 15]. The aim of this study was to prepare three Ti13Nb13Zr alloy samples coated with a BaTiO₃–PVP K30–PEEK composite using a spray coating method, and their surface properties were investigated by treating them with Nd:YAG fiber laser.
Table 1. Chemical composition of Ti13Nb13Zr alloy
|
Chemical Composition (wt.%) |
|||||||
|
Nb |
Zr |
Fe |
C |
H |
O |
S |
Ti |
|
13.18 |
13.49 |
0.085 |
0.035 |
0.004 |
0.078 |
<0.001 |
Bal. |
The samples were prepared from a Ti13Nb13Zr alloy rod 20mm in diameter (Baoji, China), certificated by the manufacturing company, shown in Table 1 was cut using a wire cutter machine to 2 mm thickness disks. The samples were ground by SiC grinding paper with (p 120-400) grit, then the samples were cleaned using absolute ethanol 99% twice and one time in distilled water using the ultrasonic cleaner bath (1800 QT, China).
Three Ti13Nb13Zr alloy coated with a four-layer PEEK/BaTiO₃ composite and treated at various laser scanning rates (100 mm/s, 300 mm/s, 500 mm/s) were tested as follows: (1) X-ray diffraction (XRD) analysis: XRD data were collected on a diffractometer Shimadzo6000, Japan with CuKα radiation to study crystalline structure and present materials with scan range 10-80 degree, 0.04 degree step, count time 0.24 sec. (2) Field emission scanning electron microscopy (FESEM) coupled with energy-dispersive X-ray spectroscopy (EDX) (JEOL-JSM-5600): It was operated at an accelerating voltage of 30 kV, with a working distance of 7.7 mm, a chamber pressure of 4.45 × 10⁻³ Pa, and a spot size of 3.5. (3) Surface properties: The contact angle, roughness and adhesion tests were measured. (4) In vitro test: Corrosion and bioactivity tests were used to study the corrosion resistance behavior and bioactive surface of the samples, respectively. Electrochemical impedance spectroscopy (EIS), Tafel polarization curve and the open circuit potential (OCP) were conducted on the three samples in simulated body fluid (SBF) solution as a corrosion medium (see Table 2), while the bioactivity and bioactivity were assessed after immersing the samples in the SBF solution for one month. The samples were immersed in the aforementioned fluids and tested by XRD, FESEM and EDX to test the results.
Table 2. Chemical composition of simulated body fluid (SBF) solution [16]
|
Item |
Reagent |
Concentration (g/L) |
|
1 |
8.036 |
NaCl |
|
2 |
0.352 |
NaHCO3 |
|
3 |
0.225 |
KCl |
|
4 |
0.230 |
K2HPO4 |
|
5 |
0.311 |
MgCl2·6H2O |
|
6 |
0.293 |
CaCl2 |
|
7 |
0.072 |
Na2SO4 |
5.1 X-ray diffraction test
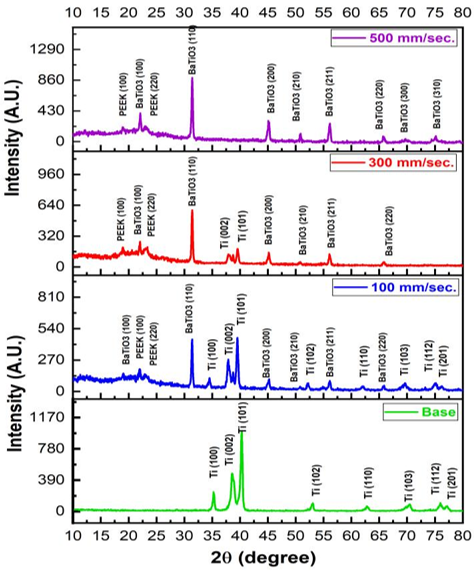
The XRD patterns of all treated and coated samples are shown in Figure 1. The diffraction peaks of the Ti13Nb13Zr alloy matched well with ICDD (International Centre for Diffraction Data) card No. 044-1294 for titanium, with the highest intensities observed at 2θ = 38.85° and 40.77° corresponding to the (101) and (002) planes, respectively. The diffraction pattern of the nanopowder of BaTiO₃ also showed a good match with the ICDD card No. 31-0174. Furthermore, two anatase phase diffraction peaks of TiO₂ occurred at 2θ = 25.28° and 48.00°, indexed to (101) and (200) planes, respectively, which were consistent with the ICDD card No. 21-1272.
The XRD pattern for PEEK shows good matching with JCPDS (Joint Committee on Powder Diffraction Standards, now part of the ICDD database) No. 00-066-1662 for PEEK polymer (2θ = 18.73° and 22.55°) with Miller indices (100) and (220) with decreasing intensity at increasing laser scan speed. The appearance of titanium peaks in the samples coated and treated at speeds of 100 and 300 mm/s disappeared in the sample treated at a speed of 500 mm/s. The BaTiO₃ peaks appeared in all samples treated at 2θ = 22.1°, 31.6°, 45°, 51°, 56.2° and 65.8° with Miller indices (001), (110), (200), (210), (211) and (220), respectively. Six peaks were obtained, three significant peaks and three minor peaks. With 500 mm/s, two minor peaks also appeared at 2θ = 70° and 75° with Miller (300) and (310) [17]. The results show the appearance of titanium peaks in the samples treated at 100 and 300 mm/s laser scan speed only, but did not appear in the sample treated at 500 mm/s; this happened because the increase in scan speed reduced porosity in the coating layer. The BaTiO₃ peaks also appeared in all peaks, especially for the sample treated at a 500 mm/s laser scan speed.
Figure 1. X-ray diffraction (XRD) pattern comparison for all treated and coated samples
5.2 Energy-dispersive X-ray spectroscopy test
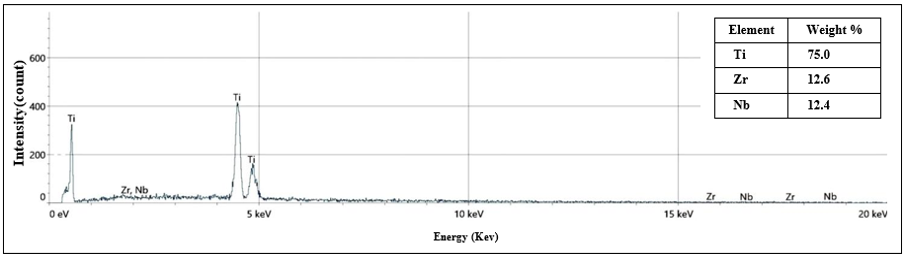
The EDX elemental analysis for the uncoated Ti13Nb13Zr alloy revealed the presence of Ti, Nb, and Zr, as illustrated in Figure 2, with compositions closely matching those provided by the supplier in Table 1. The detected energy transitions corresponded to Ti (Kα= 4.44 keV, Lα = 0.45 keV), Zr (Lα = 2.044 keV), and Nb (Lα = 2.16 keV). The EDX elemental analysis of the uncoated Ti13Nb13Zr alloy revealed the presence of Ti, Nb, and Zr, as shown in Figure 2. The detected energy transitions corresponded to Ti (Kα = 4.44 keV, Lα = 0.45 keV), Zr (Lα = 2.044 keV), and Nb (Lα = 2.16 keV).
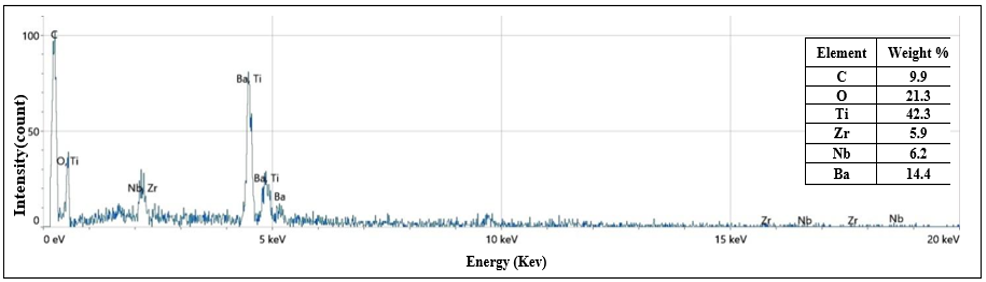
Figures 3 and 4 show the EDX elemental analysis of the coated sample treated at a laser scanning speed of 100 mm/s. The results confirmed the presence of BaTiO₃ composite coating in addition to Ti, O, Nb, Zr, and C elements. The barium peak (Kα = 4.46 keV) was nearly overlapped with the Ti peak, while oxygen and carbon appeared at Kα = 0.5 keV and Kα = 0.27 keV, respectively. Nevertheless, the main constituent elements of the Ti13Nb13Zr alloy were still observed, indicating the presence of pores within the coated layer [12, 18].
Figure 2. Energy-dispersive X-ray spectroscopy (EDX) elemental analysis for uncoated Ti13Nb13Zr alloy
Figure 3. Energy-dispersive X-ray spectroscopy (EDX) elemental analysis for the sample coated and treated at a 100 mm/s laser scan speed
Figure 4. Energy-dispersive X-ray spectroscopy (EDX) elemental analysis for the sample coated and treated at a 300 mm/s laser scan speed
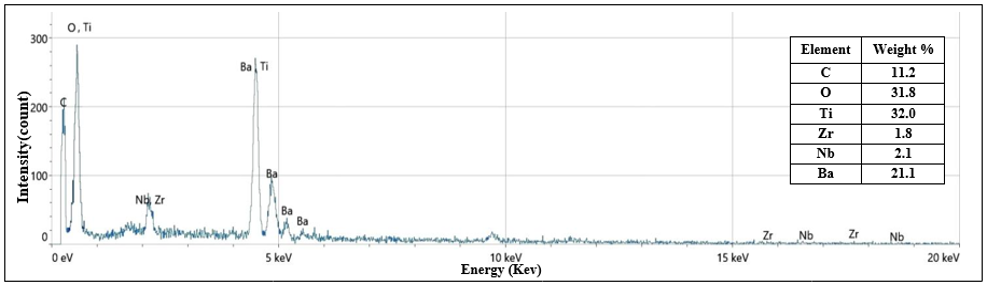
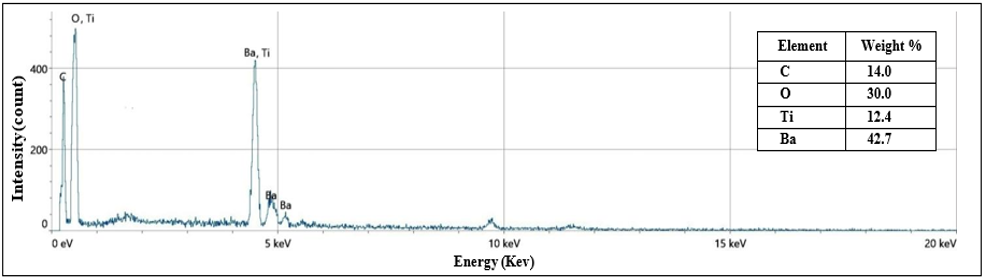
Figure 5. Energy-dispersive X-ray spectroscopy (EDX) elemental analysis for the sample coated and treated at a 500 mm/s laser scan speed
The EDX elemental analysis of the coated sample treated at the laser scanning speed of 500 mm/s is shown in Figure 5. The results of the EDX elemental analysis confirmed the presence of Ba, Ti, O and C elements, but there were no peaks of Zr or Nb elements detected. This means that this treatment decreases the porosity of the coating due to the increased speed of the laser scanning. Moreover, a higher peak intensity was noticed in the peaks of barium and oxygen. The energy transitions detected are O (Kα = 0.5 keV) and C (Kα = 0.277 keV).
5.3 Field emission scanning electron microscopy test
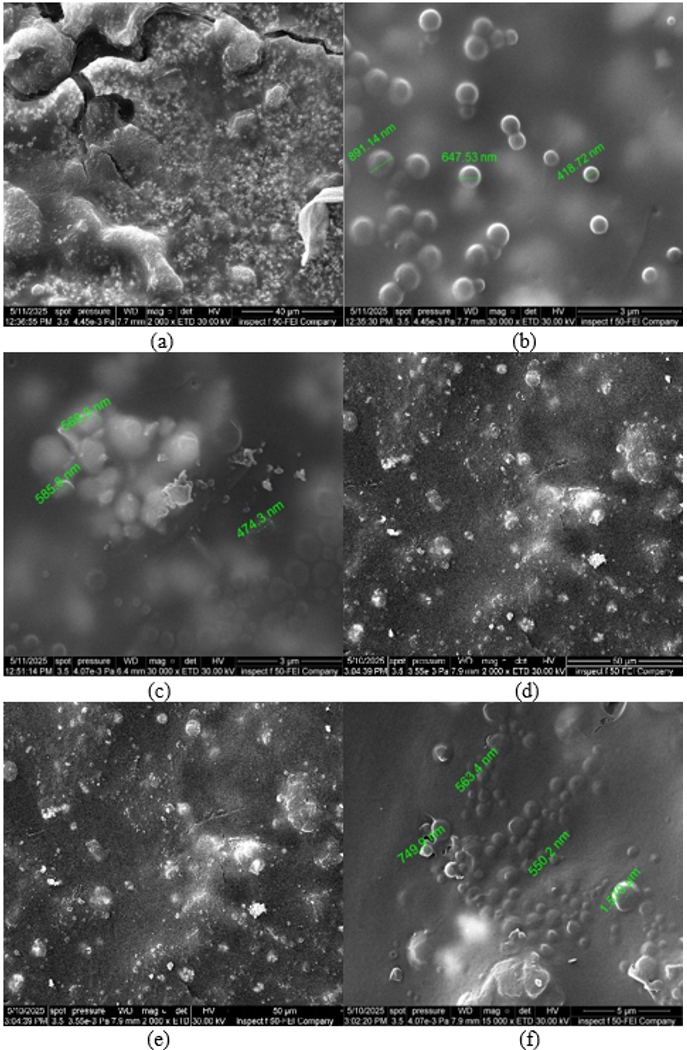
FESEM images of all coated samples were captured by varying the magnification from 40 µm to 3 µm, and these images are shown in Figure 6. The micrographs show that the particles are predominantly spherical in shape with a relatively even particle size distribution from 0.41872 to 1.570 µm, which is in line with the previously reported results [19]. Agglomeration was seen because of the excellent adhesive properties of the PVP polymer, which helps in promoting the adhesion of the particles to each other. In addition, the polymer completely surrounds the agglomerated particles and enhances their attachment to the coated surface [7].
When the laser scanning speeds are low, the coated surface will be exposed to laser heat for a longer period of time and a crack will be formed due to partial degradation of PEEK by laser heating. On the other hand, the higher the scanning speed, the lower the heat exposure, which would mean a softening (annealing) effect without much degradation of the PEEK matrix; hence, the formation of cracks would be reduced and may lead to a smoother surface [20]. The results of these observations suggest that the laser scanning speed has a significant effect on thermal effects in the coated layer, which directly result in changes in the surface morphology and structural integrity of the coated layer.
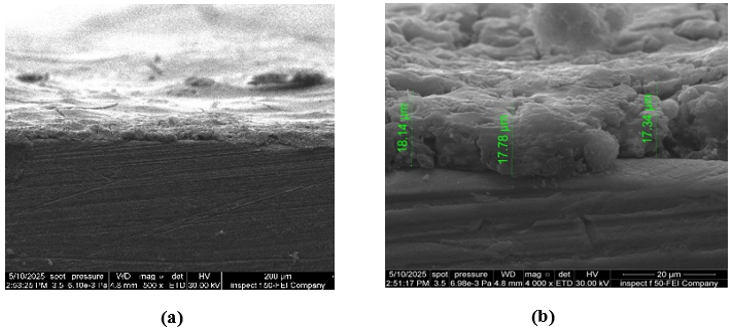
The cross-section FESEM images for the 500 mm/s laser scan speed coated sample in Figure 7 show that the thickness varied between 17.34 µm and 18.14 µm.
Figure 6. Field emission scanning electron microscopy (FESEM) images for coated samples at different magnifications (a and b): 100 mm/s, (c and d): 300 mm/s and (e and f): 500 mm/s
Figure 7. Cross-section field emission scanning electron microscopy (FESEM) images for 500 mm/s laser scan speed, coated sample
5.4 Adhesion test
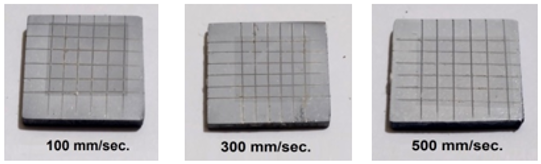
The cross-cut adhesion test images for three treated samples, Figure 8 and Table 3, show perfect adhesion, where all samples achieved zero removed area and 100% adhesion according to ASTM D3359.
Figure 8. Cross-cut adhesion test images for all coated samples
Table 3. Cross-cut adhesion test results for all coated samples according to ASTM D3359
|
Speed Laser (mm/s) |
Removed Area (%) |
Classification |
|
100 |
0 |
5B |
|
300 |
0 |
5B |
|
500 |
0 |
5B |
5.5 Wettability contact angle test
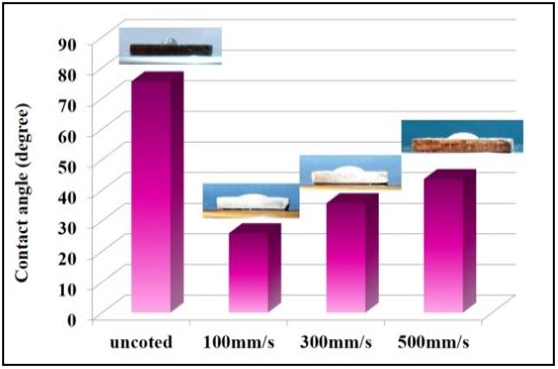
A typical micro-pipette was used to drop 5 µL of deionized water on each sample, and a wettability (contact angle) test was carried out. As clearly shown in Figure 9 and Table 4, the contact angle increased as the laser scanning speed increased. The contact angle of the sample was 43.63° when treated with a laser at a speed of 500 mm/s, and 25.94° when the sample was treated at 100 mm/s.
This behaviour can be explained in terms of the higher porosity of the coating layer at lower laser scanning speed, as mentioned above. A higher porosity improves the surface wettability, which may facilitate the bioactivity and cell proliferation [6, 21].
Figure 9. Wettability contact angle for the samples
Table 4. Wettability contact angle results for all samples
|
Item |
Contact Angle (degree) |
|
Base (Uncoated) |
75.52 |
|
Coated and Treated (100 mm/s) |
25.94 |
|
Coated and Treated (300 mm/s) |
35.75 |
|
Coated and Treated (500 mm/s) |
43.63 |
5.6 Surface roughness test
To perform the surface roughness test, a Tel-Instruments TR-220 Multi-Function Avionics Test Set was used [22]. As indicated in the results in Table 5, surface roughness decreased with increasing laser scanning speed. Adverse mechanical and biological effects, such as irritation of neighbouring tissues, bacterial accumulation, and increased wear in artificial joints, may occur if the surface is rough. Furthermore, rough surfaces can create stress concentrations at the peaks of the surface and micro-abrasions, which could start microscopic cracks in the material. Surface irregularities can also impact the distribution of the force in neighbouring cells and tissues [23, 24]. The higher laser scanning speed is thought to be responsible for this behaviour because the laser beam is less likely to affect the surface irregularities of the coated surface, thereby reducing overall surface roughness [6].
Table 5. Roughness test results
|
Speed Laser (mm/s) |
Roughness Average (µm) |
|
100 |
0.224 |
|
300 |
0.101 |
|
500 |
0.090 |
5.7 Coated layer hardness test
The hardness test for the base and three treated samples shows an increase in hardness with increasing laser scan speed; i.e., the increase in speed allows the laser energy to be distributed more uniformly on the coated layer, making the particles stick together more tightly, especially in the presence of the PEEK polymer and making the coated layer harder, as shown in Table 6.
Table 6. Hardness test results for all treated samples
|
Speed Laser (mm/s) |
Hardness (HV) |
|
100 |
210 |
|
300 |
225 |
|
500 |
245 |
5.8 Electrochemical corrosion test
5.8.1 Open circuit potential test
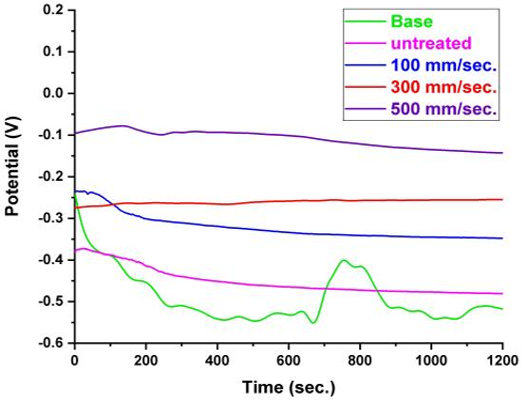
The OCP test comparison for the samples in Figure 10 and Table 7 shows an increase in OCP value with increasing laser scan speed, i.e., the sample surface became more passive. This happened due to a decrease in porosity and an increase in hardness with increasing laser scan speed.
Figure 10. Open circuit potential (OCP) test for all samples
Table 7. Open circuit potential (OCP) test results for all samples extracted from Figure 10
|
Item |
OCP (volt) |
|
Base (Uncoated) |
-0.518 |
|
Coated (Untreated) |
-0.481 |
|
Coated and Treated (100 mm/s) |
-0.348 |
|
Coated and Treated (300 mm/s) |
-0.255 |
|
Coated and Treated (500 mm/s) |
-0.143 |
5.8.2 Tafel polarization curve
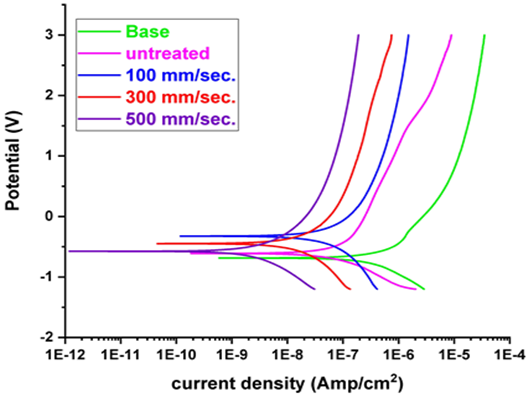
The Tafel polarization curve comparison in Figure 11 and Table 8 shows the decrease in corrosion rate with increasing laser scan speed. Also, the sample coated without laser treatment achieved a decrease in the corrosion rate compared to that not treated. The sample treated at 500 mm/s laser scan speed achieved 1.964 × 10⁻⁵ millimeters per year (mmpy) compared with 1.169 × 10⁻³ mmpy for the untreated sample, i.e., the corrosion rate decreased about 59 times.
Figure 11. Tafel polarization curve comparison for the samples
Table 8. Corrosion characteristics for the samples
|
Item |
E corr. (V) |
I corr. (A/cm2) |
Corrosion Rate (mmpy) |
|
Base |
-0.688 |
1.324 × 10⁻⁷ |
1.169 × 10⁻³ |
|
Untreated |
-0.610 |
4.467 × 10⁻⁸ |
3.946 × 10⁻⁴ |
|
Coated and Treated (100 mm/s) |
-0.326 |
2.092 × 10⁻⁸ |
1.848 × 10⁻⁴ |
|
Coated and Treated (300 mm/s) |
-0.434 |
7.933 × 10⁻⁹ |
7.008 × 10⁻⁵ |
|
Coated and Treated (500 mm/s) |
-0.572 |
2.224 × 10⁻⁹ |
1.964 × 10⁻⁵ |
To better evaluate the results, we can calculate the protection efficiency percentage from the relation below [24]:
$P E=\frac{i_{\text {corr.uncoated }}-i_{\text {corr.coated }}}{i_{\text {corr.uncoated }}} \times 100 \%$ (1)
where, PE is the protection efficiency, icorr.uncoated and icorr.coated are the corrosion currents for the uncoated and coated samples, respectively.
Also, the determination of the polarization resistance, according to the Stern-Geary equation below, can give us more evaluation of the results.
$R p=\frac{\beta a \times \beta c}{2.303(\beta a+\beta c) I \text { corr} .}$ (2)
where, Rp refers to the polarization resistance measured in (Ω/cm2), βa is the Tafel slope for the anodic region, βc is the Tafel slope for the cathodic region and I corr. is the corrosion current density (A/cm2).
The calculated protection efficiency in Table 9 shows a good increase with increasing laser scan speed, where the sample treated at 500 mm/s achieved 98.32% protection efficiency. Also, the untreated sample achieved 66.26% protection efficiency from coating only.
Table 9. Calculated corrosion parameters for all samples
|
Rp (Ω·cm²) |
βa (V/dec) |
βc (V/dec) |
PE (%) |
I corr. (A/cm2) |
Item |
|
3.34533 × 10⁵ |
0.188 |
0.223 |
------ |
1.324 × 10⁻⁷ |
Base |
|
9.80890 × 10⁵ |
0.222 |
0.185 |
66.26 |
4.467 × 10⁻⁸ |
Coated untreated |
|
1.99376 × 10⁶ |
0.208 |
0.198 |
84.67 |
2.092 × 10⁻⁸ |
Coated and Treated (100 mm/s) |
|
5.62323 × 10⁶ |
0.203 |
0.208 |
94.00 |
7.933 × 10⁻⁹ |
Coated and Treated (300 mm/s) |
|
1.90838 × 10⁷ |
0.186 |
0.206 |
98.32 |
2.224 × 10⁻⁹ |
Coated and Treated (500 mm/s) |
The polarization resistance increased with increasing laser scan speed and reached 1.90838 × 10⁷ Ω·cm² for the sample treated at 500 mm/s, compared with 3.34533 × 10⁵ Ω·cm² for the untreated sample.
5.8.3 Electrochemical impedance test
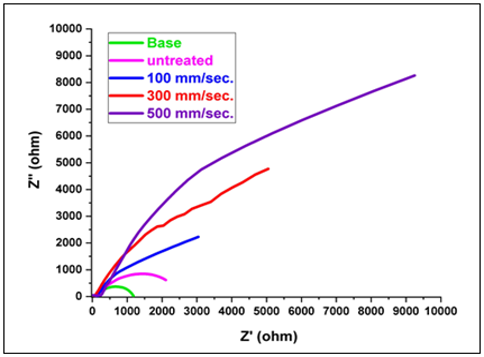
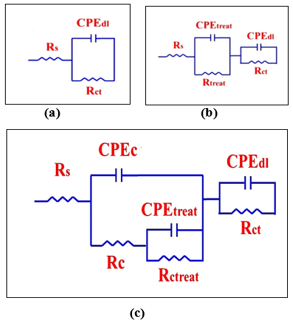
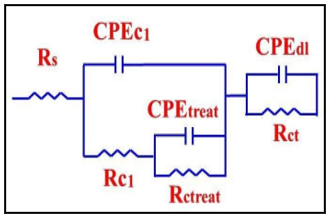
The measured Nyquist diagram comparison for all samples in Figure 12 shows an increase in impedance with increasing laser scan speed. The equivalent circuit used for fitting an uncoated sample in Figure 13(a) shows a typical circuit, while the fitting of an untreated sample shows an equivalent circuit with a porous layer covering the sample surface, as shown in Figure 13(b). The fitting of all laser-treated samples shows a new layer connected to the coated layer, as shown in Figure 13(c); i.e., the treatment with laser creates a less porous and harder layer on the surface of the coated layer.
Figure 12. Nyquist diagram comparison for all samples
The fitted parameters in Table 10 shows increasing in the total resistance for samples after coating and treating with laser, where the coated sample achieved 2659 Ω total resistance compared with 1190 ohm for the uncoated sample. Also, the 500 mm/s laser scan speed treated sample achieved 19009 Ω total resistance, i.e., 19 times than uncoated sample and that agrees with the results of previous studies [7-26].
Table 10. Fitted parameters for all samples
|
Parameters |
Uncoated |
Untreated |
100 mm/s |
300 mm/s |
500 mm/s |
|
Rs (ohm) |
105 |
111 |
107 |
104 |
112 |
|
Rdl (ohm) |
1085 |
1100 |
1070 |
1090 |
1110 |
|
Rtreat (ohm) |
------ |
1448 |
1415 |
1480 |
1401 |
|
Rc |
------ |
------ |
4219 |
7965 |
16386 |
|
CPEdl (F) |
3.025 × 10⁻⁵ |
4.0064 × 10⁻⁵ |
3.6712 × 10⁻⁵ |
3.2133 × 10⁻⁵ |
3.1739 × 10⁻⁵ |
|
n1 |
0.963 |
0.984 |
0.966 |
0.990 |
0.991 |
|
CPEtreat (F) |
------ |
9.1217 × 10⁻⁵ |
8.847 × 10⁻⁵ |
8.4028 × 10⁻⁵ |
8.0075 × 10⁻⁵ |
|
n2 |
------ |
0.977 |
0.948 |
0.981 |
0.998 |
|
CPEc (F) |
------ |
------ |
9.847 × 10⁻⁷ |
4.1537 × 10⁻⁸ |
1.5194 × 10⁻⁹ |
|
n3 |
------ |
------ |
0.992 |
0.956 |
0.997 |
|
Rtotal (ohm) |
1190 |
2659 |
6811 |
10639 |
19009 |
5.9 After immersing in simulated body fluid solution (in vitro test)
5.9.1 X-ray diffraction test
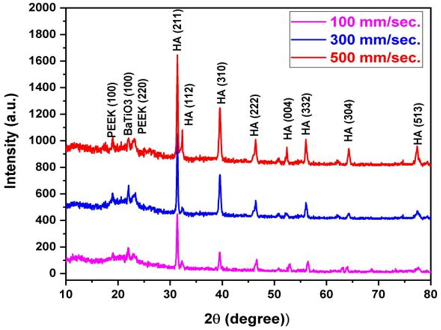
The XRD patterns of the samples treated with laser scanning speeds of 100, 300 and 500 mm/s for one month in SBF solution are displayed in Figure 14. The patterns showed the presence of the characteristic peaks of barium titanate and PEEK, and hydroxyapatite (HAp) peaks occurred clearly, corresponding with JCPDS card No. 00-009-0432, suggesting successful bioactivity. The characteristic PEEK peaks appeared at 2θ = 8.8° and 22.8°, corresponding to the Miller indices (100) and (220), respectively. In addition, BaTiO₃ peaks were observed at 2θ = 22.1° and 31.6°, indexed to the (001) and (110) planes, respectively [26].
Figure 14. X-ray diffraction (XRD) patterns comparison for all coated samples after one month immersion in simulated body fluid (SBF) solution
The (112), (112) and (222) planes of HAp were detected in the main diffraction peaks at 2θ = 31.8-32° and 46.9°, and other peaks were seen at 2θ = 54.6 and 56, which correspond to the (004) and (332) planes, respectively. The HAp formation is further supported and an enhancement in bioactivity capability is indicated by these results. The comparison of the XRD pattern of all laser-treated samples after immersion in the SBF solution showed that the intensity of HAp phases increased with the increase in laser scanning speed. This indicates that the bioactivity of the coated layers is increased with the increase in the laser scanning speed.
5.9.2 Energy-dispersive X-ray spectroscopy test
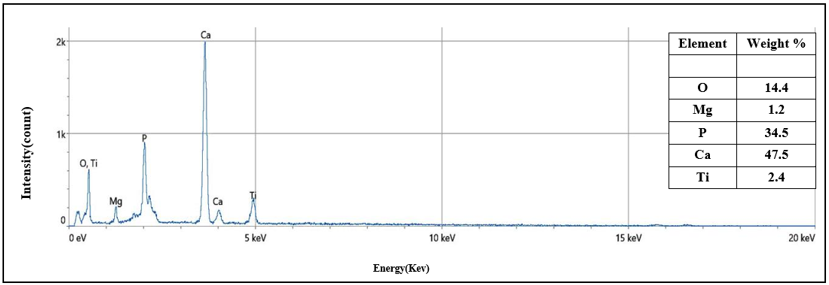
The elemental analysis of the uncoated sample after exposure in the SBF solution for 1 month, as shown in Figure 15, showed that the sample contained carbon from PEEK, titanium from the oxidized surface of the alloy and oxygen, calcium, phosphorus and magnesium from HAp that was formed in the SBF solution.
Figure 15. Energy-dispersive X-ray spectroscopy (EDX) elemental analysis for uncoated sample after one month immersion in simulated body fluid (SBF) solution
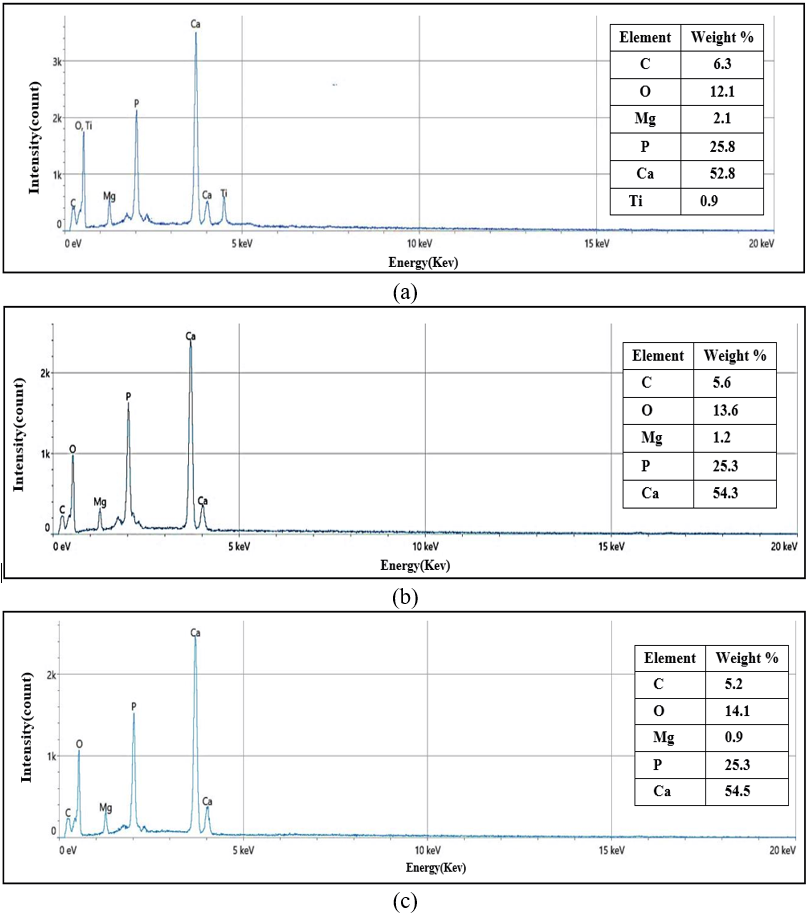
Figure 16. Energy-dispersive X-ray spectroscopy (EDX) elemental analysis for (a) 100 mm/s, (b) 300 mm/s and (c) 500 mm/s, after one month immersion in simulated body fluid (SBF) solution
In the same way, the elemental analysis of the samples treated at the laser scanning speed of 100, 300 and 500 mm/s after one month in the SBF solution (see Figure 16), showed the same elements with different intensities. Increased calcium and phosphorus peaks and decreased carbon content were seen, suggesting improved HAp formation. The detected energy transitions correspond to Ca Kα = 3.69 keV and Kβ = 4.09 keV, P Kα = 2.01 keV, and Mg Kα = 1.25 keV.
5.9.3 Field emission scanning electron microscopy test
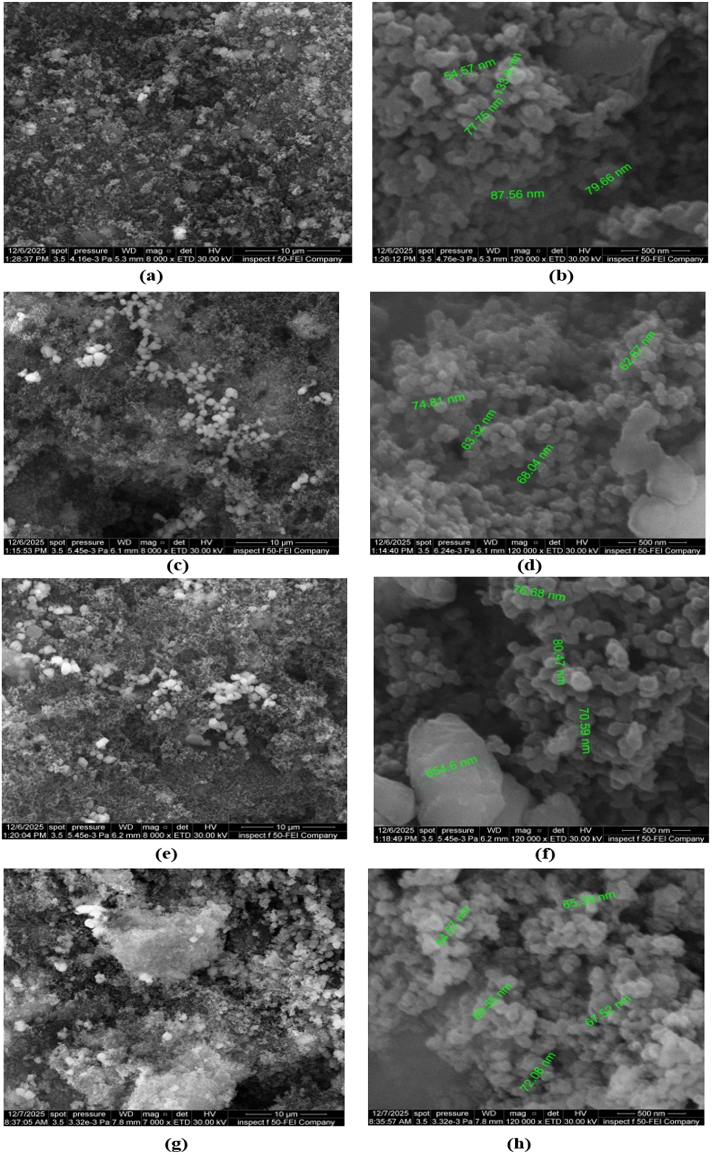
Figure 17 presents FESEM micrographs of uncoated and treated samples after one month of immersion in SBF solution, at magnifications ranging from 10 µm to 500 nm. The images reveal the formation of HAp deposits on the treated surface, indicating good surface biocompatibility [4]. The increase in agglomeration of HAp particles formed from SBF solution with increasing laser scan speed from 100 to 500 mm/s. This can be considered as an indication to increase the ability of increased bioactivity characteristics with increasing scanning speed. The spherical particles with fine grains, homogeneous and uniform distribution of components, increasing in agglomeration, reveal the presence of nanometric particles of HAp particles formed from SBF solution with increasing laser scan speed, with a nanometric particle size about 54.57 nm to 654.6 nm [27-29].
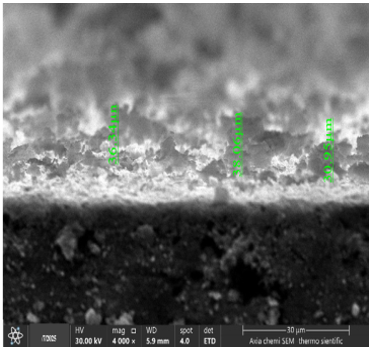
The cross-section FESEM images for laser-treated samples after one month immersion in SBF solution at 500 mm/s. Figure 18 shows that the thickness varied among 30.98 µm, 36.34 µm and 38.06 µm. The thickness of the growth layer of HAp from SBF increases with increasing the thickness of the coated layer compared with.
Figure 17. Field emission scanning electron microscopy (FESEM) images for laser treated samples after one month immersion in simulated body fluid (SBF) solution (a and b): uncoated, (c and d): 100 mm/s, (e and f): 300 mm/s, (g and h): 500 mm/s
Figure 18. Cross-section field emission scanning electron microscopy (FESEM) images for laser-treated samples at 500 mm/s after one month immersion in simulated body fluid (SBF) solution
5.9.4 Corrosion test
In this part, we compare the optimum sample (500 mm/s) laser treated corrosion characteristics before and after one month of immersion in SBF solution.
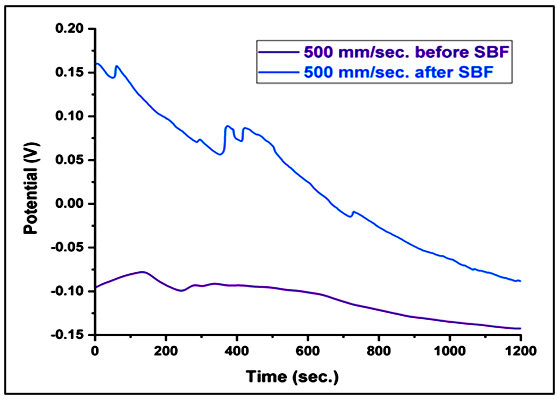
A. The OCP shows an increase in passivation from (OCP = -0.143 V) for the sample before immersion to (OCP = -0.09 V) after immersion, which resulted from a new HAp layer, as shown in Figure 19.
Figure 19. Open circuit potential (OCP) test comparison for 500 mm/s laser scan speed treated sample before and after one month immersion in simulated body fluid (SBF) solution
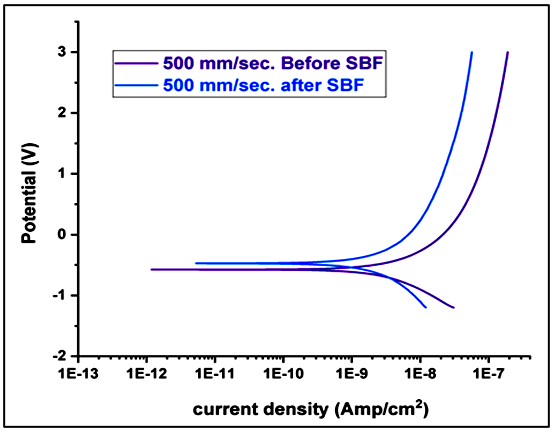
B. The Tafel polarization curve in Figure 20 also shows a decrease in corrosion current density from 2.224 × 10⁻⁹ A/cm2 to 1.001 × 10⁻⁹ A/cm2 before and after immersion in SBF solution for one month. The corrosion rate decreased to 8.843 × 10⁻⁶ mmpy after immersion compared with 1.964 × 10⁻⁵ mmpy before immersion. Also, the calculated protection efficiency increased to 99.24% after immersion compared with 98.32% before immersion.
Figure 20. Tafel polarization curve test comparison for 500 mm/s laser scan speed treated sample before and after one month immersion in simulated body fluid (SBF) solution
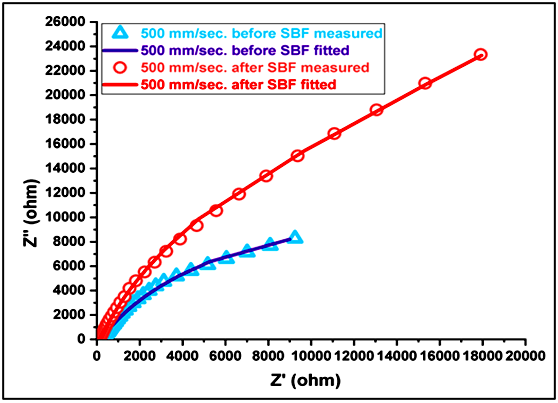
C. The EIS test in Figure 21 also shows an increase in resistance after immersion in SBF solution, where the total resistance increased to 51044 Ω after immersion, compared with 19009 Ω before immersion. Also, the equivalent circuit used for fitting the Nyquist curve did not show a difference from that used before immersion, as shown in Figure 22, which means the HAp formed from the treated surface of the sample and linked to other particles across the pores until they went outside the final coated layer to cover it and cover all the sample surface.
Figure 21. Electrochemical impedance spectroscopy (EIS) Nyquist curves for 500 mm/s laser scan speed treated sample before and after one month immersion in simulated body fluid (SBF) solution
From previous results, we conclude that:
•Nd:YAG laser treatment of the coated Ti13Nb13Zr alloy significantly improved the corrosion resistance and reduced surface defects. The corrosion rate decreased by approximately 59 times, while the protection efficiency reached 98.32% before immersion and 99.24% after immersion in SBF solution.
•FESEM results indicated that laser treatment assisted in the uniform distribution of laser energy across the coated surface. Laser energy also improved particle bonding in the presence of the PEEK polymer, leading to a dense coating layer with fewer cracks and porosity at high scanning speeds.
•The wettability of the coating surface increased with increasing laser scanning speed (the contact angle increased from 25.94° to 43.63%). Furthermore, the surface roughness decreased from 0.224 µm at 100 mm/s to 0.090 µm at 500 mm/s due to the reduced thermal effect at high scanning speeds. The achieved surface properties were favorable for cell attachment.
•The bioactivity of the coated samples was improved after soaking in SBF for one month through HAp formation on the surface of the laser-treated samples. FESEM and EDS analyses revealed more HAp deposition with increased scanning speeds. The coating layer thickness of the 500 mm/s sample was measured to be between 17.34–18.14 µm before immersion and between 30.98–38.06 µm after immersion in SBF solution.
Overall, laser-coating treatment carried out at a scanning speed of 500 mm/s resulted in improved surface properties such as high corrosion resistance, low porosity, favorable wettability, and increased bioactivity. Lower scanning speeds increased the thermal effect on the sample due to longer laser exposure time, while higher laser scanning speeds decreased the thermal effect and improved surface characteristics of the coating layer that may be used for biomedical implant applications.
[1] Marin, E., Lanzutti, A. (2024). Biomedical applications of titanium alloys: A comprehensive review. Materials, 17(1): 114. https://doi.org/10.3390/ma17010114
[2] Abdali, W., Hamdi, D.A., Kadhim, F.M. (2018). Reinforcement of poly (polymethylmethacrylate) with carbon fiber and alumina as a composite material for orthopedic implant. International Journal of Mechanical Engineering and Technology, 9(10): 388-398.
[3] Kadhum, R.N., Hamad, T.I. (2025). Barium titanate synthesis, mechanism of action and its applications in dentistry: A literature review. Journal of Applied Biomaterials & Functional Materials, 23: 22808000251375714. https://doi.org/10.1177/22808000251375714
[4] Hamdi, D.A., Jiang, Z.T., No, K., Rahman, M.M., et al. (2019). Biocompatibility study of multi-layered hydroxyapatite coatings synthesized on Ti-6Al-4V alloys by RF magnetron sputtering for prosthetic-orthopaedic implant applications. Applied Surface Science, 463: 292-299. https://doi.org/10.1016/j.apsusc.2018.08.157
[5] Hamdi, D.A. (2018). Study the structure of hydroxyapatite reinforced by carbon nanotube coated Ti alloy. International Journal of Mechanical Engineering and Technology, 9(9): 1010-1021. https://iaeme.com/MasterAdmin/Journal_uploads/IJMET/Vol_9_issue_9/IJMET_09_09_110.pdf.
[6] Sypniewska, J., Szkodo, M., Majkowska-Marzec, B., Pawłowski, Ł., et al. (2025). Hybrid laser-micro-arc oxidation techniques for enhanced biocompatibility and surface modification of Ti13Nb13Zr alloy in biomedical applications. Applied Surface Science, 698: 163136. https://doi.org/10.1016/j.apsusc.2025.163136
[7] Majkowska-Marzec, B., Tęczar, P., Bartmański, M., Bartosewicz, B., Jankiewicz, B.J. (2020). Mechanical and corrosion properties of laser surface-treated Ti13Nb13Zr alloy with MWCNTs coatings. Materials, 13(18): 3991. https://doi.org/10.3390/ma13183991
[8] Al-Kinani, H.K., Kianvash, A., Rezvani, M. (2025). Surface modification of Ti-13Nb-13Zr implant alloy by ZrO2 nano-particles coating using RF plasma magnetron sputtering. Results in Engineering, 28: 107824. https://doi.org/10.1016/j.rineng.2025.107824
[9] Rościszewska, M., Shimabukuro, M., Ronowska, A., Mielewczyk-Gryń, A.D., Zieliński, A., Hanawa, T. (2024). Enhanced bioactivity and mechanical properties of silicon-infused titanium oxide coatings formed by micro-arc oxidation on selective laser melted Ti13Nb13Zr alloy. Ceramics International, 50(21 Part C): 43979-43993. https://doi.org/10.1016/j.ceramint.2024.08.249
[10] Shah, A.B., Khan, A., Dwivedi, S., Musarrat, J., Azam, A. (2018). Antibacterial and antibiofilm activity of barium titanate nanoparticles. Materials Letters, 229: 130-133. https://doi.org/10.1016/j.matlet.2018.06.107
[11] Ćurčić, M., Hadžić, B., Gilić, M., Lazarević, Z. (2025). BaTiO₃ nanocarriers: Advancing targeted therapies with smart drug release. Pharmaceutics, 17(9): 1203. https://doi.org/10.3390/pharmaceutics17091203
[12] Fakhar-e-Alam, M., Saddique, S., Hossain, N., Shahzad, A. (2023). Synthesis, characterization, and application of BaTiO₃ nanoparticles for anti-cancer activity. Journal of Cluster Science, 34(4): 1745-1755. https://doi.org/10.1007/s10876-022-02346-y
[13] Hamdi, D.A. (2020). Investigating the mechanical and microstructure properties of ceramic-PMMA polymer composite. AIP Conference Proceedings, 2213(1): 020043. https://doi.org/10.1063/5.0000429
[14] Mahdi, M.S., Hamdi, D.A. (2025). Investigation of friction for nanocoated and uncoated Ti-6Al-4V substrates via the modified pin-on-disk technique for transfemoral implants. Journal of Biomedical Physics and Engineering, 15(2): 115-124. https://doi.org/10.31661/jbpe.v0i0.2401-1712
[15] Konopatsky, A., Sheremetyev, V., Dubinskiy, S., Zhukova, Y., et al. (2021). Structure and superelasticity of novel Zr-rich Ti-Zr-Nb shape memory alloys. Shape Memory and Superelasticity: Advances in Science and Technology, 7(2): 304-313. https://doi.org/10.1007/s40830-021-00322-5
[16] Ding, S.J. (2003). Properties and immersion behavior of magnetron-sputtered multi-layered hydroxyapatite/titanium composite coatings. Biomaterials, 24(23): 4233-4238. https://doi.org/10.1016/S0142-9612(03)00315-6
[17] Niu, Y., Yu, K., Bai, Y., Wan, H. (2015). Enhanced dielectric performance of BaTiO₃/PVDF composites prepared by modified process for energy storage applications. IEEE Transactions on Ultrasonics, Ferroelectrics, and Frequency Control, 62(1): 108-115. https://doi.org/10.1109/TUFFC.2014.006666
[18] Tomar, R., Pandey, R., Singh, N.B., Gupta, M.K., Gupta, P. (2020). Electrical properties of barium titanate in presence of Sn2+ dopant. SN Applied Sciences, 2(2): 226. https://doi.org/10.1007/s42452-020-2017-8
[19] Lu, S.G., Xu, Z.K., Chen, H., Mak, C.L., Wong, K.H., Li, K.F., Cheah, K.W. (2006). Time-resolved photoluminescence of barium titanate ultrafine powders. Journal of Applied Physics, 99(6): 064103. https://doi.org/10.1063/1.2182075
[20] Gaitanelis, D., Chanteli, A., Worrall, C., Weaver, P.M., Kazilas, M. (2023). A multi-technique and multi-scale analysis of the thermal degradation of PEEK in laser heating. Polymer Degradation and Stability, 211: 110282. https://doi.org/10.1016/j.polymdegradstab.2023.110282
[21] Marmur, A., Della Volpe, C., Siboni, S., Amirfazli, A., Drelich, J.W. (2017). Contact angles and wettability: Towards common and accurate terminology. Surface Innovations, 5(1): 3-8. https://doi.org/10.1680/jsuin.17.00002
[22] Dorméus, E. (2011). Advanced Aerospace Applications. Springer, New York, USA.
[23] Barfeie, A., Wilson, J., Rees, J. (2015). Implant surface characteristics and their effect on osseointegration. British Dental Journal, 218(5): E9. https://doi.org/10.1038/sj.bdj.2015.171
[24] Matos, G.R.M. (2021). Surface roughness of dental implant and osseointegration. Journal of Maxillofacial and Oral Surgery, 20(1): 1-4. https://doi.org/10.1007/s12663-020-01437-5
[25] Yaro, A.S. (2009). The effect of temperature and acid concentration on polarization resistance for a corrosion reaction under activation control. Journal of Engineering, 15(2): 3831-3839. https://doi.org/10.31026/j.eng.2009.02.21
[26] Assis, S.L., Costa, I. (2006). The effect of hydrogen peroxide on the electrochemical behaviour of Ti-13Nb-13Zr alloy in Hanks’ solution. Materials Research, 9(4): 425-429. https://doi.org/10.1590/S1516-14392006000400014
[27] Seenath, A.A., Baig, M.M.A., Mohammed, A.S. (2025). Tribological evaluation of polyether ether ketone (PEEK) nanocomposite coatings reinforced with ceria—Effect of composition, load, speed, counterface, and UV exposure. Polymers, 17(11): 1487. https://doi.org/10.3390/polym17111487
[28] Ungureanu, D.N., Angelescu, N., Ion, R.M., Valentina, S.E., Rizescu, C.Z. (2011). Synthesis and characterization of hydroxyapatite nanopowders by chemical precipitation. In Recent Researches in Communications, Automation, Signal Processing, Nanotechnology, Astronomy and Nuclear Physics, Cambridge, UK, pp. 296-301.
[29] Seo, Y., Nawa, S., Goto, T., Cho, S., Sekino, T. (2025). Densification of hydroxyapatite/zirconia nanocomposites fabricated via low-temperature mineralization sintering process and their mechanical properties. Scientific Reports, 15(1): 2479. https://doi.org/10.1038/s41598-025-85116-w