Murtadha S. Alsafi![]() | Iman J. Abed*
| Iman J. Abed*![]()
© 2023 IIETA. This article is published by IIETA and is licensed under the CC BY 4.0 license (http://creativecommons.org/licenses/by/4.0/).
OPEN ACCESS
In this research, a computer with integrated software connected to a Computer Numerical Control (CNC) milling machine was used to machine presintered Aconia zirconia samples as per the ASTMC1161-13 standard. The aim was to improve the surface characteristics and mechanical properties of presintered zirconia ceramic by varying cutting conditions such as depth of cut (0.1, 0.3, and 0.5 mm), rotational speed (6000, 9000, and 12000 rpm), and tool diameter (1.5 and 2.5 mm). Before sintering, using a bur diameter of 2.5 mm yielded the lowest roughness value of 0.76 µm at 9000 rpm with a depth of 0.1 mm. The surface roughness decreased as the cutting speed increased and cutting depth decreased. After sintering at 1500℃ for 2 hours at a rate of 8℃/min, the maximum hardness value of 1458.73 HV was obtained at 6000 rpm using a bur diameter of 2.5 mm. The highest flexural strength value of 566.67 MPa was obtained at a rotational speed of 6000 rpm, depth of cut of 0.1 mm, and tool diameter of 1.5 mm. The highest surface fracture toughness value of 414.94 MPa/mm2 was obtained at a rotational speed of 12000 rpm, depth of cut of 0.5 mm, and tool diameter of 2.5 mm. Additionally, the use of high cutting speed during the milling processes reduced the mechanical properties of the Aconia zirconia, such as flexural strength and microhardness, when using a tool diameter of 1.5 mm. However, these mechanical properties increased when using a tool diameter of 2.5 mm.
soft machining, Computer Numerical Control (CNC), flexural strength, sintering, zirconia ceramics, milling parameters, surface roughness and microhardness
Due to their mechanical and biological characteristics, as well as their advantageous qualities including strength and biocompatibility, ceramic materials are primarily used in biomedical applications [1]. Zirconia based ceramic has been used in dentistry for producing crown and bridge restorations, endodontic posts, abutments for the implant and the fabrication of aesthetic orthodontic brackets [2]. CAD/CAM systems now frequently employ zirconia. The manufacturer's provided specialist CAD software must be used with a computer in order to create Y-TZP frameworks in three dimensions. Data is supplied to computerized manufacturing CAM equipment once the required work has been scanned, which manufactures the zirconia framework in accordance with a specified method [3].
There are two common techniques available for machining the zirconia blocks: the soft machining of pre-sintered or partial sintered blocks and the "hard machining of fully sintered blocks". The "soft machining" method is one of the common ways to machining 3Y-TZP blocks in dentistry. This method relies on the milling of pre-sintered or partially sintered blocks followed by subsequent full sintering at a final stage. The hard machining (milling) refers to milling the restorations or the framework directly to the required dimensions from sintered high density, strength and homogenous zirconia blanks in which they have been hot isostatic pressed as shown in the Table 1 [4].
Table 1. Comparison between soft and hard machining
|
Soft Machining |
Hard Machining |
|
Pre-sintered blanks, at the so-called "green state", are used (compacting, cold isostatic pressing). |
Fully-sintered Y-TZP blocks are used (presintering & hot isostatic pressing HIP). |
|
A CAM milling of a framework with enlarged dimension |
High hardness and low machinability |
|
The sintering of the framework is completed at temperature (shrinkage 25%) high. |
Needs an extended milling period compared to the soft-milling process as well as demands the rigidity of the cutting instruments. |
Ceramics are typically used as restorative materials, and Yttria Partially stabilized Tetragonal Zirconia (Y-TZP), which has advantageous optical and mechanical qualities, is the most frequently used ceramic material in dentistry for the fabrication of substructures [1].
Liu and Yang using a single factor experiment, it was determined if altering four milling process parameters would affect "surface roughness" during high rotational speed finish milling 900℃ "pre-sintering zirconia". It was suggested to compare the impact’s strength and to improve the milling parameters' domains using process sensitivity and relative sensitivity, respectively. The creation of roughness models for each parameter reveals that spindle speed, feed engagement, cutting breadth, and cutting depth all have an impact, with spindle speed having a significant impact on each. Based on relative sensitivity, milling parameter stability domain and instability domain are supplied [5].
Lan et al. [6] investigated the milling properties of several Y-TZP block materials using a dental CNC milling centre. The milling characteristics of low temperature sintering zirconia blocks denoted by KMUZ were investigated in two commercial zirconia blocks for the T block manufactured in Taiwan and a G block made in Germany. Scanning and transmission electron microscopy were utilized, and X-ray diffraction was used to ascertain the composition of the crystalline phases. According to XRD, t-ZrO2 (KMUZ: 7.4%, G: 5.9%, T: 3.2%) changes into m-ZrO2 when subjected to milling pressure in ZrO2 blocks. It was discovered by studying the TEM microstructure of KMUZ that Y and Si are soluble in grain borders. The findings demonstrate that KMUZ's milling characteristics were superior than one commercial T and equivalent to the G. The Y3+content in the grain borders, which inhibits grain development, has an impact on 3Y-TZP aberrant grain growth as well [6, 7].
According to Abed and Bassim [8], the bridges were made of three different kinds of yttria stabilized tetragonal zirconia polycrystal (Kerox dental block, dental direct block, and Vita YZ HT block), and the crowns were solely made of these materials. Additionally, the impact of cutting speed on surface roughness, "mechanical properties" such as "flexural strength", and "microhardness" was examined. Mechanical testing revealed that when cutting speed increased, the flexural and hardness characteristics decreased. Surface characteristics testing showed that surface roughness reduces with increasing cutting speed. Under a scanning electron microscope, the fracture surface morphology revealed plastic deformation, microchips, arrest lines, hackles, twist hackles, and wake hackles. These shortcomings relate to how fractures propagate. The resistance of fracture caused by high cutting speed was lower than that caused by low cutting speed, per the results of the fracture resistance for crown. Finally, it was demonstrated that increasing rotational speed also increased tool life [9].
Abed and Bassim [8], using computer-aided design and production procedures, it was determined how the rotational speed of the tool affected the mechanical and surface morphology of crowns formed of various brands of "Y-TZP". According to the SEM results of the surface morphology for each brand, the machining of the surface resulted in cracks, microchips, and pores in addition to milling traces and scratches caused by the milling tool. The fracture surface morphology as seen by SEM demonstrated the existence of plastic deformation, microchips, twist hackles, and flaws that indicate the crack propagation direction. The fracture force at high cutting speed is demonstrated by the fracture resistance data for crown. Compared to low cutting speed, cutting speed was decreased. It was found that as cutting speed increased, bur life increased as well [9].
Abed [10], dental direct-presintered blocks with disk-shaped cutters were used on a computer numerical control (CNC) machine to prepare the specimens at different rotational speeds (10000, 20000, and 40000 rpm). The specimens were loaded using balls into a universal testing device and put through a uniaxial flexure test until they broke. The rotation speed had an effect on the examined zirconia's flexural strength, microstructure, crystal phase, and grain size. The materials were characterized using field emission scanning electron microscopy (FESEM) and X-ray diffraction (XRD) analyses. All rotational speeds had a tetragonal phase, according to the XRD study results. The variations in morphology and grain size are caused by variations in rotational speed, and grain size increases by around 36% as rotational speed is increased. While hardness exhibited minimal fluctuation with increasing rotational speed (decreasing 10%), flexural strength performed best at low speeds [10].
The aims of this paper are study effect of temperature generated during CNC milling process on phases transformation, cutting conditions on mechanical properties (bending strength, fracture toughness and microhardness), microstructural properties of zirconia using and analyse the surface roughness of zirconia samples due to use different depth of cut during machining by CNC milling machine.
2.1 Material
Common zirconia blocks employed for CAD/CAM system are accessible presintered. In this work using one type of presintered zirconia (Aconia HT+ made in China, Chengdu Besmile Biotechnology Co., Ltd.). The product is mainly composed of zirconia (containing hafnium oxide, yttrium oxide) (ZrO2+HfO2+Y₂O): >99%; yttrium oxide (Y₂O): 4.5%-10.0%; hafnium oxide (HfO2): ≤5%; alumina (Al, O,): ≤0.5%; other oxides: ≤0.5%, having a density>3 (g/cm3) and sintered density>6.02 (g/cm3).
2.2 Methods
2.2.1 Computer numerical control machine
A computer numerical control machine model CNC-SC that was made in Korea is housed in the materials engineering department's labs at the University of Kufa's College of Engineering, as shown in the Figure 1. CNC machine specifications include a maximum rotation speed of (12,000 rpm), spindle power (150 w), maximum feed rate of (10,000 mm/min), and table size of (270×310 mm2).
Figure 1. Computer numerical control (CNC) machine
2.2.2 Preparation of mould
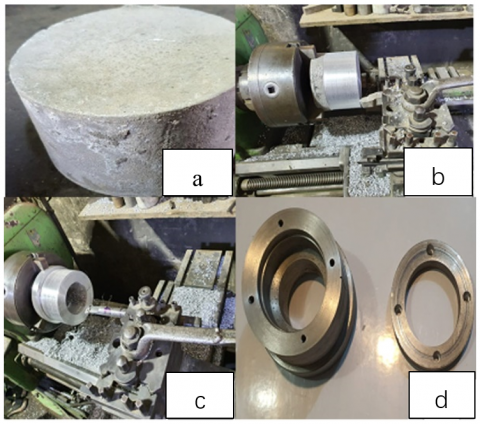
The mould designing by Auto CAD program is shown in the Figure 2. The mould was made of aluminium with sand casting. The mould has been turned on a lathe to take the desired final shape (din=9.8 cm and thickness=8 mm). The purpose of the mould is to fix the zirconia block on the CNC machine.
Figure 2. The steps of manufacturing the mould: (a) Sand casting the mould; (b) Turning out side diameter; (c) Turning in side diameter; (d) Final shape of the mould
2.2.3 Preparation of samples
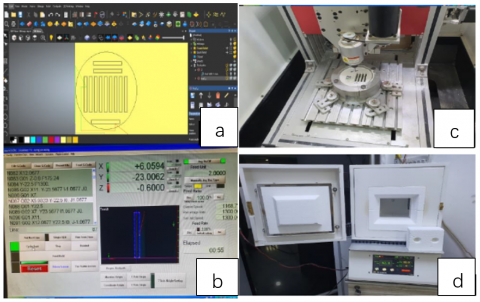
Figure 3(a)-(d) shows steps preparation of samples as shown in the following:
Figure 3. Preparation of samples: (a) Designing the samples by visual mail programs (CAD) according to ASTM C1161-13; (b) Setting the variables; (c) Milling the samples by CAD/CAM CNC machine; (d) Zirkonofen 600 furnace, Zirkon Zahn company
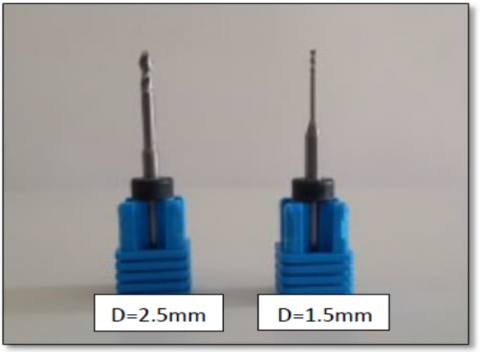
Figure 4. Schematic of tungsten carbide tools
Figure 5. The heating rate and cooling rate for fully sintering of Aconia zirconia block
(1) Design the samples by visual mail programs (CAD) according to ASTM C1161-13.
(2) Set the variables. Machining of samples is performed by using three cutting conditions: depth of cut (0.1, 0.3 and 0.5 mm), spindle speed (6000, 9000 and 12000 rpm) and diameter of bur (1.5 and 2.5 mm) as shown in Figure 4, bure made form carbide material, shank diameter (3 mm), overall length (48 mm) and end type (centre cutting).
(3) Mill the samples by CAD/CAM CNC machine.
(4) Machine samples.
(5) Fully sinter the samples at 1500℃ for 2 h at 8 ℃/min as shown in Figure 5. The full sintering treatment was accomplished in (ZIRKONOFEN 600 furnace, Zirkon Zahn company) at Babylon Lab., AL- Najaf city as shown in Figure 3(d).
2.3 Characterization of samples
2.3.1 Temperature measurement
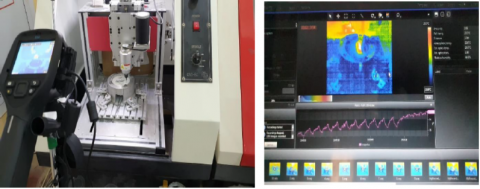
During operation, the maximum temperature was measured by using a thermal camera as the temperature has an effect on the bur and also has an effect on the phases of zirconia. Thermal camera has been conducted at Materials Engineering Department, college of Engineering, University of Kufa, as shown in Figure 6.
Figure 6. The computer numerical control machine with attached camera
2.3.2 X-Ray diffraction (XRD)
The "Aeris" is a XRD device name, made in the Netherlands, is used to collect "X-ray patterns", identify the crystalline phases present in the zirconia presintered parts, and determine the sinter pattern for the subsequent machining operations. This examination was carried out in the Al-Khora laboratory, housed in Baghdad.
2.3.3 Scanning electron microscopy of zirconia (SEM)
Following mechanical tests that were seen by SEM, using SEM (Axia ChemiSEM, made in the Netherlands), the microstructure, the morphology of the samples. The test was completed at the Al-Khora laboratory, housed in Baghdad. A sputter coating device was used to apply gold to the designs.
2.3.4 Surface roughness
The surface roughness of samples has been conducted at Materials Engineering Department, College of Engineering, University of Kufa. The average surface roughness (Ra) of samples was measured. The mechanical profiler (RT-200) was utilized to measurement surface coarseness at the micro level. When measuring the surface coarseness, the sensor is placed at first glance on the surface and then slips down along the surface by pushing the component into the analyser. The sensor obtains the coarseness of the surface through a sharp probe.
2.4 Mechanical tests
Many of tests were carried out on samples of zirconia after machining by CAD/CAM and sintering to compute mechanical properties such as flexural strength test and microhardness test.
2.4.1 Bending strength of Zirconia
The three-point bending experiment were done in a mechanical testing machine with the loading speed 0.5mm/min. In the prosthesis test, 4.5 mm steel bearing diameters, set on a jut, was utilized to lift the contact surface. The load was applied centrally at the centre of the pontic focus.
The bending strength (σfs) was computed utilizing the Eq. (1):
$\sigma f_S=3 F I / 2 B H^2$ (1)
where, F is the maximum load or force which is applied to the centre of the Specimen to fracture (N); I is the distance between the two rests on the surface under the tensile force (mm). B is the width (mm). H is the height of the specimen between the surface under the tensile and compressive forces (mm) The width and height of specimen were 4 and 3 mm respectively. The distance between support points was 40mm and the span length was 45mm. The test was performed using the microcomputer controlled electronic universal testing machine (WDW-100E, China made) at the Materials Engineering Department/Faculty of Engineering/University of Kufa.
2.4.2 Micro hardness
Vickers hardness values were measured on samples after machining by CAD/CAM and sintering, using a Vickers hardness diamond indenter (TH-714Digital Micro Vickers hardness tester) at the Materials Engineering Department/Faculty of Engineering/University of Kufa. 9.8N load was used and the time of holding was 30 sec. The average of 4 measurements was taken as an average value of HV bridge restoration samples.
The equation from which the Vickers hardness is derived from the Eq. (2) [10].
$H V=1.8544 p / d^2$ (2)
where, HV=Vickers hardness in N·mm-2 P=the applied load in N. d = the average value of the two diagonals in mm the indenter in the shape of a right-angle pyramid with a square base and an angle (α) between opposite faces of 136°.
2.4.3 Test the fracture toughness
Fracture toughness of TZP was optioned by using Vickers indentation fracture test (VIF). The VIF method is one of the most untraditional methods to measure fracture toughness and consider a non-destructive test. Vickers indentation and the cracks optioned. First of all, the specimens were grinded up to 2000 μm with SiC grinding paper then polished with 5μm Al2O3 slurry. After that, the Vickers hardness test was carried out with 5 kgf load and 20 sec holding time by using the Vickers hardness tester (Kason thus-187.5 digital hardness tester, China) at Department of Ceramics and Building Materials, Faculty of Materials Engineering, University of Babylon.
Then the diagonals and the cracks were measured by using optical microscope (mv6000-nmm-8-200000, China) and Image J software according to Appendix C with 5 indentions to every specimen. Finally, the fracture toughness was calculated according to Anstis et al. [11].
$K_{I C}=0.016 \times \frac{F}{C^{3 / 2}} \times\left(\frac{E}{H V}\right)^{1 / 2}$ (3)
$H V=1.8544 p / d^2$ (4)
where, KIC=fracture toughness in MPa·m1/2; HV=Vickers hardness in N·mm-2; P=F=The applied load in N; E=Young's modulus in MPa; d=the average value of the two diagonals in mm; c=crack length from the centre of the impression to the crack tip in mm.
3.1 Characterization of zirconia samples
3.1.1 Effect cutting speed on surface temperature
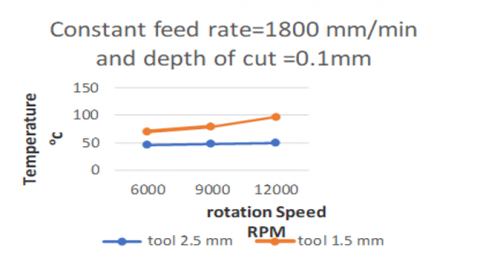
Figure 7 shows relationship between temperature at interface of Aconia zirconia samples and cutting speed at constant feed rate=1800 mm/s and depth of cut=0.1 mm. It can be seen an increasing in temperature at interface for tool and surface of the samples with the increase in cutting speed, as well as the noticed the effect of the diameter of the cutting tool on the temperature, at a diameter of 1.5 mm, increasing the speed led to a greater increase in temperature than at diameter of 2.5 mm in most cases of rotational speed, whereas heat loss is roughly proportional to surface area. That means: when double or increase the surface area of the cutting tool will the heat loss become double [12], when the increasing the rotational speed from 6000 up to 12000 rpm with using tool diameter 1.5mm, the temperature will change from 70.17℃ up to 96.9℃) and when compared to tool diameter 2.5 mm, the temperature change from 44.99℃ up to 48.65℃). This temperature increase was within the permissible limit that does not affect the phase change of zirconia because any change that can be obtained takes place must be at a temperature of 1170℃ [13].
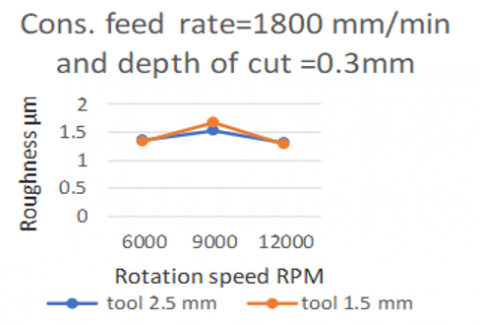
Figure 8 shows relationship between temperature at interface of Aconia zirconia samples and cutting speed at constant feed rate=1800 mm/min and depth of cut=0.3 mm. It can be seen an increasing in temperature at interface between cutting tool and surface of the samples with the increase in cutting speed, as well as the noticed the effect of the diameter of the cutting tool on the temperature, at a diameter of 1.5 mm, increasing the speed led to a greater increase in temperature than at diameter of 2.5 mm most cases of rotational speed, heat loss is roughly proportional to surface area. That means: when increase the surface area of the cutting tool will the heat loss become more [12], where the increasing the rotational speed from 6000 up to 12000 rpm with using tool diameter 1.5 mm, the temperature change from 87.24℃ up to 97.6℃ and when compared to tool diameter 2.5 mm, the temperature change from 39.39℃ up to 48.15℃. This temperature increase was within the permissible limit that does not affect the phase change of zirconia because any change that can be obtained takes place must be at a temperature of 1170℃ [13].
Figure 7. Relationship between temperature at interface of Aconia zirconia samples and rotation speed at constant feed rate=1800 mm/min and depth of cut=0.1 mm
Figure 8. Relationship between temperature at interface of Aconia zirconia samples and rotation speed at constant feed rate=1800 mm/min and depth of cut=0.3 mm
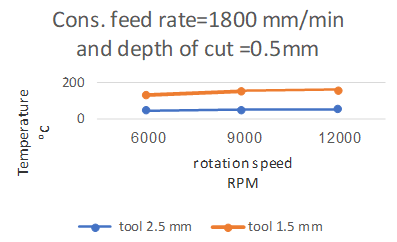
Figure 9 shows relationship between temperature at interface of Aconia zirconia samples and cutting speed at constant feed rate=1800 mm/min and depth of cut=0.5 mm. the temperature change from 128.41℃ up to 158.8℃. When compared to tool diameter 2.5 mm, the temperature change from 47.23℃ up to 50.37℃. The results obtained at a cutting depth of 0.5 mm. The maximum temperature rise occurred at a tool diameter of 1.5 mm compared to other cutting depths (0.1 and 0.3 mm), where the temperature increase between cutting depth of 0.1 mm and depth of 0.5 mm was 62%. Despite the increase in temperature, this increase does not affect the phase change of the zirconia [10]. Through the previous figures, temperature generated from cutting increases with the increase of cutting speed at higher depth of cut [11, 12]. It can be said that increasing the temperature at a diameter of 1.5, 2.5 mm at different speeds 6000, 9000, 12000 and different cutting depths (0.1, 0.3 and 0.5 mm) does not affect the phase change of the zirconia samples because any change that can be obtained takes place must be at a temperature of 1170℃ [13].
Figure 9. Relationship between temperature at interface of Aconia zirconia samples and rotational speed at constant feed rate=1800 mm/min and depth of cut=0.5 mm
3.1.2 Surface roughness
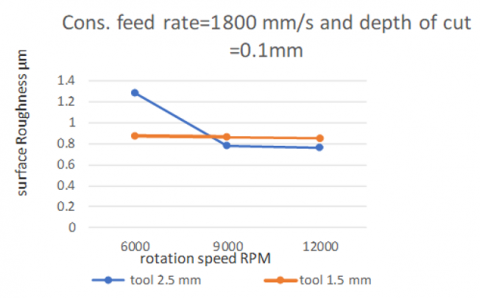
Figure 10 shows relationship between surface roughness of Aconia zirconia samples and rotation speed at constant feed rate=1800 mm/min and depth of cut=0.1 mm. The best value of surface roughness that can be observed in this diagram is that which occurs at a speed of 12000 and the diameter of the cutting tool is 2.5 mm, and the amount mean and deviation of surface roughness is 0.76 micrometres and 0.35 respectively.
Figure 11 relationship between surface roughness and rotational speed at constant feed rate=1800 mm/s and depth of cut=0.3 mm, that the best value of surface roughness obtained at a cutting depth of 0.3 mm was at a rotation speed of 12000 rpm and the diameter of the cutting tool was 1.5 mm, and the amount mean and deviation of surface roughness was 1.28 micrometres and 0.026 respectively.
Figure 12 shows the relationship between surface roughness and rotational speed at constant feed rate=1800 mm/min and depth of cut=0. 5 mm. The results show that the mean surface roughness value at its best value was at a speed of 12000 rpm and the diameter of the cutting tool was 2.5 mm, 1.14 µm, and the deviation of surface roughness is 0.08.
Figure 10. Relation between surface roughness and rotational speed at constant feed rate=1800 mm/min and depth of cut=0.1 mm
Figure 11. Relation between surface roughness and rotational speed at constant feed rate =1800 mm/min and depth of cut =0.3 mm
Figure 12. Relation between surface roughness and rotational speed at constant feed rate=1800 mm/min and depth of cut=0.5 mm
Through the results obtained in Figures 10-12, it can be said that the best values for surface roughness were reached at a rotational speed of 12000 rpm, a cutting depth of 0.1 mm, and a cutting tool diameter of 2.5 mm.
In Figures 13-15, at 9000 rpm the roughness start increases and decrease at 12000 rpm. This phenomenon is essentially due to the risk of pullout that is more important at a low cutting speed. In fact, rubble clumps on the machined surface led to an important variation of the R value at a low cutting speed. This rubble clump is not evacuated by the rotation of the tool, and therefore it agglomerates on the green compact causing a degradation of the surface state which can directly impact the mechanical properties of the ceramic part [14].
3.2 Mechanical properties
3.2.1 Bending strength of Zirconia
Figure 13 shows relationship between bending strength and rotational speed of zirconia samples machined by CAD/CAM, the results that have been reached, at depth of cut 0.1, 0.3 and 0.5 mm with increasing rotation speed from 6000 to 9000 rpm, the bending resistance decreases from 333.33, 416.67 and 333.33 MPa to 332, 316.67 and 300 MPa respectively. At rotational speed 12000 rpm, the bending resistance increase up to 460 and 433.33 MPa respectively at the cutting depth 0.3 and 0.5 mm and the bending resistance decrease to 233.33 MPa at depth of cut 0.1 mm. The reason for this is that increasing the cutting depth leads to a decrease in the hardness. Increasing the depth of cut results leads to an increase in deformations within the crystal lattice, which leads to an increase in the generation of internal stresses within the crystal lattice of the zirconia span, the increase in the stresses generated within the crystal lattice leads to an increase in the hardness of the material [15].
Figure 13. Relationship between bending strength and rotational speed of zirconia samples machined by CAD/CAM
3.2.2 Micro hardness
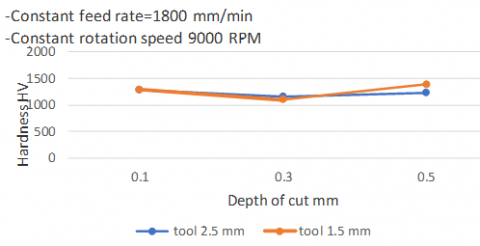
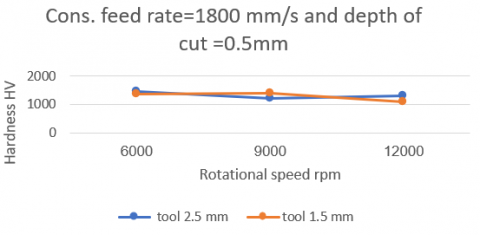
Figure 14 shows the relationship between hardness and depth of cut (0.1, 0.3 and 0.5) at constant feed and rotational speed rate1800 mm/min, 6000 rpm respectively of zirconia samples machined by CAD/CAM. At depth of cut (0.1, 0.3 and 0.5), the hardness values with are lower at a cutting depth of 0.3 mm and then the results show a slight increase in the hardness values at a cutting depth of 0.5 mm for the sample milled by the tool whose diameter is 2.5 mm. The highest mean hardness value was 1458.73 HV at tool diameter 2.5 mm, depth 0.5 mm, speed 6000, and the standard deviation is 8.87.
Figure 14. Relationship between hardness and depth of cut of zirconia samples machined by CAD/CAM at cutting speed (a) 6000 rpm; (b) 9000 rpm
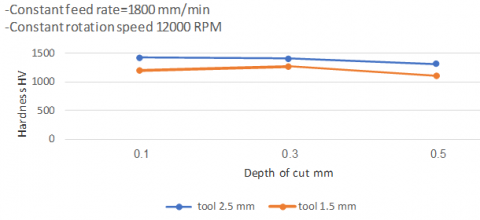
The highest mean hardness value was 1387.72 HV at tool diameter 1.5 mm, depth 0.5 mm, speed 9000 rpm, and the standard deviation is 45.11.
The results show in Figure 15 that the largest mean hardness values 1420.4 HV and the standard deviation is 40.11 obtained at feed rate 1800 mm/min and cutting speed 12000 rpm were at a cutting depth of 0.1 mm for a cutting tool with a diameter of 2.5 mm.
Figure 15. Relationship between hardness and depth of cut at cutting speed 12000 rpm
From the results obtained in Figures 13-15, the hardness values increase with the increase in the cutting depth, and for the cutting tool with a diameter of 1.5 mm, the increase is greater than for the tool with a diameter of 2.5 mm because of material deformation and residual stresses induced.
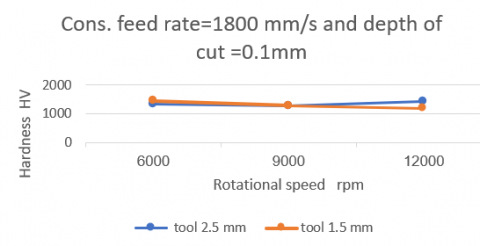
Figure 16 shows relationship between hardness and cutting speed at depth of cut 0.1 mm. That the largest mean hardness values 1457 HV and the standard deviation is 8.8 obtained when the feed rate was 1800 mm/min and the cutting depth was 0.1 mm and the cutting speed was 6000 rpm for the sample milled by tool 1.5 mm, while that the largest mean hardness values 1340.23 HV and the standard deviation of 60.48 were obtained when the feed rate was 1800 mm/min and the cutting depth was 0.1 mm, and the cutting speed was 12000 rpm for the sample milled by tool 2.5 mm.
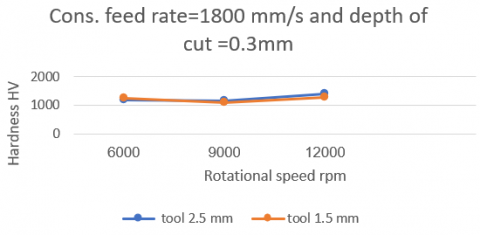
When increasing the depth of cut up to 0.3 mm, the results shown in Figure 17 increase the cutting speed for both the cutting tools. The highest mean hardness value was 1403.43 HV at tool diameter of 2.5 mm, depth of 0.3 mm, speed of 9000 rpm, and the standard deviation is 31.93.
Figure 16. Relationship between hardness and cutting speed at depth of cut 0.1 mm
Figure 17. Relationship between hardness and cutting speed at depth of cut 0.3 mm
By increasing the cutting depth up to 0.5 mm and by increasing the cutting speed, the hardness values decreased for both cutting tools, as in Figure 18, where the largest hardness values appeared at the cutting speed of 6000 and the lowest hardness values at the speed of 12000 rpm. The highest mean hardness value was 1458.73 HV at tool diameter of 1.5 mm, depth of 0.5 mm, speed of 9000 rpm, and the standard deviation is 95.17.
It is observed from above figures that, as the cutting speed increases, the surface hardness decreases. Most likely, it is due to the increase in temperature during machining, as the increase in cutting speed generates heat, which eventually makes the material surface soften. Also, an increase in depth of cut produces increased cutting temperature, which, in turn, decreases the hardness of machined surface. For the case of higher depth of cut together with higher cutting speed, the surface hardness is found to increase, which indicates that the surface materials experience severe strain hardening induced by plastic deformation during machining [16].
Figure 18. Relationship between hardness and cutting speed at depth of cut 0.5 mm
3.2.3 Test the fracture toughness
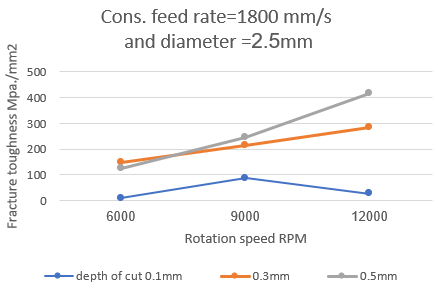
Figure 19 shows the fracture toughness according to the difference in cutting depth and cutting speed. Through the figure, it is clear to us that the fracture toughness increases with the increase in the cutting speed and the depth of the cut, where we find the highest fracture toughness values of 414.94 MPa/mm2 were at a rotation speed of 12000 rpm and a cutting depth of 0.5 mm compared to the lowest fracture toughness values 9.6 MPa/mm2 at the cutting depth is 0.1 and the cutting speed is 6000 rpm.
Figure 20 shows relationship between fracture toughness and rotation speed when using a tool with a diameter of 2.5 mm with a difference in cutting depth 0.1, 0.3 and 0.5 mm, as the results show an increase in fracture toughness with an increase in rotation speed and an increase in cutting depth. The hardness decreases slower with increasing toughness, these results agreed with [17].
Figure 19. Relationship between fracture toughness and depth of cut
Figure 20. Relationship between fracture toughness and rotation speed
3.3 X-Ray diffraction (XRD)
The peak locations and their relative intensities for the ZrO2 phases were cited from the International Centre for Diffraction Data (ICDD) database. Figure 21 shows the X-ray diffraction pattern of the Yttria partially stabilized zirconia (Aconia YZ HT+block) samples after machining by CAD/CAM at rotational speed 6000 rpm and depth of cut 0.3 mm and then sintered to 1500℃ for 2 hours’ holding time with the heating rate of 8 ℃/min.
Figure 21. X-Ray diffraction pattern obtained from yttria stabilized zirconia blank (Aconia HT+) after machining by CAD/CAM at rotational speed 6000 rpm, depth of cut 0.3 mm and sintering at 1500℃
It can be notice from above figure only tetragonal phase (T) of ZrO2 was identified for all of the samples. In addition, it was noticed that the rotation speed was not affecting the transformation of monoclinic phase to tetragonal phase. But when sintering to high temperatures, the monoclinic phase transformation to tetragonal (T) phase, this result agreed with Shaik E H when he studied XRD patterns of the ceramic sintered at various temperatures. The XRD pattern for the sample sintered at 1250℃ and above shows a fully stabilized tetragonal structure [18]. The computer aided design and manufacturing does not lead to phase transformations but sintering processes after milled process transformation monoclinic to tetragonal phase [19]. Moreover, the complete transformation from the monoclinic phase to the tetragonal phase after the sintering process is expected due to the sufficient high temperature during the sintering that caused this transformation [20]. The results of the XRD test for the zirconia surface, after the sintering process, show the presence of a quadrangular phase on all parts of the surface. Through these results, we can conclude the improvement in the mechanical properties (bending, fracture resistance, and hardness). This is due to the quadrangular phase from which this phase is formed. Which generates internal stresses concentrated on the surface, and these stresses improve the mechanical properties [21].
3.4 Scanning electron microscopy of Zirconia (SEM)
Scanning electron microscope (SEM) was used to determine the morphology of the zirconia block from two different rotational speeds and two depths of cut. Figure 22 shows the surface morphology at a different magnification power for Aconia block after milling at the rotation speeds 6000 rpm and cutting depth 0.1 mm, and then sintering. Figure 22(a) reveals scratching induced by the edge tool and machining groove related to plastic deformation. Figure 22(b) shows the surface details at a higher magnification in which visible surface defects such as pores and microcracks were observed. Figure 22(c) shows the main points of the grain coarsening.
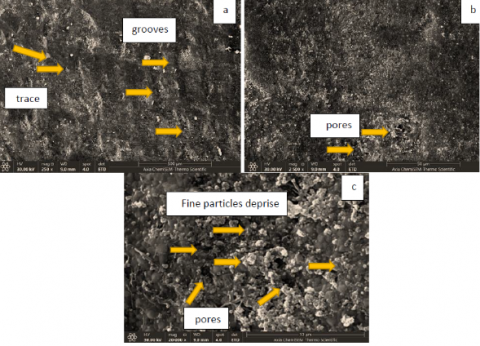
Figure 23 shows the surface morphology at a different magnification power for Aconia block after milling at the rotational speeds 6000 rpm and cutting depth 0.5 mm, and then sintering. Figure 23(a) reveals scratching produced by the milling tool and milling traces appeared on the surface machining. Figure 23(b) reveals pores that appeared due to the densification process on the surface machining. Figure 23(c) shows the microchips located in the surface induced by ploughed milled of surface.
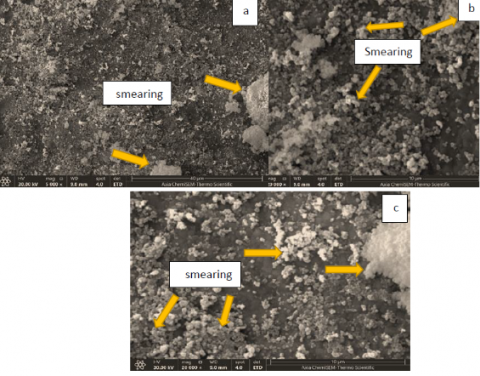
Figure 24 shows the surface morphology at a different magnification power for Aconia block after milling at the rotational speeds 12000 rpm and cutting depth 0.1 mm, and then sintering. Figure 24 (a)-(c) shows the detailed smearing of fine particles of zirconia.
Figure 25 shows the surface morphology at a different magnification power for Aconia block after milling at the rotational speeds 12000 rpm and cutting depth 0.5 mm, and then sintering. Figure 25(a) shows that the trace of milling surface and scratches due to milling tool. Figure 25(b) reveals pores that appeared due to the densification process on the surface machining. Figure 25(c) shows the detailed the smearing of fine particles of zirconia.
Figure 22. SEM images for machining Aconia HT+YZ block and sintering by used rotation speeds 6000RPM and cutting depth 0.1 mm
Figure 23. SEM images for machining Aconia HT+YZ block and sintering by used rotation speeds 6000 rpm and cutting depth 0.5 mm
Figure 24. SEM images for machining Aconia HT+YZ block and sintering by used rotation speeds 12000 rpm and cutting depth 0.1 mm
Figure 25. SEM images for machining Aconia HT+YZ block and sintering by used rotation speeds 12000 rpm and cutting depth 0.5 mm
1. The rotational speed has no effect on the transformation of monoclinic phase to tetragonal phase, but after sintering to high temperatures of 1500℃, the monoclinic phase is transformed to tetragonal (T) phase. The heat generated during the milling process not effect on zirconia phases.
2. The maximum hardness value 1458.73 HV was obtained at 6000 rpm, at a depth of 0.5 mm, also the lowest roughness value 0.76 µm was obtained at 9000 rpm, a depth of 0.1 mm and burs diameter 2.5 mm.
3. The surface roughness will be decreasing when the cutting speed is increased and cutting depth decrease.
4. The optimum mechanical properties of flexural strength 333.33 MPa, microhardness 1276.3 HV, and surface roughness 0.76 µm according to the results may be achieved by employing a 2.5 diameter cutting tool at rotational speeds of 9000 rpm and 0.1 mm, respectively.
5. SEM shows the surface morphology, scratching induced by the edge tool and machining groove related to plastic deformation and visible surface defects such as pores and micro cracks.
6. Investigating the effect of heat generated during the milling process on tool life at different machining parameters of rotational speed, feed, depth of cut and more focus should be given to these aspects by researchers.
|
D |
The rotational speed of the tool (rpm) |
|
Vc |
The cutting speed (m/min) |
|
Vf |
The feed rate (mm/min) |
|
Fz |
The feed per tooth (mm/tooth) |
|
N |
The spindle speed (rpm) |
|
Z |
The number of teeth |
|
D |
Particle size |
|
FWHM |
The X-ray beam's wavelength |
|
P |
The fracture load (N) |
|
b |
The thickness of the samples (mm) |
|
W |
The width of the samples (mm) |
|
L |
The distance between two centres (mm) |
|
Greek symbols |
|
|
λ |
The X-ray beam's wavelength |
|
θ |
The diffraction angle is a term used to describe the angle |
[1] Pittayachawan, P. (2009). Comparative study of physical properties of zirconia based dental ceramics. Ph.D. dissertation. University College London.
[2] Ji, Y., Zhang, X.D., Wang, X.C., Che, Z.C., Yu, X.M., Yang, H.Z. (2013). Zirconia bioceramics as all-ceramics crowns material: A review. Rev. Adv. Mater. Sci, 34(2): 72-78.
[3] Lin, C.K. (2014). Cutting effectiveness of diamond burs on dental zirconia. MS thesis. The University of Alabama at Birmingham.
[4] AL‐AMLEH, B., Lyons, K., Swain, M. (2010). Clinical trials in zirconia: A systematic review. Journal of Oral Rehabilitation, 37(8): 641-652. https://doi.org/10.1111/j.1365-2842.2010.02094.x
[5] Liu, J.W., Yang, X.J. (2014). Effect of milling parameters on surface roughness for high-speed milling of pre-sintering zirconia. Advanced Materials Research, 988: 253-256. https://doi.org/10.4028/www.scientific.net/AMR.988.253
[6] Lan, T.H., Wang, C.H., Chen, K.K., Wang, M.C., Lee, H.E. (2017). Milling properties of low temperature sintered zirconia blocks for dental use. Materials Science and Engineering: C, 73: 692-699. https://doi.org/10.1016/j.msec.2016.12.089
[7] Amat, N. F., Muchtar, A., Yew, H. Z., Amril, M. S., Muhamud, R. L. (2020). Machinability of a newly developed pre-sintered zirconia block for dental crown applications. Materials Letters, 261: 126996.
[8] Abed, I., Bassim, D. (2020). Effect bur velocity on fracture surface, roughness and morphology of zirconia crown and bridge by computer aided design and manufacturing (CAD/CAM). EasyChair Prepr, 7: 3564.
[9] Fraga, S., Amaral, M., Bottino, M.A., Valandro, L.F., Kleverlaan, C.J., May, L.G. (2017). Impact of machining on the flexural fatigue strength of glass and polycrystalline CAD/CAM ceramics. Dental Materials, 33(11): 1286-1297. https://doi.org/10.1016/j.dental.2017.07.019
[10] Abed, I.J. (2022). Effect of spindle speed on microstructure and flexural strength of dental direct bio zirconia. Revue des Composites et des Matériaux Avancés, 32(5): 237-242. https://doi.org/10.18280/rcma.320504
[11] Anstis, G.R., Chantikul, P., Lawn, B.R., Marshall, D.B. (1981). A critical evaluation of indentation techniques for measuring fracture toughness: I, direct crack measurements. Journal of the American Ceramic Society, 64(9): 533-538. https://doi.org/10.1111/j.1151-2916.1981.tb10320.x
[12] Lienhard, J.H. (2011). A Heat Transfer Textbook 5th Edition. University of Houston.
[13] Vagkopoulou, T., Koutayas, S.O., Koidis, P., Strub, J.R. (2009). Zirconia in dentistry: Part 1. Discovering the nature of an upcoming bioceramic. The European Journal of Esthetic Dentistry, 4(2): 130-151.
[14] Demarbaix, A., Ducobu, F., Preux, N., Petit, F., Rivière-Lorphèvre, E. (2020). Green ceramic machining: influence of the cutting speed and the binder percentage on the Y-TZP behavior. Journal of Manufacturing and Materials Processing, 4(2): 50. https://doi.org/10.3390/jmmp4020050
[15] Callister Jr, W.D. (2007). Materials Science and Engineering: An introduction 7th Edition. John Wiley & Sons, Inc.
[16] Wang, F., Zhao, J., Li, A., Zhang, H. (2014). Effects of cutting conditions on microhardness and microstructure in high-speed milling of H13 tool steel. The International Journal of Advanced Manufacturing Technology, 73: 137-146. https://doi.org/10.1007/s00170-014-5812-9
[17] Ranade, A.N., Krishna, L.R., Li, Z., Wang, J., Korach, C.S., Chung, Y.W. (2012). Relationship between hardness and fracture toughness in Ti–TiB2 nanocomposite coatings. Surface and Coatings Technology, 213: 26-32. https://doi.org/10.1016/j.surfcoat.2012.10.007
[18] Hoosain, S.E. (2010). The sintering and optimization of stabilized zirconia. Ph.D. dissertation. Faculty of Engineering and the Built Environment, University of Witwatersrand, Johannesburg.
[19] Arroyave, R., Kaufman, L., Eagar, T.W. (2002). Thermodynamic modeling of the Zr O system. Calphad, 26(1): 95-118. https://doi.org/10.1016/S0364-5916(02)00027-5
[20] Alao, A.R., Stoll, R., Song, X.F., Miyazaki, T., Hotta, Y., Shibata, Y., Yin, L. (2017). Surface quality of yttria-stabilized tetragonal zirconia polycrystal in CAD/CAM milling, sintering, polishing and sandblasting processes. Journal of the Mechanical Behavior of Biomedical Materials, 65: 102-116. https://doi.org/10.1016/j.jmbbm.2016.08.021
[21] Tong, H., Tanaka, C.B., Kaizer, M.R., Zhang, Y. (2016). Characterization of three commercial Y-TZP ceramics produced for their high-translucency, high-strength and high-surface area. Ceramics International, 42(1): 1077-1085. https://doi.org/10.1016/j.ceramint.2015.09.033