Fatima H. Malik![]() | Zainab J. Sweah
| Zainab J. Sweah![]() | Ahmed J. Mohammed
| Ahmed J. Mohammed![]() | Kahtan A. Mohammed*
| Kahtan A. Mohammed*![]() | Shubham Sharma
| Shubham Sharma![]()
© 2023 IIETA. This article is published by IIETA and is licensed under the CC BY 4.0 license (http://creativecommons.org/licenses/by/4.0/).
OPEN ACCESS
This investigation explores the impact of natural dye extract from the Lanata Kamra plant on the electrical conductivity of pentacene (PE) polymer thin films. Films of pure PE were spin-coated with a 1:1 dye ratio, and their characteristics were examined using X-ray diffraction. The results highlighted the presence of a dominant PE peak in the 22th-28th range, a grain size of 0.341 nm for the pure PE, and 0.491 nm for the dye-doped polymer. The uniformity of the membrane surfaces suggested a regular arrangement of polymer units. The morphology of the films was further investigated with Scanning Electron Microscopy (SEM) at 200 nm and 500 nm resolutions, revealing the formation of surface fractures due to polymer shrinkage during production. The SEM analysis also indicated strong inter-chain interactions during membrane formation, resulting in spherically shaped crystals. Electrical properties, including current-voltage characteristics, were assessed using a Keithley Series 2400 source meter, operating within a voltage range of 1-100 V and a temperature of 30℃. The results demonstrated an increase in electrical conductivity with increased dye doping. Optical properties were examined over a wavelength range of 300-780 nm, suggesting the potential applicability of this model to photosensitization processes.
pentacene (PE), lanata kamrae (LK), X-ray, electrical conductivity, optical properties, Keithley Series 2400
Because of its contribution to resolving environmental and human health issues, green renewable energy is becoming increasingly important. One of the topics that has contributed to global warming reduction is the use of natural dye extracted from plants for optoelectronics applications. Pollution of the environment, the role of semiconductors can also be stated. have properties such as low cost, ease of manufacture and light weight, which qualifies them to be used in many scientific applications, including sensors (chemical, temperature, pressure), light emitting diodes, transistors, rechargeable batteries and solar cells and electro chromic displays Science has also tended to doping polymers with several doping, including natural or synthetic dyes [1, 2]. Edible dyes and bio-polyelectrolytes are generally utilized in food manufacturing [3, 4]. The application of dyes Along with proteins, has found widespread use in biological research. Recently, inkjet printing has used dyes contained within polymer nanoparticles [5]. Polyelectrolyte membranes are also commonly employed for dye separation, by tinkering with polyelectrolyte-dye interactions [6]. In each of these instances, materials are created by investigating the molecular interactions of dyes and polyelectrolytes. Understanding these interactions is thus required before designing such materials. With the desired characteristics several research teams have attempted to investigate them. Case-by-case interactions for example, the effect of charge concentrations and molecular weight. The influence of dye structures on polymer interactions as [7]. The characteristics of dye-impregnated polymer films were investigated and enhanced [8]. Pentacene is a polycyclic aromatic hydrocarbon composed of five benzene rings connected linearly and conjugate, belongs to the acnes group; It is an organic semiconductor that is blue/black in hue, strength of the dye-doped pentacene films was investigated. The electrical characteristics of pentacene and its potential usage in transistors were studied [9, 10]. Doping also increased the conductivity properties of pentacene [11]. The purpose of this research is to create an electrical, optical material combination of dye and polymer and to improve their optical properties. We start by extracting valuable natural dye from Lanata Kamra flowers, which is later used as a filler in conjunction with pentacene. The natural's electrical and optical conductivity.
Dye-doped polymer was systematically characterized in both solution and powder forms. The findings presented in this paper should help to advance the development of applications that use organic/inorganic electronic and optoelectronic devices.
Flowers for this study were gathered from local gardens in Iraq. The petal layers were washed under running water first, to get rid of any dust particles. These petals were then dried at room temperature in the shade for seven to ten days before being ground with an electric grinder. Following this, we engulfed the powder in distilled water in a closed glass container. (2 g) crushed flower petals were dissolved in (200 ml) of distilled water and placed in a water bath for approximately 30 minutes of continuous immersion. The extracts were then filtered through 55 g/m2 medium speed filter paper with 0.33 mm diameter fish and allowed to cool completely. The extracted dye is stored in suitable glass containers at 4℃ for future experiments [12]. Pentacene was produced as a pure solution by dissolving (0.01 g in 10 ml) of chloroform. As well as to the solution of Pentacene doped with dye, the same weight of dye was added, 0.01 g+0.01 g in 10 ml of chloroform and placed in an airtight glass container and placed on the magnetic stirrer for 3 hours, then left for 24 hours to ensure complete dissolution, after which the solution was filtered and the molar ratio was calculated according to the following law [9]:
$M=\frac{W(g)}{W_m\left(\frac{g}{m l}\right)} \times \frac{1000}{v_{(m l)}}$ (1)
where, W and Wm stand for weight and molecular weight, respectively.
2.1 Prepare electrical sample
Following the cleaning process, glass bases were used. A wire with a diameter of 0.015 mm connected them to the plastic pieces. The high-purity aluminum electrodes were then fumigated. The wires were pulled after fumigation. As a result, we obtain models with equal areas of all electrodes and lengths of films, giving accurate measurement results. The prepared solutions were then poured with spin coating [13].
2.2 Prepare optical sample
We begin by cleaning the glass slides with distilled water and then leaving them for 15 minutes in a container containing pure acetone, after which they are washed with distilled water again and then left for 5 minutes at a temperature of 70℃ in a thermal oven, after which the clean bases are preserved in suitable containers, and finally the films for the intended materials are deposited. To investigate it, the glass slides are placed on the spin coating device's rotating base, and the material is poured onto the glass slide with a single-use medical syringe for a number of cycles (1000 revolutions per minute). The sample is then removed from the rotating base and placed on a (hot plate) for a period of time.
3.1 Synthetic results (X-ray)
To detect the crystal structure of the produced Sample, X-ray diffraction (XRD) was utilized as a basic method. X-ray diffraction has been used to examine the prepared samples of undoped and doped pentacene polymer Within the angle range: (2=20-400 with wavelength=0.15406 nm). Figures 1-2 displays a strong peak in the X-ray spectra, indicating that the membranes are polycrystalline. In general, adding the dye (PE) to the polymer enhanced the composition of the indoor unit as a rigid unit [14]. The grain size was also determined using Scherer's equation [15]. Table 1 displays the values of reflection angles, half-wave height averages, brown distances, and relative intensity.
Grain size was also determined using Scherer's equation:
$L=\frac{0.94 L}{\beta \cos \theta}$ (2)
(L): Indicates the granule size (ʎ) wavelength of the employed x-rays is 0.15406 nm. (β): the width of the summit's mid-height. (θ): angle of diffraction.
Figure 1. X-ray diffraction of pure polymer
Figure 2. X-ray diffraction of doping polymer (Dye-Pentacene)
Table 1. Values of reflection angles, half-wave height averages, brown distances, and relative intensity
|
Sample |
Pos. (degree) |
Grain Size (nm) |
FWHM (degree) |
D-spacing (nm) |
Rel. Int. (%) |
|
Pentacene |
28.668 |
0.3421 |
0.482 |
0.31113 |
100.00 |
|
Dye-Pentacene |
28.686 |
0.492 |
0.335 |
0.3109 |
100.00 |
3.2 Scanning electron microscopy (SEM)
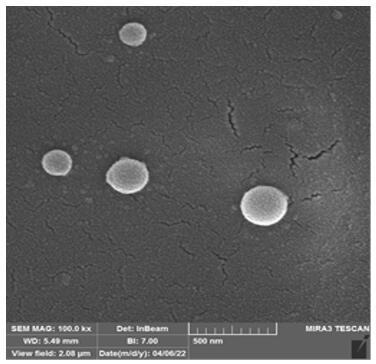
SEM images were used to characterize the shape of the membranes. Figures 3-4 displays images of the SEM in different modes at 200 nm and 500 nm, as it shows the creation of fractures on the surface of pentacene owing to polymer shrinkage during production, and it indicates the presence of strong contacts between polymer chains in the formation of films, the crystals have the shape of a ball [16].
(a)
(b)
Figure 3. SEM (200 nm) of (a): pentacene; (b): lantana camara-pentacene
(a)
(b)
Figure 4. SEM (500 nm) of (a): pentacene; (b): lantana camara- pentacene
3.3 Electrical properties
3.3.1 Current-voltage (I-V) characteristic
The characteristic current-voltage must be examined to explain the mechanism of conduction in polymeric films. The current-voltage characteristic has indeed been calculated. Using the Keithley Series 2400 source meter and operating within the voltage of 1-100 V and temperature of 30℃.
Figure 5 depicts the relationship between voltage and current for the pure polymer model (pentacene), demonstrating that current increases with increasing voltage and that this relationship is ohmic, which is the expected behavior as well as the same behavior when the polymer is impregnated with the dye Figure 6, explains why this growth occurred. In general, the electrical conductivity (σ) of polymers is determined by the concentration of free carrier concentration (n*) and the mobility of the carriers (µ), polymers must be doped to increase the number of charge carriers (n*), doping in polymers refers to polymer oxidation or reduction. When polymers are oxidized (i.e., an electron is removed from a double bond), a positive radical ion is produced on the polymer chain, and through this positive ion and the distortion around it, we get what is known as the positively charged bipolaron, which is unstable and quickly bonds with the negative ion in the impurity and is a P-doped polymer (That is, the observed change in conductivity is due to an increase in mobility and/or carrier density. Increased mobility of charge carriers (holes) between neighboring pentacene molecules may be facilitated by improved molecular stacking [17].
Figure 5. Current-voltage of pure pentacene
Figure 6. Current-voltage of lantan camra-pentacene
3.3.2 Electrical conductivity
Table 2. Electrical conductivity and activation energy of prepared samples
|
Sample |
σ (S/cm) |
Ea. (eV) |
|
Pentacene pure |
19.3*10-3 |
0.61 |
|
Dye-Pentacene |
3.8*10-2 |
0.42 |
Table 3. The absorption coefficient, refractive index, and optical energy gap values for wavelengths in the visible region
|
Wavelength |
Absorption Coefficient α *104 (cm-1) |
Refractive Index (n) |
Eg. (eV) |
|
500 |
0.014353025 |
1.021873549 |
3.05 |
|
600 |
3.232348305 |
1.376120385 |
3.052 |
|
700 |
0.009936709 |
1.021873547 |
3.07 |
Electrical conductivity was estimated using the following formula [13]:
$\sigma=\frac{I}{V} * \frac{A}{d}$ (3)
I: The current in the circuit is measured (Amper).
V: Denotes the circuit voltage (Volt).
A: The pole's data are calculated (cm).
d: Thickness of the film (cm).
The electrical conductivity values of pentacene and (dye-pentacene) polymer dye doped are shown in Tables 2-3.
3.3.3 Optical properties
The study of optical properties of materials is significant because it is the one that changes or influences the characteristics of the light passing through it by changing the direction of propagation or intensity. Their calculation on the wavelength or frequency allows them to know the absorbance a function of the wavelength. Figure 7 shows the absorbance curve as peak operating at wavelengths of 300-780 nm. This model can be applied to photosensitization processes [18].
Figure 7. Absorbance curve as a function of wavelength for the pentacene doping with the dye
3.3.4 Absorption coefficient
It is calculated from the following relationship as the ratio of the decrease in the energy flux of incident radiation with respect to the unit distance in the direction of wave propagation within the medium:
$\alpha=2.303(A / d)$ (4)
A: absorbance, d: thin film.
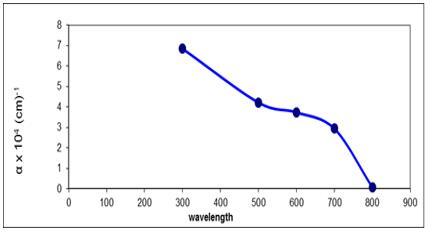
Figure 8 shows the curve of the absorption coefficient values of the dye mixture with the polymer, and it has direct transmission allowed according to the relationship $\alpha \geq 10^4$ [19].
Figure 8. Absorbance coefficient curve as a function of wavelength for the pentacene doping with the dye
3.3.5 Refractive index
It is the ratio of the speed of light in a vacuum (c) to the speed of light inside matter (v), as calculated from the equation:
$n=\frac{(1+R)}{(1-R)}+\sqrt{\frac{(4 \times R)}{(1-R)^2}-(K)^2}$ (5)
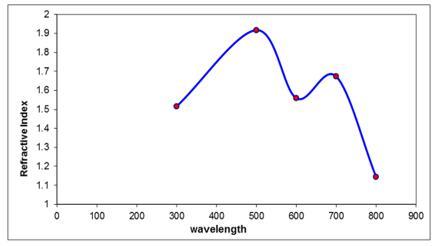
Figure 9 shows that the refractive index values are between 2 at 300 nm and then decrease with increasing wavelength [20].
Figure 9. Refractive index curve as a function of wavelength for the pentacene doping with the dye
3.3.6 Optical conductivity
It expresses the optical response of a medium primarily through the investigation of optical conductivity, which is determined by the relationship between conductance and absorption coefficient.
$\sigma_{\text {optical }}=\alpha n c \epsilon_0$ (6)
where, $\alpha$: absorption coefficient, n: relative index.
If C: velocity of light=3*108, $\epsilon_0$=8.85×10⁻¹² F/m.
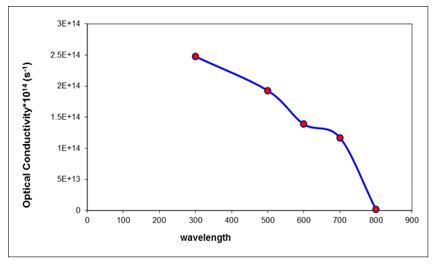
We can see from the Figure 10 that the optical conductivity values of the doped polymer films are in the visible spectrum. Within wavelengths 400-650 nm, it begins to decrease until it reaches close to zero at 800 nm.
Figure 10. Optical conductivity curve as a function of wavelength for the pentacene doping with the dye
A common thread across these applications is the profound significance of understanding the molecular interactions between dyes and polyelectrolytes. Researchers have strived to investigate these interactions extensively, considering factors such as charge concentrations, molecular weight, and dye structures. This comprehensive exploration has led to advancements in the properties of dye-impregnated polymer films, exemplified by our study's examination of pentacene, an organic semiconductor.
[1] De Boer, B., Facchetti, A. (2008). Semiconducting polymeric materials. Polymer Reviews, 48(3): 423-431. https://doi.org/10.1080/15583720802231718
[2] Tykwinski, R.R. (2019). Synthesis of unsymmetrical derivatives of pentacene for materials applications. Accounts of Chemical Research, 52(8): 2056-2069. https://doi.org/10.1021/acs.accounts.9b00216
[3] Heath, D.E., Cooper, S.L. (2012). Chapter I. 2.2 polymers: basic principles. In: Ratner, B., Hoffman, A., Schoen, F., Lemons, J. (eds) Biomaterials Science: An Introduction to Materials in Medicine. Academic Press.
[4] Zhang, H., Chan‐Park, M.B., Wang, M.F. (2020). Functional polymers and polymer-dye composites for food sensing. Macromolecular Rapid Communications, 41(21): 2000279. https://doi.org/10.1002/marc.202000279
[5] Li, J.J., Fan, J.L., Cao, R., Zhang, Z., Du, J.J., Peng, X.J. (2018). Encapsulated dye/polymer nanoparticles prepared via miniemulsion polymerization for inkjet printing. ACS Omega, 3(7): 7380-7387. https://doi.org/10.1021/acsomega.8b01151
[6] Oyarce, E., Butter, B., Santander, P., Sánchez, J. (2021). Polyelectrolytes applied to remove methylene blue and methyl orange dyes from water via polymer-enhanced ultrafiltration. Journal of Environmental Chemical Engineering, 9(6): 106297. https://doi.org/10.1016/j.jece.2021.106297
[7] Dragan, E.S., Dinu, I.A. (2009). Interaction of dis‐azo dyes with quaternized poly (dimethylaminoethyl methacrylate) as a function of the dye structure and polycation charge density. Journal of Applied Polymer Science, 112(2): 728-735. https://doi.org/10.1002/app.29474
[8] Vogelbacher, F., Zhou, X., Huang, J.H., Li, M.Z., Jiang, K.J., Song, Y.L., Unterrainer, K., Hainberger, R. (2019). Material gain concentration quenching in organic dye-doped polymer thin films. Optical Materials Express, 9(3): 1208-1222. https://doi.org/10.1364/OME.9.001208
[9] Alaridhee, T.A., Malk, F.H., Hussein, A.A., Abid, D.S. (2020). Enhanced absorption edge of anchusa-italica-doped pentacene towards optoelectronic applications. In Materials Science Forum, 1002: 251-263. https://doi.org/10.4028/www.scientific.net/MSF.1002.251
[10] Park, B. (2008). Electronic and structural properties of pentacene at organic/inorganic interfaces. The University of Wisconsin-Madison, Dissertation Abstracts International, 69(5): 3219.
[11] Enengl, C., Enengl, S., Havlicek, M., Stadler, P., Glowacki, E.D., Scharber, M.C., White, M., Hingerl, K., Ehrenfreund, E., Neugebauer, H., Sariciftci, N.S. (2015). The role of heteroatoms leading to hydrogen bonds in view of extended chemical stability of organic semiconductors. Advanced Functional Materials, 25(42): 6679-6688. https://doi.org/10.1002/adfm.201503241
[12] Malik, F.H., Hussein, A.A. (2019). Effect of different methods of extraction on optical properties for dye lantana camera. Journal of Kufa-Physics, 11(2): 73-78. https://doi.org/10.31257/2018/JKP/2019/110210
[13] Sweah, Z.J., Hameed Malik, F., Karem, A.A. (2021). Electrical properties of preparing biodegradable polymer blends of pva/starch doping with rhodamine-B. Baghdad Science Journal, 18(1): 97-101. https://doi.org/10.21123/bsj.2021.18.1.0097
[14] Werzer, O., Stadlober, B., Haase, A., Oehzelt, M., Resel, R. (2008). Full X-ray pattern analysis of vacuum deposited pentacene thin films. The European Physical Journal B, 66: 455-459. https://doi.org/10.1140/epjb/e2008-00452-x
[15] Chiu, M.Y., Jeng, U.S., Su, C.H., Liang, K.S., Wei, K.H. (2008). Simultaneous use of small‐and wide‐angle x‐ray techniques to analyze nanometerscale phase separation in polymer heterojunction solar cells. Advanced Materials, 20(13): 2573-2578. https://doi.org/10.1002/adma.200703097
[16] Lopez-Barbosa, N., Campaña, A.L., Cruz, J.C., Ornelas-Soto, N., Osma, J.F. (2020). Enhanced catalytic dye decolorization by microencapsulation of laccase from P. sanguineus CS43 in natural and synthetic polymers. Polymers, 12(6): 1353. https://doi.org/10.3390/polym12061353
[17] Osterbacka, R., An, C.P., Jiang, X.M., Vardeny, Z.V. (2000). Two-dimensional electronic excitations in self-assembled conjugated polymer nanocrystals. Science, 287(5454): 839-842. https://doi.org/10.1126/science.287.5454.839
[18] Agoosh, D.J., Malk, F.H., Muhsen, M.C. (2023). Influence of cellulose of cellulose film thickness on optical characteristics. International Journal of Applied Sciences and Technology, 5(2): 20-27. https://doi.org/10.47832/2717-8234.15.3
[19] Malek, F.H., Alaridhee, T., Hussein, A.A., AL-Saeed, A.H. (2021). Effects of static magnetic field on dye extracted from anchusa-italica through optimization the optoelectronic properties. International Journal of Nonlinear Analysis and Applications, 12(2): 949-960. https://doi.org/10.22075/ijnaa.2021.5158
[20] Alaridhee, T., Obeed, M.T., Malk, F.H., Dhahi, B.A. (2023). Optical characteristics of portulaca grandiflora-doped cellulose using the spray pyrolysis technique. Opto-Electronics Review, 31: 1-8. https://doi.org///doi.org/10.24425/opelre.2023.146553