Cynthia S. Abima* | Stephen A. Akinlabi | Nkosinathi Madushele | Esther T. Akinlabi
© 2021 IIETA. This article is published by IIETA and is licensed under the CC BY 4.0 license (http://creativecommons.org/licenses/by/4.0/).
OPEN ACCESS
Parameters optimization has become a gateway to achieving quality welds with improved properties desirable for construction and industrial applications. The complex interaction of welding input parameters requires process optimization to achieve optimal responses (s). This study reports the optimization of input parameters for Gas Metal Arc Welding (GMAW) for optimal ultimate tensile strength in AISI 1008 steel joints. Three levels of arc voltage, welding current, and gas flow rate were selected as input parameters, while the targeted output response is the ultimate tensile strength. Taguchi’s method with an L-9 orthogonal matrix was adopted for the process optimization. The MINITAB 17 software was used to analyze the response through analysis of variance and signal-to-noise ratio. The result revealed that the parameter settings for optimal tensile strength for the GMA welding of 6 mm thick AISI 1008 steel joint are arc voltage set at 30 V, current at 180 A, and gas flow rate set at 17 L/mm. The analysis of variance showed that the arc voltage had the most significant influence on the ultimate tensile strength with a 39.76% contribution, followed by the gas flow rate with 31.15%, while the welding current had 6.28% contributions. The surface plots show that a lower-level voltage, higher-level welding current, and higher-level gas flow rate favoured maximum ultimate tensile strength.
ANOVA, current, GMAW, gas flow rate, Taguchi, tensile strength, optimization, voltage
The construction and manufacturing industries continue to seek high strength and durable materials at relatively low costs. In this light, steel has become one of the best choice materials due to its high strength property [1, 2]. Of the various steel grades available, mild steel grades are frequently used in construction and manufacturing industries due to their lost cost, high strengths, good malleability, and high wear resistance properties suitable for numerous applications [3, 4]. Such applications include automobiles, the construction of ships, pipes, bridges, tanks, cars, and buildings. Thus far, the joining of mild steel and most metals is preferably done by employing the Gas Metal Arc Welding (GMAW) technique due to its potential to produce quality welds. Authors have reported numerous benefits of the GMAW process: low cost, high productivity, less weld distortion, and good joint strength [5, 6]. These attributes make the GMAW process the best choice in the automotive, energy, railway, pipeline, manufacturing and construction sectors [7, 8]. The GMAW process produces coalescence by maintaining an electric arc between the workpiece and a constantly feed consumable wire electrode [9]. The heat of welding transferred by the electric arc melts the wire electrode and the workpiece creating a molten pool that solidifies on cooling to produce a strong permanent joint [10, 11]. The molten pool is shielded from atmospheric contamination by externally supplied protective gases [10].
The GMAW process depends on numerous parameters, such as the welding speed, welding current, wire feed rate, arc voltage, the flow rate of protective gases, electrode extension, etc. The interaction of these input parameters creates a unique molten puddle and weld bead. The resultant weld bead geometry influences the final quality of the joints produced [11, 12]. The complex interactive effect of input parameters in the welding process makes obtaining a linear relationship between input parameters and the desired output parameters challenging. Consequently, proper selection of welding input parameters and optimization of input process parameters is crucial for improved weld quality and performance [6, 13, 14]. Process parameter optimization is vital to achieving desirable high-quality weld without increasing the production cost [15, 16].
Recently, manufacturing industries and researchers have adopted several optimization approaches to optimize output response(s). The methods adopted include Response Surface Methodology [2, 17-19], Grey Relational Analysis [20-24], Artificial Neural Network (ANN) and Genetic Algorithm [25-30], Particle Swarm optimization [31], Kriging model plus GA [32, 33] and the Taguchi method. The Taguchi method is widely used because it is simple, cost-effective, and efficient in solving problems in a single take [34], producing optimum results with only a few experimental runs [35]. Mishra et al. [14] adopted the Taguchi technique to optimize the MIG welding input parameters for 6 mm thick AISI 1020 steel for optimum weld penetration. The authors reported that the arc voltage had the most influence on the weld penetration, with 85.23% contribution following ANOVA statistics. Frango et al. [36] also adopted the Taguchi method to optimize input parameters for maximum tensile strength for MIG welded Eglin steel joints. The selected input parameters were the speed of welding, voltage, and current. Their result revealed that the welding current had more influence on the weld strength. Another author, Patil and Waghmare [37], also optimized the MIG process parameters for AISI 1030 steel to achieve maximum strength using the Taguchi method. Their result showed that the welding speed had the most influence on the joint strength having an 88.20% contribution, while the welding current had a 10.76% contribution and welding voltage with only 0.69% contribution.
Rizvi and Tewari [38] stated that the arc voltage majorly influenced the joint strength while the gas flow rate influenced the joint hardness. The effects of gas flow rate, current, and gas type on weld tensile strength of MIG welded IS2062 E-250 steel was investigated and reported by Swami et al. [39]. Their result showed that the gas flow rate had the most significant influence on tensile strength. Kumar and Jindal [35] also stated that the parameters combination that produces the maximum tensile strength obtained through signal-to-noise ratio is the voltage at 40 V, current at 220 A, and gas flow rate at 17 ipm. The welding voltage had the highest percentage contribution of 79.87% on the tensile strength, followed by the welding current with 13.33% and the gas flow rate with 5.78%, respectively. Similarly, Vikram Singh [40] optimized the welding parameters for GMA welding of AISI 1016 steel considering the rate of gas flow, the gap position, and the arc voltage for optimal tensile strength. The analysis of variance revealed that the gap position most influenced the joint strength with 67.05% contribution, followed by the rate of gas flow and the welding voltage with 15.31% and 10.65%, respectively. Parameters optimization for MIG welded AISI 1018 steel by the Taguchi method was also reported by Kumar and Singh [5]. The parameters selected for this work were the preheat temperature, arc voltage and welding current. The tensile properties of the joints were greatly influenced by the preheat temperature and least affected by the arc voltage. Increasing the preheat temperature led to a decrease in the percentage elongation and tensile strength. In contrast, current increase led to a corresponding increase in the percentage elongation and tensile strength of the joints.
Although, authors have optimized the input parameters for the GMAW process for improved weld strength, depth of penetration, and other properties. However, no study reports the optimization of the GMAW process parameters for AISI 1008 steel joints. Motived by lack of research on AISI 1008 mild steel, which has major usage in the construction industries and automotive applications, it becomes crucial to obtain the input parameters combination to maximizes the ultimate tensile strength of GMAW AISI 1008 steel joints. Thus, this study seeks to optimize the input parameters of GMA welding for maximum ultimate tensile strength in AISI 1008 joints. While this section presents a background to the study, section 2 presents the materials and methods used for the optimization and statistical analyzes. The results obtained from the analyzes, including surface plots showing the relationships between responses and input variables, are presented in section 3, and section 4 concludes the study.
2.1 Material description
The study investigates 6 mm thick AISI 1008 steel grade with elemental chemical composition as presented in Table 1. An ER 70S/6 carbon filler wire was used as the electrode wire. The chemical composition of the ER 70S/6 electrode wire is also presented in Table 2.
Table 1. Elemental chemical composition
|
Elements |
Composition by % weight |
|
Carbon |
0.072 |
|
Silicon |
0.068 |
|
Magnesium |
0.320 |
|
Potassium |
0.0098 |
|
Sulfur |
0.0091 |
|
Chromium |
0.042 |
|
Molybdenum |
0.005 |
|
Nickel |
0.0064 |
|
Aluminium |
0.042 |
|
Iron |
Bal |
Table 2. Elemental chemical composition of ER 70S/6 electrode wire
|
Elements |
Composition by % weight |
|
Carbon |
0.06-0.15 |
|
Nickel |
0.15 max |
|
Magnesium |
1.4-1.85 |
|
Chromium |
0.15max |
|
Silicon |
0.8-1.15 |
|
Sulfur |
0.035max |
|
Vanadium |
0.03max |
|
Molybdenum |
0.15max |
|
Copper |
0.5 |
Table 3. Input parameters and levels
|
Serial No |
Factors |
Level 1 |
Level 2 |
Level 3 |
|
1 |
Voltage (V) |
20 |
25 |
30 |
|
2 |
Current (A) |
200 |
250 |
280 |
|
3 |
Gas flow rate (L/mm) |
15 |
17 |
19 |
Table 4. Orthogonal matrix
|
Sample Run |
Input process parameters |
||
|
Voltage (MIG) |
Current (TIG) |
Gas flow rate (L/mm) |
|
|
1 |
20 |
200 |
15 |
|
2 |
20 |
250 |
17 |
|
3 |
20 |
280 |
19 |
|
4 |
25 |
200 |
17 |
|
5 |
25 |
250 |
19 |
|
6 |
25 |
280 |
15 |
|
7 |
30 |
200 |
19 |
|
8 |
30 |
250 |
15 |
|
9 |
30 |
280 |
17 |
2.2 Methods
The welds were produced using the 400 series, 400 Amps, DC XMT Miller GMAW machine. The arc voltage, gas flow rate, and current were the selected input parameters for this study. These parameters have been reported to have significantly influenced the properties of the GMAW process [35, 38] and have been chosen at three levels, respectively. The Taguchi method with an L-9 orthogonal matrix was adopted in this study. The response parameter considered is the ultimate tensile strength.
Table 3 presents the input parameters and their respective levels, while Table 4 shows the Taguchi L-9 orthogonal matrix.
3.1 Tensile test results
The weld quality was accessed by evaluating the ultimate tensile strength for each experimental run as presented in the orthogonal matrix. Three replicate samples for each weld run were tested. All test specimens tested under axial tensile loading failed at the weld zone. This fracture location indicated that welded joints were weaker than the unwelded parent material, which had an ultimate tensile strength of 405.9. The tensile results for all nine runs are presented in Table 5.
3.2 Signal-to-noise (S/N) ratio
The S/N ratio measures the desired signal against noise factors on the performance characteristics. A Higher S/N ratio depicts better response characteristics for the set of data. From Table 6, run L9 showed the highest S/N ratio from the data set.
Table 7 shows the optimum level for each factor and the ranking established by calculated delta statistics. The response table shows that voltage is the most significant factor.
The main effects plot for S/N ratio (Figure 1) shows that the optimum welding condition for maximum tensile strength is V3C3G2 which corresponds to the voltage of 30 V, current of 180 A, and gas flow rate 17 L/mm. This parameters combination corresponds to sample run H-L9 from the orthogonal matrix. Hence sample run H-L9 give the highest ultimate tensile strength.
Table 5. Tensile test results
|
Sample number |
Voltage (V) |
Current (A) |
Gas flow rate (L/mm) |
UTS (MPa) |
|
1 |
20 |
200 |
15 |
358.28 |
|
2 |
20 |
250 |
17 |
389.24 |
|
3 |
20 |
280 |
19 |
330.14 |
|
4 |
25 |
200 |
17 |
335.56 |
|
5 |
25 |
250 |
19 |
342.42 |
|
6 |
25 |
280 |
15 |
303.85 |
|
7 |
30 |
200 |
19 |
335.21 |
|
8 |
30 |
250 |
15 |
384.62 |
|
9 |
30 |
280 |
17 |
613.27 |
Table 6. The Signal-to-noise ratio for the output response
|
Sample number |
Voltage (V) |
Current (A) |
Gas flow rate(L/mm) |
UTS (Mpa) |
S/N Ratio |
|
|
1 |
20 |
200 |
15 |
358.28 |
51.0844 |
|
|
2 |
20 |
250 |
17 |
389.24 |
51.0844 |
|
|
3 |
20 |
280 |
19 |
330.14 |
50.3739 |
|
|
4 |
25 |
200 |
17 |
335.56 |
50.5154 |
|
|
5 |
25 |
250 |
19 |
342.42 |
50.6911 |
|
|
6 |
25 |
280 |
15 |
303.85 |
49.6532 |
|
|
7 |
30 |
200 |
19 |
335.21 |
50.5063 |
|
|
8 |
30 |
250 |
15 |
384.62 |
51.7007 |
|
|
9 |
30 |
280 |
17 |
613.27 |
55.7531 |
|
Table 7. Response table for S/N ratio
|
Levels |
Voltage (V) |
Current (A) |
Gas flow rate (L/mm) |
|
1 |
51.09 |
50.70 |
50.81 |
|
2 |
50.29 |
51.40 |
52.69 |
|
3 |
52.65 |
51.93 |
50.52 |
|
Delta |
2.37 |
1.22 |
2.17 |
|
Rank |
1 |
3 |
2 |
Figure 1. S/N ratio for Ultimate tensile strength
3.3 Analysis of variance (ANOVA)
ANOVA reveals that the arc voltage had the most significant influence on the ultimate tensile strength having a 39.76% contribution, closely followed by gas flow rate with 31.15%, and the welding current with 6.28% contribution. The ANOVA result is presented in Table 8.
3.4 Response surface plots
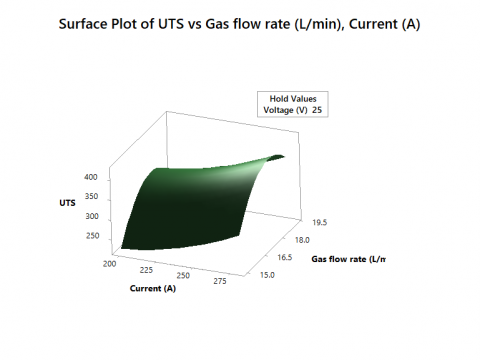
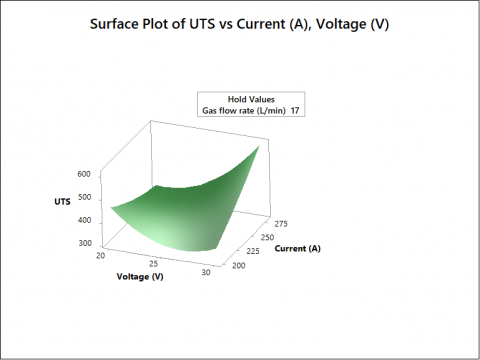
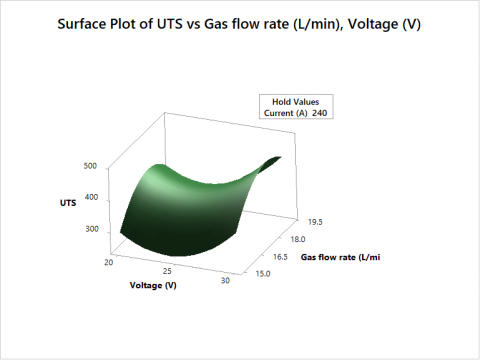
Response surface plots were used to visualize the effects of input process parameters on output response(s). It also shows the variation of the response with corresponding levels of the input parameters. The response surface plots in Figure 2(a-c) shows how the interaction of two factors influences the ultimate tensile strength. The third factor in each case is held constant. Figure 2(a) shows that the increase in the gas flow rate and the welding current resulted in a corresponding increase in the ultimate tensile strength of the joints. Figure 2(b) shows that a high value of ultimate tensile strength is obtained at a high current and low voltage. High current and low voltage favoured high ultimate tensile strength. Figure 2(c) shows that higher gas flow rate and voltage levels favoured maximum ultimate tensile strength.
Table 8. ANOVA for (UTS)
|
Source |
DF |
Seq SS |
Adj SS |
Adj MS |
% Contribution |
F-value |
P-value |
|
V |
2 |
9495 |
9495 |
4747.7 |
39.76 |
1.74 |
0.365 |
|
C |
2 |
1500 |
1500 |
750.2 |
6.28 |
0.28 |
0.784 |
|
G |
2 |
7440 |
7440 |
3720.2 |
31.15 |
1.37 |
0.423 |
|
Error |
2 |
5447 |
5447 |
2723.7 |
22.81 |
|
|
S=52.1889. R-sq=77.19%. R-sq(Adj)= 8.77%. Press= 110309. R-sq (Pred)0,00%. Where V = Voltage, C = Current, G = Gas flow rate
(a)
(b)
(c)
Figure 2. The response surface plots (a) Current vs Gas flow rate (b) Voltage vs Current (c) Voltage vs Gas flow rate
The process parameters optimization for GMA welding of 6 mm thick AISI 1008 mild steel joints for optimum tensile strength was investigated using the Taguchi method. The following conclusions were drawn from the investigation.
1. The input parameters combination for optimum tensile strength for GMA welding of AISI 1008 steel is seen to be V3C3G2 which corresponds to the voltage of 30 V, current of 180 A, and gas flow rate of 17 L/mm.
2. ANOVA shows that the voltage had the most significant influence on the tensile strength with a 39.76% contribution, closely followed by the gas flow rate with 31.15%. The welding current had the least influence on the tensile strength, having a contribution of 6.28%.
3. The surface plots show that a lower voltage, higher welding current, and higher gas flow rate favoured maximum ultimate tensile strength.
The authors acknowledged the University of Johannesburg for the financial support offered to publish this research.
[1] Habib, S.A., Meredith, C.S., Khan, A.S. (2021). Quasi-static and dynamic investigation of an advanced high strength and corrosion resistant 10% Cr nanocomposite martensitic steel. International Journal of Mechanical Sciences, 211: 106774. https://doi.org/10.1016/j.ijmecsci.2021.106774
[2] Chandra, M.S., Kumar, P.P., Asish, B., Ramesh, R. (2018). Determination of tungsten inert gas welding input parameters to attain maximum tensile strength of 316l austenitic stainless steel. Journal of Mechanical Engineering, 68(3): 231-248. https://doi.org/10.2478/scjme-2018-0037
[3] Ahmed, A.N., Noor, C.W.M., Falah, M., Ahmed, A. (2018). RBF-NN-based model for prediction of weld bead geometry in Shielded Metal Arc Welding (SMAW). Neural Computing and Applications, 29(3): 889-899. https://doi.org/10.1007/s00521-016-2496-0
[4] Abima, C.S., Akinlabi, S.A., Nkosinathi, M., Fatoba, O.S., Akinlabi, E.T. (2021). Experimental investigation of TIG-welded AISI 1008 carbon steel. In IOP Conference Series: Materials Science and Engineering, 1107: 012036. https://doi.org/10.1088/1757-899X/1107/1/012036
[5] Kumar, S., Singh, R. (2019). Optimization of process parameters of metal inert gas welding with preheating on AISI 1018 mild steel using grey based Taguchi method. Measurement, 148: 106924. https://doi.org/10.1016/j.measurement.2019.106924
[6] Abima, C.S., Akinlabi, S.A., Madushele, N., Fatoba, O.S., Akinlabi, E.T. (2021). Mechanical and microstructural properties of MIG welded aluminium alloy. In IOP Conf. Ser.: Mater. Sci. Eng., 1107: 012037. https://doi.org/10.1088/1757-899X/1107/1/012037
[7] Jogi, B.F., Awale, A.S., Nirantar, S.R., Bhusare, H.S. (2018). Metal inert gas (MIG) welding process optimization using teaching-learning based optimization (TLBO) algorithm. In Materials Today: Proceedings, 5: 7086-7095. https://doi.org/10.1016/j.matpr.2017.11.373
[8] Math, P., Kumar, B.S.P. (2021). Analysis optimization and modelling of CO2 welding process parameters in fabrication of mild steel plates. In Materials Today: Proceedings, 45: 420-423. https://doi.org/10.1016/j.matpr.2020.12.1004
[9] Abima, C.S., Akinlabi, E.T., Akinlabi, S.A., Fatoba, O.S., Oladijo, O.P. (2019). Microstructural, mechanical and corrosion properties of aluminium MIG welds reinforced with copper powder. International Journal of Advanced Manufacturing Technology, 105(12): 5181–5190. https://doi.org/10.1007/s00170-019-04546-9
[10] Das, B., Debbarma, B., Rai, R.N., Saha, S.C. (2013). Influence of process parameters on depth of penetration of welded joint in MIG welding process. International Journal of Research in Engineering and Technology, 2(10): 220-224.
[11] Kanakavalli, P.B., Babu, B.N., Vishnu, C.P.N. (2020). A hybrid methodology for optimizing MIG welding process parameters in joining of dissimilar metals. Materials Today: Proceedings, 23: 507-512. https://doi.org/10.1016/j.matpr.2019.05.396
[12] Majumder, P., Sinha, A., Biswas, A. (2021). Effect of preheating techniques on bead geometry and microhardness of weldment developed through the submerged arc welding process. Materials Today: Proceedings, 46: 5001-5007. https://doi.org/10.1016/j.matpr.2020.10.393
[13] Chandran, S., Rajesh, R., Anand, M.D. (2021). Multi-response optimization of process parameters for laser beam welding of AA6061-Ti6Al4V by grey relational analysis. In Materials Today: Proceedings, 46: 7492-7496. https://doi.org/10.1016/j.matpr.2021.01.172
[14] Mishra, B., Panda, R.R., Mohanta, D.K. (2014). Metal inert gas (Mig) welding parameters optimization. International Journal of Multidisciplinary and Current Research, 2: 637-639.
[15] Schneider, C., Lisboa, C., Silva, R., Lermen, R. (2017). Optimizing the parameters of TIG-MIG/MAG hybrid welding on the geometry of bead welding using the Taguchi method. Journal of Manufacturing and Materials Processing, 1(2): 14. https://doi.org/10.3390/jmmp1020014
[16] Chen, F.F., Xiang, J., Thomas, D.G., Murphy, A.B. (2020). Model-based parameter optimization for arc welding process. Applied Mathematical Modelling, 81: 386-400. https://doi.org/10.1016/j.apm.2019.12.014
[17] Ahmad, A., Alam, S. (2019). Parametric optimization of TIG welding using Response Surface Methodology. Materials Today: Proceedings, 18: 3071-3079. https://doi.org/10.1016/j.matpr.2019.07.179
[18] Martinez-conesa, E.J., Egea, J.A., Miguel, V., Toledo, C., Meseguer-valdenebro, J.L. (2017). Optimization of geometric parameters in a welded joint through response surface methodology. Construction and Building Materials, 154: 105-114. https://doi.org/10.1016/j.conbuildmat.2017.07.163
[19] Srivastava, S., Garg, R.K. (2017). Process parameter optimization of gas metal arc welding on IS:2062 mild steel using response surface methodology. Journal of Manufacturing Processes, 25: 296-305. https://doi.org/10.1016/j.jmapro.2016.12.016
[20] Aydin, H., Bayram, A., Esme, U., Kazancoglu, Y., Guven, O. (2010). Application of grey relation analysis (GRA) and Taguchi method for the parametric optimization of friction stir welding (FSW) process. Materiali in Tehnologije, 44(4): 205-211.
[21] Jajimoggala, S., Dhananjay, R., Lakshmi, V.V.K., Shabana. (2019). Multi-response optimization of hot extrusion process parameters using FEM and Grey relation based Taguchi method. Materials Today: Proceedings, 18: 389-401. https://doi.org/10.1016/j.matpr.2019.06.316
[22] Haq, A.N., Marimuthu, P., Jeyapaul, R. (2008). Multi response optimization of machining parameters of drilling Al/SiC metal matrix composite using grey relational analysis in the Taguchi method. Int J Adv Manuf Technol, 37: 250-255. https://doi.org/10.1007/s00170-007-0981-4
[23] Wakchaure, K.N., Thakur, A.G., Gadakh, V., Kumar, A. (2018). Multi-objective optimization of friction stir welding of Aluminium alloy 6082-T6 using hybrid taguchi-grey relation analysis- ANN method. Materials Today: Proceedings, 5(2): 7150-7159. https://doi.org/10.1016/j.matpr.2017.11.380
[24] Srirangan, A.K., Paulraj, S. (2016). Multi-response optimization of process parameters for TIG welding of Incoloy 800HT by Taguchi grey relational analysis. Engineering Science and Technology, an International Journal, 19(2): 811-817. https://doi.org/10.1016/j.jestch.2015.10.003
[25] Tansel, I.N., Demetgul, M., Okuyucu, H., Yapici, A. (2010). Optimizations of friction stir welding of aluminum alloy by using genetically optimized neural network. International Journal of Advanced Manufacturing Technology, 48(1-4): 95-101. https://doi.org/10.1007/s00170-009-2266-6
[26] Wang, H., Li, J., Liu, L. (2021). Process optimization and weld forming control based on GA-BP algorithm for riveting-welding hybrid bonding between magnesium and CFRP. Journal of Manufacturing Processes, 70: 97-107. https://doi.org/10.1016/j.jmapro.2021.08.024
[27] Azadi Moghaddam, M., Kolahan, F. (2021). Modeling and optimization of A-GTAW process using back propagation neural network and heuristic algorithms. International Journal of Pressure Vessels and Piping, 194(PA): 104531. https://doi.org/10.1016/j.ijpvp.2021.104531
[28] Zeraati, M., Arshadizadeh, R., Chauhan, N.P.S., Sargazi, G. (2021). Genetic algorithm optimization of magnetic properties of Fe-Co-Ni nanostructure alloys prepared by the mechanical alloying by using multi-objective artificial neural networks for the core of transformer. Materials Today Communications, 28: 102653. https://doi.org/10.1016/j.mtcomm.2021.102653
[29] Medhi, T., Hussain, S.A.I., Roy, B.S., Saha, S.C. (2021). An intelligent multi-objective framework for optimizing friction-stir welding process parameters. Applied Soft Computing, 104: 107190. https://doi.org/10.1016/j.asoc.2021.107190
[30] Chang, Y., Yue, J., Guo, R., Liu, W., Li, L. (2020). Penetration quality prediction of asymmetrical fillet root welding based on optimized BP neural network. Journal of Manufacturing Processes, 50: 247-254. https://doi.org/10.1016/j.jmapro.2019.12.022
[31] Padmanaban, R., Vignesh, R.V., Povendhan, A.P., Balakumharen, A.P. (2018). Optimizing the tensile strength of friction stir welded dissimilar aluminium alloy joints using particle swarm optimization. In Materials Today: Proceedings, 5: 24820-24826. https://doi.org/10.1016/j.matpr.2018.10.280
[32] Gao, Z., Shao, X., Jiang, P., et al. (2016). Parameters optimization of hybrid fi ber laser-arc butt welding on 316L stainless steel using Kriging model and GA. Optics and Laser Technology, 83: 153-162. https://doi.org/10.1016/j.optlastec.2016.04.001
[33] Yang, Y., Cao, L., Zhou, Q., Wang, C., Wu, Q., Jiang, P. (2018). Multi-objective process parameters optimization of Laser-magnetic hybrid welding combining Kriging and NSGA-II. Robotics and Computer–Integrated Manufacturing, 49: 253-262. https://doi.org/10.1016/j.rcim.2017.07.003
[34] Kumar, A., Sundarrajan, S. (2009). Optimization of pulsed TIG welding process parameters on mechanical properties of AA 5456 Aluminum alloy weldments. Materials and Design, 30(4): 1288-1297. https://doi.org/10.1016/j.matdes.2008.06.055
[35] Kumar, D., Jindal, S. (2014). Optimization of process parameters of gas metal ARC welding by Taguchi ’ s experimental design method. International Journal of Surface Engineering and Materials Techonolgy, 4(1): 24-27.
[36] Frango, T.L., Prabhakaran, M., Sivakandhan, C., Babu, K.V., Vairamuthu, J. (2020). Materials today: Proceedings enhancement of welding strength on Eglin steel using MIG welding process. In Materials Today: Proceedings, 33: 4617-4620. https://doi.org/10.1016/j.matpr.2020.08.198
[37] Patil, S., Waghmare, C. (2013). Optimization of MIG Welding parameters for improving strength of welded joints. International Journal of Advanced Engineering Research and Studies, 1(5): 14-17.
[38] Rizvi, S.A., Tewari, S.P. (2018). Optimization of welding parameters by using Taguchi method and study of fracture mode characterization of SS304H welded by GMA welding. Jordan Journal of Mechanical and Industrial Engineering JJMIE, 12(1): 17-22.
[39] Swami, S.A., Jadhav, S.M., Deshpande, A. (2016). Influence of MIG welding process parameters on tensile properties of mild steel. European Journal of Engineering Research and Science, 1(2): 1-5.
[40] Singh, V. (2013). An investigation for gas metal arc welding optimum parameters of mild steel AISI 1016 using Taguchi ‟ s method. International Journal of Engineering and Advanced Technology, 2(6): 6-8.