Emad Toma Karash* | Tymor Abed Alsttar Sediqer | Mohammad Takey Elias Kassim
© 2021 IIETA. This article is published by IIETA and is licensed under the CC BY 4.0 license (http://creativecommons.org/licenses/by/4.0/).
OPEN ACCESS
In this research, three mathematical models were designed, the first consisting of concrete, the second from carbon fiber, and the third from s-glass fiber, in order to compare the strength of composite materials to different stresses and deformations, because composite materials are better than concrete in terms of weight and shape and do not need to be applied to painting operations in addition to the fact that their thermal insulation is higher than Concrete in high proportions. From the results of the comparison, it was found that the second model was the best model in terms of bearing deformations, as the deformation percentage in it did not exceed the deformation of concrete a lot, reaching (17%), which is a very small percentage, and the stresses towards pregnancy for the second and third models were much better than the bearing of the first model, but the results indicate that the Von Mises Stress in the second model is higher than the first model by a percentage (57%), while the comparison of the third model with the first was the rate of increase percentage (47%).
solid block, composite material, concrete, fiber glass, carbon fiber, finite element
The walls are one of the components of any architectural structure. The technical characteristics of the walls are considered to be of great importance in influencing the architectural, structural and engineering design of these facilities, as the material and quality of the walls, their thickness, density and ability to thermal insulation have the greatest impact on the structure. We find that the dead loads of the walls affect the construction sectors. For the structure, the more the walls are lighter in weight, the more this leads to savings in the structural structure. Likewise, the greater the capacity of the walls for thermal insulation, the more this leads to savings in the air conditioning loads of the plant. Building materials are exposed to many external factors, including natural factors such as temperature differences, high humidity, exposure to rain and sunlight, tremors and earthquakes, including other factors such as chemical influences and organic materials. Therefore, bricks must bear in all cases the stresses and pressures to which they are exposed, in addition to resisting weather and natural influences and fire. It is also preferable to have ease of manufacture.
Conventional steel reinforcement for reinforcing concrete structures has many disadvantages, including high weight, exposure to natural and chemical corrosion, and high thermal conductivity. But, thanks to the development of construction technologies, high-strength non-metallic reinforcement made of composite materials is currently widely used for reinforcement, and is free from these drawbacks. The compound reinforcement, in addition to excellent physical and mechanical strength, has high chemical resistance to all known aggressive environments, including gas, chloride salts, antifreeze reagents, seawater, etc. Strength tests show that the operating time of building structures reinforced with composite materials is over 100 years [1-6]. Despite the scientific evolution of structural masonry technology in recent years, design methods and structural safety analysis some serious improvements are still needed. Current knowledge does not clearly establish the exact group of strength and deformation parameters and their respective weights and safety factors for limit state analysis. Further details of the factors related to material properties, unit production methods, construction procedures and quality control should be continued [7]. Some research projects [8-11] have been working on numerical models for masonry structures, such as micromodel ling (which details 3D blocks) of masonry elements.
Recently, there has been a rapid growth in research and innovation in the natural fiber composite (NFC) area. Interest is warranted due to the advantages of these materials compared to others such as synthetic fiber composites including low environmental impact and low cost, which supports their potential across a wide range of applications. Therefore, the demand of ecological building materials is rapidly growing in the market, particularly regarding insulating materials from renewable resources. Many researchers have approached the study of such natural materials, especially investigating their thermal insulating and mechanical properties. The most studied materials are jute [12-14], cork [15], corncob [16, 17], hay [18], sugarcane [19], wood wool and rock wool [20], cellulose loose-fill [21], flax [22-25], straw bales [26-28], coconut [29-32], and hemp [33-36].
In this research, a mathematical model will be designed using the ANSYS program for a hollow block made of composite materials with resistance similar to another block made of concrete and has the same resistance to stresses, and then after that the difference between the solid block made of composite materials and the hollow block made of concrete will be calculated.
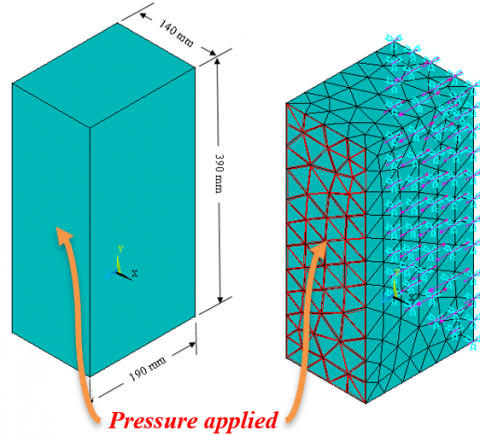
A 3D Finite Element model was created to simulate an impact test in ANSYS 15.0, Figure 1 shown the models. Eight different pressures were taken to apply on the sample which are (0.12, 0.52, 1.2, 3.2, 5.2, 7.2, 9.2, 11.2 MPa). The results were shown when pressure (11.2 MPa) in the three mathematical models, which failure the concrete block in the laboratory test.
Numerical simulations are performed based on the laboratory conditions used in a practical test for impact testing as we take into account the shape and geometry of the sampling process and boundary conditions. We will focus on two main aspects of this procedure. Sample modeling and failure stress calculation. Simulation was performed using Structural ANSYS (15.0).
Three models from different materials were designed to compare the deformations and stresses affecting them. The models chosen are concrete, carbon fiber, and S- fiberglass models. Symbols for the fiberglass and carbon fiber model were chosen as shown in Figure 2.
Figure 1. Solid block geometry
A. Carbon fib
B. Fiberglass
Figure 2. Codes of composite materials models, A. Carbon fiber, B- S- fiberglass
Table 1. Elastic characteristics of carbon fiber and fiberglass [36-39]
|
Model |
Materials |
Density ρ, Kg/m3 |
Thermal Conductivity W/m.k |
Modulus of elasticity E, GPa |
Tensile strength MPa |
Compressive strength, MPa |
Passion ratio |
Height, (cm) |
Width w, (cm) |
Thickness t, (cm) |
Volume of concrete m3 |
Weight W, (Kg) |
|
|
M1 |
Concrete |
2400 |
0.8 |
7.721 |
3.57 |
13.8 |
0.087 |
39 |
14 |
19 |
0.010374 |
24.897 |
|
|
M2 |
Carbon fiber |
Carbon (25%) |
1800 |
0.17 |
230 |
3500 |
889 |
0.3 |
39 |
14 |
19 |
0.010374 |
14.005 |
|
Epoxy (75%) |
1200 |
0.23 |
3.5 |
50 |
82 |
0.3 |
|||||||
|
M3 |
Fiber glass |
Glass (25%) |
2500 |
0.8 |
87 |
- |
11.02 |
0.2 |
39 |
14 |
19 |
0.010374 |
15.820 |
|
Epoxy (75%) |
1200 |
0.23 |
3.5 |
50 |
82 |
0.3 |
|||||||
Table 2. Elastic characteristics of carbon fiber and fiberglass [39]
|
Material |
Eii, MPa |
Gii, MPa |
vij |
vij |
|
Carbon fiber |
E11=91000 |
G12=11540 |
v12=0.26 |
v21=0.110 |
|
|
E22=38700 |
G13=2750 |
v13=0.30 |
v31=0.028 |
|
|
E33=8592 |
G23=1070 |
v23=0.30 |
v32=0.067 |
|
Fiberglass |
E11=26600 |
G12=5030 |
v12=0.17 |
v21=0.150 |
|
|
E22=23300 |
G13=1140 |
v13=0.52 |
v31=0.062 |
|
|
E33=10760 |
G23=950 |
v23=0.53 |
v32=0.245 |
Table 3. Specifications used in building mathematical models in the ANSYS 15.0 program
|
No. |
Material |
Number of Layers |
Code |
Model |
Type of Element |
|
1 |
Concrete Model - 1 |
1 |
[0] |
Linear (Isotropic) |
Solid (Concrete 65) |
|
2 |
Carbon fiber Model - 2 |
19 |
[0/90/0/90/0/90/0/90/0/90/0/90/0/90]s |
Linear (Orthotropic) |
Shell (3D 4node 181) |
|
3 |
S-fiberglass Model - 3 |
19 |
[0/90/0/90/0/90/0/90/0/90/0/90/0/90]s |
Linear Orthotropic) |
Three mathematical models were designed, the first model was made of Concrete, the second model was composed of (Carbon fiber) with a ratio of (25% carbon & 75% epoxy), nineteen layers and the third model were composed of (S-fiberglass) and also with a weight ratio (25% glass & 75% epoxy), nineteen layers.
Table 1 shows the specifications of the materials used in the model’s structures, and Table 2 shows Elastic characteristics of carbon fiber - and S-fiberglass, while Table 3 shows the specifications used to draw test samples and codes of materials used in all tests.
The concrete block's bearing of the compressive force was tested, and it was found that the model collapsed when carrying load (252 KN), Pressure (11.2 MPa) and this load was considered the maximum load. Mathematical models are loaded in the design and the Figure 3 shows that test.
After completing the first model consisting of concrete in the ANSYS program, the results were obtained in Table 4 and Figure 4.
Second model consisting of Carbon Epoxy in the ANSYS program, the results were obtained in Table 5 and Figure 5.
Third model consisting of S - Fiberglass in the ANSYS program, the results were obtained in Table 6 and Figure 6.
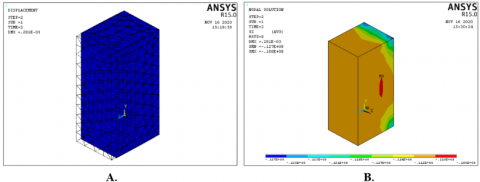
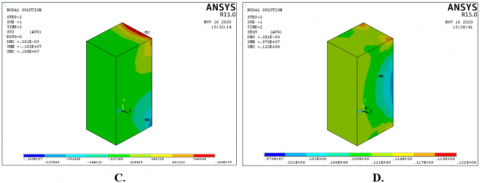
From Table 4 and Figure 4, the results of the first model test are shown, when the highest compression stress was in the direction of the z-axis and the value of this stress was $\left(\delta_{z}=12.7 \mathrm{MPa}\right)$, while the highest shear stress was the plane (YZ) and its value was $\left(\tau_{y z}=1.08 \mathrm{MPa}\right)$, either the value of Von Mises Stress was $\left(\delta_{\text {Von }}=12.7 \mathrm{MPa}\right)$, and the value of deformation $(0.281 \mathrm{~mm})$.
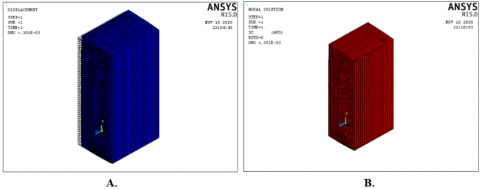
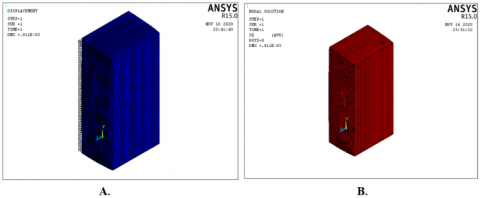
Either from Table 5 and Figure 5, the results of the second model test are shown, when the highest compression stress was in the direction of the x-axis and the value of this stress was ( $\delta_{x}=22.4 \mathrm{MPa}$ ) and compression stress was in the direction of the z-axis and the value of this stress was ( $\delta_{z}=0$ ), while the highest shear stress was the plane (XY) and its value was ( $\tau_{x y}=12.1 \mathrm{MPa}$ ), either the value of Von Mises Stress was ( $\delta_{\text {Von }}=28.5 \mathrm{MPa}$ ), and the value of deformation ( $0.301 \mathrm{~mm}$ ).
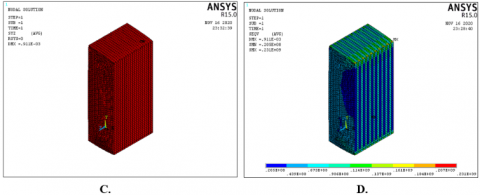
While from Table 6 and Figure 6, the results of the second model test are shown, when the highest compression stress was in the direction of the x-axis and the value of this stress was ( $\delta_{x}=21.1 \mathrm{MPa}$ ) and compression stress was in the direction of the z-axis and the value of this stress was ( $\delta_{z}=0$ ), while the highest shear stress was the plane (XY) and its value was ( $\tau_{x y}=8.75 \mathrm{MPa}$ ), either the value of Von Mises Stress was ( $\delta_{\text {Von }}=23.1 \mathrm{MPa}$ ), and the value of deformation ( $0.911 \mathrm{~mm}$ ).
Figure 3. The result of a concrete block breakdown test under the influence of a compressive force
Figure 4. Results of test first model (Concrete) by using ANSYS -15.0 program, A. Deformation, B. Compression stress in Z-axis direction, C. Shear stress in YZ-axis direction, D. Von Mises stress
Table 4. Results of test first model (Concrete) by using ANSYS -15.0 program
|
NO. |
Type of test |
Displacement (DMX), mm |
Maximum value (SMN), MPa |
Minimum value (SMX), MPa |
|
1 |
X-Component Stress |
0.0219 |
- 12.8 |
10.8 |
|
2 |
Y-Component Stress |
0.0219 |
- 15.4 |
16.6 |
|
3 |
Z-Component Stress |
0.0219 |
- 27.8 |
6.99 |
|
4 |
XY-Component Stress |
0.0219 |
- 2.88 |
3.59 |
|
5 |
YZ-Component Stress |
0.0219 |
-3.82 |
6.79 |
|
6 |
XZ-Component Stress |
0.0219 |
4.87 |
3.95 |
|
7 |
First Principal Stress |
0.0219 |
- 10.9 |
17.6 |
|
8 |
Second Principal Stress |
0.0219 |
- 14.2 |
12.2 |
|
9 |
Third Principal Stress |
0.0219 |
-29.3 |
4.6 |
|
10 |
Stress Intensity |
0.0219 |
0.004 |
28.1 |
|
11 |
Von Mises Stress |
0.0219 |
9790 |
12200 |
Table 5. Results of test second model (Carbon Epoxy) by using ANSYS -15.0 program
|
NO. |
Type of test |
Displacement (DMX), mm |
Maximum value (SMN), KPa |
Minimum value (SMX), KPa |
|
1 |
X-Component Stress |
0.301 |
- 224000 |
2710 |
|
2 |
Y-Component Stress |
0.301 |
- 113000 |
83700 |
|
3 |
Z-Component Stress |
0.301 |
0 |
0 |
|
4 |
XY-Component Stress |
0.301 |
- 121000 |
69000 |
|
5 |
YZ-Component Stress |
0.301 |
0 |
0 |
|
6 |
XZ-Component Stress |
0.301 |
0 |
0 |
|
7 |
First Principal Stress |
0.301 |
0 |
8370 |
|
8 |
Second Principal Stress |
0.301 |
0 |
5700 |
|
9 |
Third Principal Stress |
0.301 |
- 292000 |
7130 |
|
10 |
Stress Intensity |
0.301 |
9810 |
292000 |
|
11 |
Von Mises Stress |
0.301 |
9140 |
285000 |
Figure 5. Results of test second model (Carbon Epoxy) by using ANSYS -15.0 program, A. Deformation, B. Compression stress in Z-axis direction, C. Shear stress in YZ-axis direction, D. Von Mises stress
Table 6. Results of test third model (S - Fiberglass) by using ANSYS -15.0 program
|
NO. |
Type of test |
Displacement (DMX), mm |
Maximum value (SMN), KPa |
Minimum value (SMX), KPa |
|
1 |
X-Component Stress |
0.911 |
-211000 |
19600 |
|
2 |
Y-Component Stress |
0.911 |
- 129000 |
64100 |
|
3 |
Z-Component Stress |
0.911 |
0 |
0 |
|
4 |
XY-Component Stress |
0.911 |
- 87500 |
56600 |
|
5 |
YZ-Component Stress |
0.911 |
0 |
0 |
|
6 |
XZ-Component Stress |
0.911 |
0 |
0 |
|
7 |
First Principal Stress |
0.911 |
0 |
64100 |
|
8 |
Second Principal Stress |
0.911 |
0 |
79500 |
|
9 |
Third Principal Stress |
0.911 |
- 251000 |
22800 |
|
10 |
Stress Intensity |
0.911 |
22800 |
251000 |
|
11 |
Von Mises Stress |
0.911 |
20500 |
231000 |
Figure 6. Results of test third model (S - Fiberglass) by using ANSYS -15.0 program, A. Deformation, B. Compression stress in Y-axis direction, C. Shear stress in XZ-axis direction, D. Von Mises stress
We conclude from the results of the comparison between the three models, that the best model is the second model because the deformation ratio in the second model is small compared to the deformation ratio of the first model when using a high compressive force of (11.2 MPa), Where the percentage of distortion was higher (17%), but in the third model it was much more where Its value (69%). The percentage of Von Mises stress increase was in the second model compared to the first model (57%), while in the third model the increase was also compared to the first model (47%). The value of the compression stress ( $\delta_{Z}$ ) in both the second and third models was equal ( $\delta_{z}=0$ ), while its value was in the first model ( $\delta_{z}=12.7 \mathrm{MPa}$ ), and this indicates that the resistance of the composite materials to compression stresses towards the direction of the load shedding is less than it was in the first model. But the stress towards the x - axis was in the second model ( $\delta_{x}=22.4 \mathrm{MPa}$ ) In the third model, its value was $\left(\delta_{x}=21.1 \mathrm{MPa}\right)$. The results also show that the highest shear stress in the first model was in the plane (YZ) and its value ( $\delta_{y z}=1.1 \mathrm{MPa}$ ), while in the second model the highest value of the shear stress was in the plane (XY) and its value $\left(\delta_{x y}=69 \mathrm{MPa}\right)$, and in the third model the highest value of the shear stress was in the plane (XY) and its value ( $\delta_{x y}=56.6 \mathrm{MPa}$ ). The results also show that the weight of the second model is less than (44%) compared to the first model, and the third model compared to the first model, the percentage is less than (37.5%). The thermal insulation in the second model is better than the first model (3.8) once, and the third model is better than the first model (4.4) once. This shows the importance of using composite materials in the manufacture of hard and hollow blocks, less weight, higher thermal insulation, and no need for painting and other works.
This research was supported by Engineering Science Research Program through the Northern Technical University / Technical Institute of Mosul funded by the Ministry of Higher Education and Scientific Research / Republic of Iraq. (No. 00333- 2020).
[1] Wang, S., Avrunin, G.S., Clarke, L.A. (2005). Architectural Building Blocks for Plug-and-Play System Design. In: Gorton I. et al. (eds) Component-Based Software Engineering. CBSE 2006. Lecture Notes in Computer Science, vol 4063. Springer, Berlin, Heidelberg. https://doi.org/10.1007/11783565_7
[2] van der Linden, F.J., Müller, J.K. (1995). Creating architectures with building blocks. IEEE Softw., 12(6): 51-60. https://doi.org/10.1109/52.469760
[3] Giannakopoulou, D., Magee, J. (2003). Fluent model checking for event-based systems. In Proc. 9th European Softw. Eng. Conf. / 11th ACM SIGSOFT Intl. Symp. on Found. of Softw. Eng., Helsinki, Finland, pp. 257-266.
[4] Zanolin, L., Ghezzi, C., Baresi, L. (2003). An approach to model and validate publish/subscribe architectures. In Proc. Specification and Verification of Component-Based Systems, Helsinki, Finland, pp. 35-41.
[5] Ray, A., Cleaveland, R. (2003). Architectural interaction diagrams: AIDs for system modeling. In Proc. 25th Intl. Conf. on Soft. Eng., pp. 396-406.
[6] Bradbury, J.S., Dingel, J. (2003). Evaluating and improving the automatic analysis of implicit invocation systems. In Proc. 11th ACM Symp. on Found. of Soft. Eng., Finland.
[7] Barbosa, C.S., Hanai, J.B. (2009). Strength and deformability of hollow concrete blocks: Correlation of block and cylindrical sample test results. IBRACON Structures and Materials Journal, 2(1): 8-99. https://doi.org/10.1590/S1983-41952009000100005
[8] Gomes, I.R. (2001). Numerical simulation of mansonry prisms under compression using Finite Element Methods with interface elements. Revista IBRACON de Estruturas e Materiais, 10(2). https://doi.org/10.1590/S1983-41952017000200010
[9] Berto, L., Saetta, A., Scotta, R., Vitaliani, R. (2005). Failure mechanism of masonry prism loaded in axial compression: Computational aspects. Materials and Structures, 38: 249-256. https://doi.org/10.1007/BF02479350
[10] Drobiec, L. (2005). FEM micro model of masonry. 5th International Conference AMCM 2005At: Ustroń - Gliwice.
[11] Köksal H.O., Karakoç C., Yildirim H. (2005). Compression behavior and failure mechanisms of concrete masonry prisms. Journal of Materials in Civil Engineering, 17(1): 107-115. https://doi.org/10.1061/(ASCE)0899-1561(2005)17:1(107)
[12] Korjenic, A., Petránek, V., Zach, J., Hroudová, J. (2011). Development and performance evaluation of natural thermal-insulation materials composed of renewable resources. Energy Build., 43(9): 2518-2523. https://doi.org/10.1016/j.enbuild.2011.06.012
[13] Singh, B., Gupta, M., Tarannum, H. (2010). Jute sandwich composite panels for building applications. J. Biobased Mater. Bioenergy, 4(4): 397-407. https://doi.org/10.1166/jbmb.2010.1110
[14] Cosereanu, C., Lazarescu, C., Curtu, I., Lica, D., Sova, D., Brenci, L.M., Stanciu, M.D. (2010). Research on new structures to replace polystyrene used for thermal insulation of buildings. Mater. Plast., 47(3): 341-345.
[15] Silva, S.P., Sabino, M.A., Fernandas, E.M., Correlo, V.M., Boesel, L.F., Reis, R.L. (2005). Cork: Properties, capabilities and applications. Int. Mater. Rev., 50(6): 345-365. https://doi.org/10.1179/174328005X41168
[16] Pinto, J., Cruz, D., Paiva, A., Pereira, S., Tavares, P., Fernandes, L., Varum, H. (2012). Characterization of corn cob as a possible raw building material. Constr. Build. Mater., 34: 28-33. https://doi.org/10.1016/j.conbuildmat.2012.02.014
[17] Paivaa, A., Pereiraa, S., Sá, A., Cruz, D., Varum, H., Pinto, J. (2012). A contribution to the thermal insulation performance characterization of corn cob particleboards. Energy Build., 45: 274-279. https://doi.org/10.1016/j.enbuild.2011.11.019
[18] Kodah, Z.H., Jarrah, M.A., Shanshal, N.S. (1999). Thermal characterization of foam-cane (Quseab) as an insulant material. Energy Convers. Manag., 40(4): 349-367.
[19] Manohar, K., Ramroopsingh, J., Yarbrough, D.W. (2002). Use of sugarcane fiber as building insulation. Am. Soc. Test. Mater., 1426: 299-313. https://doi.org/10.1520/STP11020S
[20] Awwad, Z., Giuseppe, R. (2003). A study on the physical properties of rock wool fiber—polystyrene composite. Journal of Thermoplastic Composite Materials, 16(3): 273-283. https://doi.org/10.1177/0892705703016003005
[21] Nicolajsen, A. (2005). Thermal transmittance of a cellulose loose-fill insulation material. Build. Environ., 40(7): 907-914. https://doi.org/10.1016/j.buildenv.2004.08.025
[22] Lazko, J., Dupré, B., Dheilly, R.M., Quéneudec, M. (2011). Biocomposites based on flax short fibres and linseed oil. Ind. Crops Prod., 33(2): 317-324. https://doi.org/10.1016/j.indcrop.2010.11.015
[23] Dalmay, P., Smith, A., Chotard, T., Sahay-Turner, P., Gloaguen, V., Krausz, P. (2010). Properties of cellulosic fibre reinforced plaster: Influence of hemp or flax fibres on the properties of set gypsum. J. Mater. Sci., 45(3): 793-803. https://doi.org/10.1007/s10853-009-4002-x
[24] Svennerstedt, B. (2005). Advantages of recycled & renewable materials for structural and insulation applications. Nonwovens World Mag., 14(5): 39-48.
[25] Kymäläinen, H.R., Sjöberg, A.M. (2008). Flax and hemp fibres as raw materials for thermal insulations. Build. Environ., 43(7): 1261-1269. https://doi.org/10.1016/j.buildenv.2007.03.006
[26] Ashour, T., Georg, H., Wu, W. (2011). Performance of straw bale wall: A case of study. Energy Build., 43(8): 1960-1967. https://doi.org/10.1016/j.enbuild.2011.04.001
[27] Ashour, T., Wieland, H., Georg, H., Bockisch, F.J., Wu, W. (2010). The influence of natural reinforcement fibres on insulation values of earth plaster for straw bale buildings. Mater. Des., 31(10): 4676-4685. https://doi.org/10.1016/j.matdes.2010.05.026
[28] Goodhew, S., Carfrae, J., De Wilde, P. (2010). Briefing: Challenges related to straw bale construction. Proceedings of the Institution of Civil Engineers. Eng. Sustain., 163(4): 185-189. https://doi.org/10.1680/ensu.2010.163.4.185
[29] Khedari, J., Charoenvai, S., Hirunlabh, J. (2003). New insulating particleboards from durian peel and coconut coir. Build. Environ., 38(3): 435-441. https://doi.org/10.1016/S0360-1323(02)00030-6
[30] Asasutjarit, C., Hirunlabh, J., Khedari, J., Charoenvai, S., Zeghmati, B., Shin, U.C. (2007). Development of coconut coir-based lightweight cement board. Constr. Build. Mater., 21(2): 277-288. https://doi.org/10.1016/j.conbuildmat.2005.08.028
[31] Vershchaka, S.M., Karash, E.T. (2012). Modeling of multi-layer composite material pipes under internal pressure. International Journal of Structronics & Mechatronics, 1-12.
[32] Kochhar, G.S., Manohar, K. (1997). Use of coconut fiber as a low-cost thermal insulator. In Insulation Materials: Testing and Applications; Graves, Z., Ed.; ASTM: West Conshohocken, PA, USA, 3: 283-291.
[33] Elfordy, S., Lucas, F., Tancret, F., Scudeller, Y., Goudet, L. (2008). Mechanical and thermal properties of lime and hemp concrete (“hempcrete”) manufactured by a projection process. Constr. Build. Mater., 22(10): 2116-2123. https://doi.org/10.1016/j.conbuildmat.2007.07.016
[34] Karash E.T. (2016). Experimental and theoretical results of the internal hydro static pres-sure of multilateral pipes. Materials Science MSAIJ, an Indian Journal, 316-325.
[35] Karash E.T. (2017). The study contact bending stress two-layer plates from fiberglass with interfacial defects of structure. Agricultural Research & Technology, 1-4. https://doi.org/10.19080/ARTOAJ.2017.12.555834
[36] Briccoli, B.S., Rovero, L., Tonietti, U. (2007). Strengthening masonry arches with composite materials. Journal of Composites for Construction, 11(1): 33-41. https://doi.org/10.1061/(ASCE)1090-0268(2007)11:1(33)
[37] Akeem, A.R., Ayodeji, K.M., Aliu, A.S. (2012). Comparative analysis of sand Crete hollow blocks and laterite interlocking blocks as walling elements. International Journal of Sustainable Construction Engineering & Technology), 3(1): 79-88.
[38] Sebastián, C., Laura, V., Cristián, S., Gerardo Araya, L. (2020). Behavior of partially grouted concrete masonry walls under quasi-static cyclic lateral loading. Materials, 13(10): 1-33.
[39] Wang, S.R, Qiu, J.J. (2010). Thermal conductivity of glass fiber/polymer composites through carbon nanotubes incorporation. Composites Part B: Engineering, 41(7): 533-536. https://doi.org/10.1016/j.compositesb.2010.07.002