Abhishek Agarwal* | Linda Mthembu
© 2021 IIETA. This article is published by IIETA and is licensed under the CC BY 4.0 license (http://creativecommons.org/licenses/by/4.0/).
OPEN ACCESS
The purpose of an automotive chassis is to maintain the shape of the vehicle and bear the various loads that are applied to the vehicle. The structure typically accounts for a large portion of the development and production costs of the new vehicle program, and the designer has many different structural concepts available. Choosing the best is important to ensure acceptable structural performance under other design constraints, such as cost, volume and method of production, product application, and more. The material selection for chassis depends upon various factors like lightness, economy, safety, recyclability, and circulation of life. The current study aims to perform optimization of the design of a heavy vehicle chassis using central composite design & optimal space fill design scheme (s) with the material tested is Al6092/SiC/17.5p MMC. Different design points are generated using design of experiments. The equivalent stress, deformation and mass are evaluated for each design points. The CAD modelling and FE simulation of heavy motor vehicle chassis is conducted using ANSYS software. From the optimization conducted on chassis design, response surface plots of equivalent stress, deformation and mass are generated which enabled to determine the range of dimensions for which these parameters are maximum or minimum. The use of Discontinuously Reinforced Aluminium-Matrix Composites Al6092/SiC/17.5p MMC aided to reduce weight of chassis by 66.25% and 66.68% by using CCD and Optimal space fill design scheme respectively, without much reduction in strength of chassis.
heavy vehicle chassis (HVC), automobile, stress, deformation, Al6092/SiC/17.5p MMC
The chassis is one of the vital components of an automobile which supports various components like suspension system, wheels, and engine. The demand for good strength to weight ratio components in automobile sector has increased enormously which could be attributed to high rise in fuel process. The material and design of chassis should be done to resist static as well as dynamic loads. Apart from these loads, the torsional loads, shock loads are also encountered by chassis as per different driving conditions. The stiffness of chassis should be good enough which enables to regain its original shape after removal of forces. Commercial vehicles such as trucks, trailers, and semi-trailers have ladder chassis. They generally consist of two beams arranged parallel to the longitudinal axis of the frame and a plurality of transverse beams arranged laterally between the beams. To accomplish a significant weight decrease and quality extension, these optimization approaches should be further stretched out to decide the optimal design [1]. It has been demonstrated that, the optimization techniques are very encouraging methods for systematic design development in the engineering specially automotive sector which shows the real life simulation before the actual manufacturing of the component or assembly [2]. The studies conducted by Chiandussi et al. [3], Pedersen [4], Agarwal [5] and Duddeck [6] are very fascinating in this direction in which they addressed the optimization of suspensions, layout profiles, and body parts. Madan Mohan Reddy et al. [7] investigated container frame modelling and analysis using the FEM to improve load capacity and reduce frame failure when folding by adding stiffeners. The FEA analysis has predicted 37.11% reduction of stress and 36.23% reduction of stress intensity with the use of stiffeners. Swami et al. [8] conducted static structural analysis on Eicher 20 chassis frame with C shape cross-section using ANSYS FEA software. The findings have shown that thickness of cross members effects the equivalent stress generated. Sandip Godse et al. [9] have conducted static structural analysis on TATA axle frame using ANSYS FEA software. The existing design was further optimized with increased thickness and reinforcements. The findings have shown that conventional design generated stress of 37.04 N/mm2 and optimized design generated 22.97 N/mm2, thus a considerable reduction in stress is achieved by increasing thickness and using reinforcements. Abhishek Sharma et al. [10] have conducted static structural analysis on TATA LPS 2515 EX chassis using ANSYS FEA software. The material used for analysis were AISI 4130 alloy steel and ASTM A710 STEEL GRADE A (CLASS III) and cross section analyzed for chassis were B type, C type, I type. The findings have shown that best material for this application is AISI 4130 steel which is lighter than other materials. The box channel shape cross section exhibits higher durability and lower deformation therefore it’s best suited for chassis design of heavy trucks. Ketan Gajanan et al. [11] conducted structural analysis on TATA 407 truck chassis using ANSYS FEA software. The new material used for analysis is E-glass and compared with structural steel. The findings have shown that 60-68% weight reduction is possibly using E-glass, the deformation is also within acceptable limits, but stress generated is higher than steel. Abhishek Singh et al. [12] have conducted FEA analysis on TATA LP 912 chassis using Altair Hyper work software. The material used for analysis was alloy steel and cross section used was C type, I type, rectangular box (solid), rectangular box (hollow). The findings have shown that rectangular (solid) section is more robust than other type of cross sections. Anurag Singh et al. [13] have designed a truck chassis using the CAD software CREO and had performed static analysis using ANSYS software in order to investigate the various stresses acting on it and their resultant deformation. Some researchers [10, 11, 13] conducted on investigation of composite materials and other alloys for chassis application but none of the researches are conducted on application of MMC (Metal Matrix Composite) materials for improvement of chasses strength [14]. As MMC’s has shown very promising results in space application there is good probability that MMC will be a feasible material for chassis application. These materials have a good number of properties including high young’s modulus, high compression and tensile strength, mechanical compatibility, high compression and tensile strength and economic efficiency etc. [15]. Therefore, it is essential to investigate the effect of MMC on chassis strength. Such combination of properties of composite materials can be valuable in the automotive quality and manufacturing sector where vibration, toughness, increasing fuel prices are the serious concerns along with other technical requirements [16].
The findings presented here, are the part of a detailed research study. The aim of present paper is to perform a structural analysis of a heavy motor vehicle chassis & optimize it using different optimization methods to reduce the weight using Reinforced Aluminium-Matrix Composites Al6092/SiC/17.5p MMC. The appropriate data of an existing heavy duty truck chassis of TATA company’s model number 1612 (material used St52 E=2.10 x 10⁵ N / mm2) as a simply supported beam with overhang ladder frame is taken for design and analysis with Side bar of the chassis made from ‘C’ Channels having dimensions 116mm x 25mm x 5 mm [17]. Total load acting on the chassis is 257022N [17]. The CAD modeling and FE simulation is conducted using ANSYS software.
A detailed static structural analysis is conducted in heavy motor vehicle chassis enabled to determine critical regions of high stresses and deformation. The suggestions are produced among the currently used conventional steel and suggested metal matrix composite (s). The variables selected for optimization are cross member width and scheme of optimization are central composite design & optimal space fill design of response surface methodology [18, 19].
The geometric parameters of chassis such as lateral member dimensions have significant effect on stresses, weight and deformation generated on chassis structure which affects the strength of chassis. It is therefore necessary to evaluate the effect of these variables on output parameters (stress, deformation, and weight). The methodology involves Finite Element Analysis of chassis followed by design optimization using central composite design scheme followed by the optimal space filling design response surface method. The preprocessing stage in simulation involves CAD modeling, meshing, and applying loads and boundary conditions [20]. The solution stage involves element matrix formulations, assemblage of global stiffness elements followed by inversions and multiplications [21]. The final stage is post processing which involves viewing and editing of results where the chassis specifications were obtained from [17].
2.1 Simulation & modelling
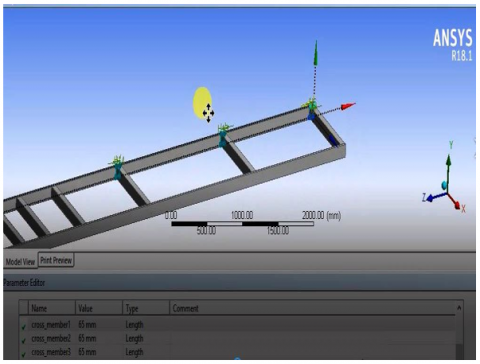
The simulation form used in this study is static structural type. The version of 120 simulation package is ANSYS V18.1. The interaction to software is through graphical user 121 interface (GUI). However, the inbuilt language of software is C++. The CAD model of chassis is developed in ANSYS design modeler using extrude and sketch tool. Figure 1 shows the cross member 1, 2 and 3 in the developed CAD model.
Figure 1. Selected cross members in the CAD model
Subsequent process involves defining optimization variables i.e., cross member 1, cross member 2 and cross member 3. All the three dimensions selected for optimization are of linear type and each having length of 65mm shown in Figure 2.
Figure 2. Variable assignment
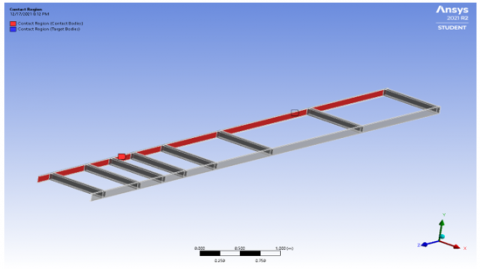
The chassis design has sharp edges and curvatures, and the tetrahedral element is suited for such complex geometries as shown in Figure 3 while Figure 4 shows the contact regions of the model.
Figure 3. Tetrahedral element
Figure 4. Contact region of the model
The chassis design is discretized using tetrahedral elements with growth rate set to 1.2, inflation set to normal, and number of layers set to 5. The number of elements generated is 20080 and number of nodes generated is 42840. The next step involves applying loads and boundary conditions.
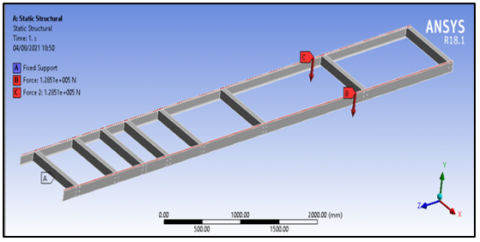
The boundary conditions are determined based on available literature [17] as well as analytical calculations which represents actual, physical conditions acting on HMV chassis. The FEA simulation conditions are same as experimental testing conditions. Total load acting on chassis = Capacity of the Chassis + Weight of body and engine= (25000+600+400+200) * 9.81 = 257022N load acting on each beam is half of the Load acting on the single frame= 257022 / 2 = 128511 N / Beam.
Chassis is simply clamp with Shock Absorber and Leaf Spring. So, Chassis is a Simply Supported Beam with uniformly distributed load and connections are welded type permanent joints. Load acting on Entire span of the beam is 128511N per beam.
Length of the Beam is 8810 mm. Uniformly Distributed Load is 128511/ 8810 =14.58 N/mm.
The downward direction force is applied on both longitudinal members and fixed support is applied on first and last transverse member as shown in Figure 5.
Conventionally used St52E is ductile material which possess isotropic behavior. Al6092/SiC/17.5p is an isotropic MMC with specific mechanical properties [22, 23].
The Al6092/SiC/17.5p has density 2.8 gm/cm3, Youngs Modulus (x) (GPa) 100, Thermal Conductivity 165 (W/m-K) (x-y) [24, 25]. The composite material is defined in material property cell of static structural module in ANSYS workbench.
The structural properties defined is modulus of elasticity, poisons ratio and density. The material properties are also indicated in the Table 1 below.
Table 1. Material property
|
Material |
Density (gm/cm3) |
Youngs Modulus (GPa) |
Thermal Conductivity (W/m-k) |
|
St52E [17, 26] |
7800 |
200 |
60.5 |
|
Al6092/SiC/17.5p [25, 27] |
2.8 |
100 |
165 |
Figure 5. Assigned loads and boundary conditions
After applying loads and boundary conditions, the solver is run using sparse matrix solver [28]. The solution process involves generation of stiffness matrices associated with each element, assemblage of global stiffness matrix followed by matrix inversions and multiplication [29].
3.1 FE Results on a Standard Chassis using Al 6092/SiC/17.5P MMC
The FE simulation is conducted on chassis to determine stresses and deformation. The equivalent stress plot is shown in Figure 6. The equivalent stress observed for square section chassis is 3277.6MPa and 2446.4MPa is maximum stress on longitudinal member.
Figure 6. Equivalent stress generated
The deformation obtained from the analysis is shown in Figure 7. The maximum deformation observed at the centre of chassis is 694.83 mm.
Figure 7. Total deformation plot
3.2 Optimization of chassis using Al 6092/SiC/17.5P MMC
The stresses near the support are higher and is minimum at other zones. In order to improve the chassis’ response to such loads, the optimization is performed. The first optimization scheme used is the central composite design which has the three design points; axial, cube and center points. The software evaluated the output parameters at these design points using Finite Element Analysis. These output parameters are equivalent stress and the total deformation for CCD scheme are shown in column E and column F of the Table 2 (Appendix).
Second optimization scheme used is optimal space filling design (OSFD). The design points generated using optimal space filling design are shown in Table 3 (Appendix). Different combinations of cross member 1, cross member 2 and cross member 3 dimensions are generated based on optimal space filling design scheme.
The equivalent stress, deformation and solid mass are generated for each design point and the maximum and minimum values of these output parameters are shown in Table 4 (Appendix). The maximum equivalent stress obtained using optimal space filling design (OSFD) optimization is 3506.7MPa and minimum equivalent stress obtained from optimization is 3233MPa. The deformation and solid mass output show less variation between maximum and minimum values. The mass of chassis with structural steel is 214.64Kg whereas mass of chassis using Al/SiC MMC is 71.502Kg.
3.2.1 Deformation
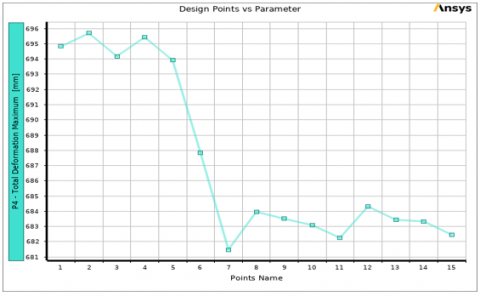
Using CCD scheme, the maximum deformation is observed for design point number two (695.69 mm) and minimum deformation is observed for design point number seven (681.48 mm). The dimensions corresponding to the design point number two (2) is as follows:
The variation of total deformation vs design points is shown in Figure 8.
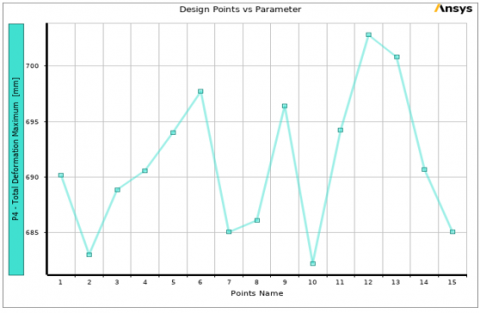
Using OSFD scheme, the maximum deformation is observed for design point number 12 (702.81 mm) and minimum deformation is observed for design point number ten (702.81mm) as shown in Figure 9. The dimensions corresponding to the design point number 12 is as follows:
Figure 8. Total deformation vs design points for CCD scheme
Figure 9. Total deformation vs design points for OSFD scheme
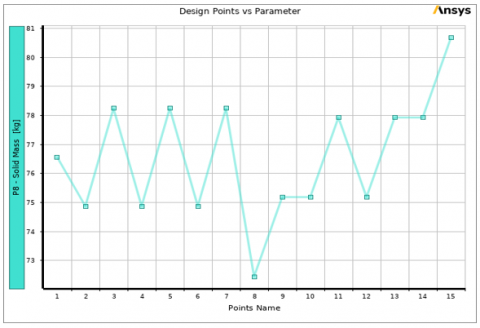
The variation of solid mass vs design points for CCD scheme is shown in Figure 10.
Figure 10. Solid mass vs design points for CCD scheme
The maximum solid mass obtained from optimization is 80.673Kg as design point number 15 and minimum solid mass obtained from analysis is 72.447Kg at design point number 8.
3.2.2 Response surface analysis
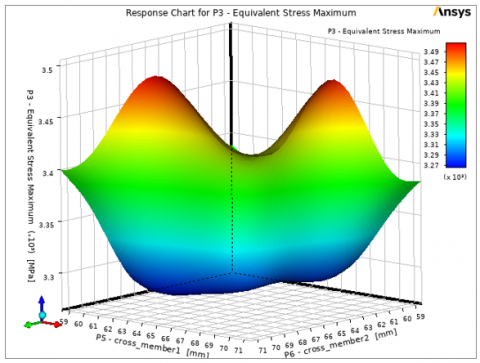
The response surface plot aids to determine the range of values of optimization variables for which equivalent stress is maximum or minimum. The response surface plot of equivalent stress vs cross member 1 and cross member 2 using central composite design scheme is shown in Figure 11. Two peaks of equivalent stress are observed as shown in red colored region.
Figure 11. Response surface plot of equivalent stress vs cross member 1 and cross member 2 for CCD scheme
As per the first peak appeared along cross member 1 dimension, the equivalent stress is maximum for cross member 1 dimension ranging from 62mm to 67mm and cross member 2 dimension ranging from 69mm to 71mm. As per the second peak appeared along cross member 2 dimension, the equivalent stress is maximum for cross member 1 dimension ranging from 69mm to 71mm and cross member 2 dimension ranging from 61mm to 67mm.
The equivalent stress is minimum for other dimensions of cross member 1 and cross member 2 as shown in dark blue colored region.
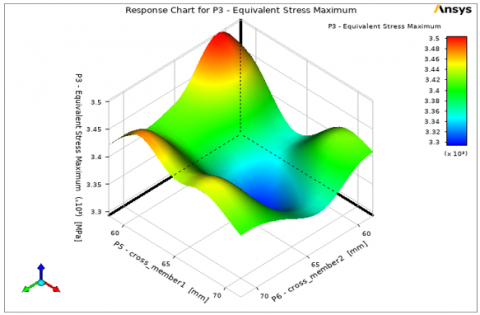
Figure 12 shows the response surface plot of equivalent stress vs cross member 1 and cross member 2 using OSFD scheme.
Figure 12. Response surface plot of equivalent stress vs cross member 1 and cross member 2 using OSFD
The response surface plot of equivalent stress shows 2 peaks as represented in red colored region. The maximum equivalent stress is obtained for cross member 2 ranging from 59mm to 61mm and cross member 1 ranging from 59mm to 61mm. The equivalent stress is observed to be minimum for regions represented in dark blue color.
The response surface plot of equivalent stress vs cross member 2 and cross member 3 using CCD scheme is shown in Figure 13.
Figure 13. Response surface plot of equivalent stress vs cross member 2 and cross member 3 for CCD Scheme
Single peak of equivalent stress is observed as shown in red colored region. The dimensions corresponding to maximum equivalent stress are obtained using interpolation method. The maximum equivalent stress is observed for cross member 3 value ranging from 61mm to 67mm and cross member 2 value ranging from 69mm to 71mm.
The equivalent stress is minimum for other values of cross member 2 and cross member which is represented by dark blue colored region.
The response surface plot of equivalent stress vs cross member 2 and cross member 3 using optimal space filling design is shown in Figure 14.
Figure 14. Response surface plot of equivalent stress vs cross member 2 and cross member 3 using OSFD
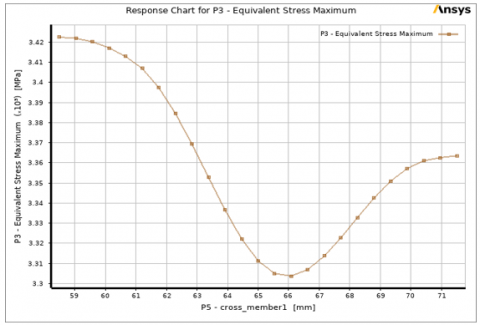
The plot shows maximum equivalent stress in the region represented by red color for which the cross member 2-dimension ranges from 66mm to 71mm whereas cross member 3 ranges from 66mm to 71mm. The equivalent stress is minimum for region represented in dark blue color. The variation of equivalent stress with respect to cross member 1 for CCD scheme is shown in Figure 15. The graph shows gradual increase in equivalent stress up to 65mm.
The equivalent stress then increases exponentially and reaches maximum value of 3510Mpa at cross member dimension of 71mm while the variation of equivalent stress with respect to cross member 3 indicates the gradual increase in equivalent stress up to 63mm cross member 3 dimension and then decreases linearly with increases in cross member 3 dimension. The minimum equivalent stress is observed with cross member 3 dimension of 71.5mm.
Figure 15. Equivalent stress vs cross member 1 for CCD
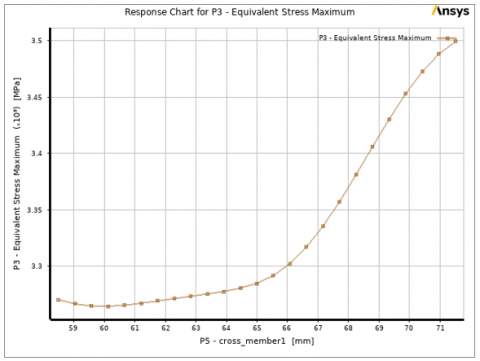
The variation of equivalent stress vs cross member_1 using optimal space filling design is shown in Figure 16. The equivalent stress initially decreases and reaches minimum value at cross_member1 dimension of 66mm and then increases linearly and reaches maximum value at cross_member1 dimension of 71mm.
Figure 16. Equivalent stress vs cross_member 1 using optimal space filling design
The variation of equivalent stress vs cross_member3 indicates the equivalent stress increases and then decreases to reach minimum value at cross_member 3 value of 64mm. The equivalent stress then increases linearly to reach maximum value at cross member 3 dimension of 71mm. It is observed from the variation of equivalent stress vs cross member_2 that the equivalent stress initially decreases up to 64mm and then then increases steadily and reaches maximum value at 71mm and then decreases thereafter.
The variation of mass with respect to cross member 1 and cross member 2 for CCD scheme is shown in response surface plot of Figure 17. The maximum mass is represented in red colored region whereas the minimum mass is represented in blue colored region.
The maximum mass is observed for cross member 1 dimension ranging from 68mm to 71mm and cross member 2 dimension ranging from 68mm to 71mm. The minimum mass is observed for cross member 1 and cross member 3 dimensions ranging from 58.5mm to 61mm. The solid mass is observed to increase linearly with increase in cross member 1 dimension and cross member 3 dimensions. The minimum mass of chassis is observed for cross member 1 dimension of 58.5mm. The minimum mass of chassis is observed for 58.5mm cross member 3 and cross member 1 dimension.
Figure 17. 3D response surface plot of solid mass for CCD
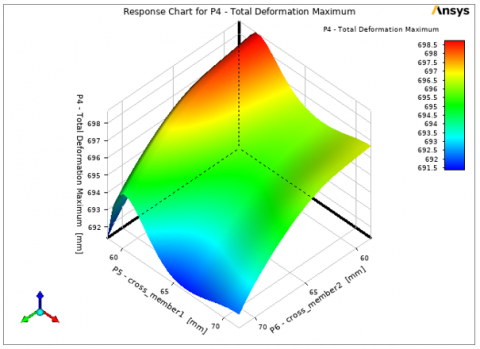
The response surface plot of deformation cross member 1 and cross member 2 using optimal space filling design is shown in Figure 18. The plot shows maximum deformation for cross_member 2 dimension ranging from 59mm to 62mm and cross member 1 dimension ranging from 59mm to 67mm.
Figure 18. Response surface plot of total deformation vs cross member 1 and cross member 2 using OSFD
For other dimensions the deformation shows minimum value as represented by blue colored zone. The variation of deformation vs cross member 2 and cross member 3 using optimal space filling design indicates the deformation to be maximum for cross member 3 dimension ranging from 61mm to 63mm and cross member 2 dimension ranging from 59mm to 71mm. The variation of mass vs cross member 1 and cross member 2 using optimal space filling design is shown in Figure 19.
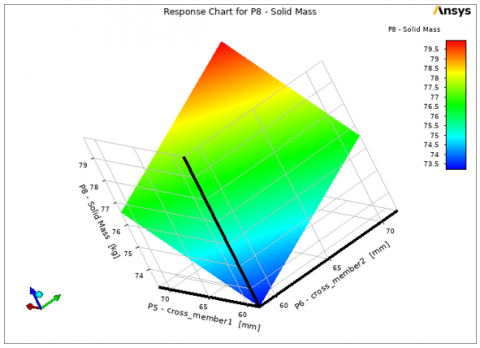
The plot shows maximum solid mass for cross member 1 dimension ranging from 69mm to 71mm and cross member 2 dimension ranging from 69mm and 71mm. The mass is minimum for cross member 1 and cross member 2 dimension ranging from 59mm to 62mm. Figure 20 represents the sensitivity plot using CCD scheme. For equivalent stress, the maximum sensitivity percentage is shown by cross member 1 (76.94%) and minimum sensitivity percentage is shown by cross member 3 (19.034%) which signifies that cross member 1 has maximum effect on equivalent stress and cross member 3 has minimum effect on equivalent stress.
Figure 19. Response surface plot of mass vs cross member 1 and cross member 2 using OSFD
Figure 20. Sensitivity plot using CCD scheme
For deformation, the maximum sensitivity percentage is shown by cross member 3 and minimum sensitivity percentage is shown by cross member 1. This signifies that cross member 3 has maximum effect on total deformation. For solid mass, all the three variables show the same sensitivity percentage which signifies that all the three optimization variables have the same effect on mass of chassis. The sensitivity plot using optimal space filling design is generated all the three output parameters i.e., equivalent stress, deformation, and solid mass in shown in Figure 21.
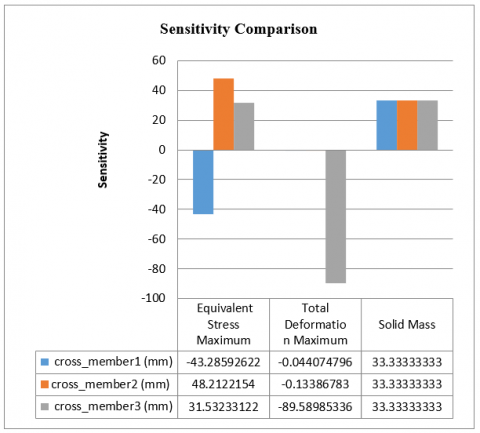
For equivalent stress, the cross member 1 shows maximum sensitivity percentage which signifies that cross member 2 has maximum effect on equivalent stress and cross member 3 has minimum effect on equivalent stress. For total deformation, the cross member 3 shows maximum sensitivity percentage which signifies that cross member 3 has maximum effect on total deformation. For solid mass, all the 3 optimization variables have same effect on mass of chassis.
Figure 21. Sensitivity plot using optimal space filling design
The new optimized design of chassis structure is presented using central composite design & optimal space fill optimization scheme. The response surface plots of different variables are generated which enabled to determine the range of values (of variables) for which equivalent stress deformation and mass is minimum or maximum. The weight of chassis is affected by width of cross members which is established by sensitivity plots. The minimum equivalent stress is observed with cross member 3 dimension of 71.5mm in CCD scheme and the equivalent stress increases linearly to reach maximum value at cross member 3 dimension of 71mm while using optimal space filling design. The mass of the chassis using the conventional steel is 214.64 Kg and it is reduced to 72.44 Kg (66.25%) in case of central composite design and 71.502 Kg (66.68%) in case of optimal space fill design optimization using Reinforced Aluminium-Matrix Composites Al6092/SiC/17.5p MMC. Therefore, optimal space fill design optimization is preferred in this case. The problem associated with conventional chassis materials is in achieving good combination of strength, stiffness, toughness, and density. These problems can be solved with the use of composite materials which are lighter and possess good strength.
Future Direction- The MMC’s can be a viable option for automotive components and the applicability of MMC for chassis structure are investigated in the current research using numerical techniques. The use of MMC’s for chassis structures aided to reduce the weight of chassis without compromise on its strength. In automotive industry, presently no work has been done in improving design of existing chassis using advanced optimization techniques & material which are used in this work. Further research can be conducted on chassis using other new materials & optimization techniques which could provide us better information on effect of other design variables.
Table 2. DOE values for central composite design
|
# Design Points of Design of Experiments # Central Composite Design |
||||||
|
# Name |
P5 - cross_member1 (mm) |
P6 - cross_member2 (mm) |
P7 - cross_member3 (mm) |
P3 - Equivalent Stress Maximum (MPa) |
P4 - Total Deformation Maximum (mm) |
P8 - Solid Mass (kg) |
|
1.0000 |
65.0000 |
65.0000 |
65.0000 |
3277.6133 |
694.8263 |
76.5600 |
|
2.0000 |
58.5000 |
65.0000 |
65.0000 |
3261.5814 |
695.6932 |
74.8739 |
|
3.0000 |
71.5000 |
65.0000 |
65.0000 |
3514.8697 |
694.1797 |
78.2461 |
|
4.0000 |
65.0000 |
58.5000 |
65.0000 |
3270.7381 |
695.4341 |
74.8739 |
|
5.0000 |
65.0000 |
71.5000 |
65.0000 |
3522.2472 |
693.9100 |
78.2461 |
|
6.0000 |
65.0000 |
65.0000 |
58.5000 |
3256.6430 |
687.8316 |
74.8739 |
|
7.0000 |
65.0000 |
65.0000 |
71.5000 |
3217.4281 |
681.4766 |
78.2461 |
|
8.0000 |
59.7153 |
59.7153 |
59.7153 |
3344.0960 |
683.9605 |
72.4474 |
|
9.0000 |
70.2847 |
59.7153 |
59.7153 |
3429.5405 |
683.5024 |
75.1891 |
|
10.0000 |
59.7153 |
70.2847 |
59.7153 |
3435.5861 |
683.0817 |
75.1891 |
|
11.0000 |
70.2847 |
70.2847 |
59.7153 |
3312.0125 |
682.2530 |
77.9309 |
|
12.0000 |
59.7153 |
59.7153 |
70.2847 |
3461.2252 |
684.3118 |
75.1891 |
|
13.0000 |
70.2847 |
59.7153 |
70.2847 |
3228.5146 |
683.4313 |
77.9309 |
|
14.0000 |
59.7153 |
70.2847 |
70.2847 |
3291.4973 |
683.3310 |
77.9309 |
|
15.0000 |
70.2847 |
70.2847 |
70.2847 |
3458.8776 |
682.4539 |
80.6726 |
Table 3. DOE for optimal space-filling design scheme
|
# Design Points of Design of Experiments: # Optimal Space-Filling Design |
||||||
|
# Name |
P5 - cross_member1 (mm) |
P6 - cross_member2 (mm) |
P7 - cross_member3 (mm) |
P3 - Equivalent Stress Maximum (MPa) |
P4 - Total Deformation Maximum (mm) |
P8 - Solid Mass (kg) |
|
1.000 |
69.333 |
68.467 |
60.667 |
3489.332 |
690.154 |
77.459 |
|
2.000 |
63.267 |
69.333 |
59.800 |
3235.038 |
683.027 |
75.886 |
|
3.000 |
59.800 |
66.733 |
68.467 |
3351.487 |
688.864 |
76.560 |
|
4.000 |
68.467 |
59.800 |
67.600 |
3493.439 |
690.597 |
76.785 |
|
5.000 |
58.933 |
60.667 |
65.867 |
3501.736 |
694.025 |
74.087 |
|
6.000 |
71.067 |
63.267 |
63.267 |
3347.148 |
697.720 |
77.234 |
|
7.000 |
66.733 |
62.400 |
58.933 |
3246.612 |
685.046 |
74.761 |
|
8.000 |
70.200 |
65.867 |
69.333 |
3319.292 |
686.102 |
79.258 |
|
9.000 |
65.867 |
64.133 |
64.133 |
3283.425 |
696.444 |
76.335 |
|
10.000 |
65.000 |
67.600 |
71.067 |
3464.306 |
682.233 |
78.808 |
|
11.000 |
61.533 |
71.067 |
65.000 |
3474.065 |
694.224 |
77.234 |
|
12.000 |
60.667 |
65.000 |
61.533 |
3502.205 |
702.807 |
74.537 |
|
13.000 |
64.133 |
58.933 |
62.400 |
3308.882 |
700.824 |
74.087 |
|
14.000 |
67.600 |
70.200 |
66.733 |
3471.700 |
690.697 |
79.033 |
|
15.000 |
62.400 |
61.533 |
70.200 |
3233.554 |
685.076 |
76.335 |
Table 4. Max-min values for optimal space-filling design scheme
|
|
A |
B |
C |
|
1 |
Name |
Calculated Minimum |
Calculated Maximum |
|
2 |
P3- - Equivalent Stress Maximum (MPa) |
3207.3 |
3531.8 |
|
3 |
P4- Total Deformation Maximum (mm) |
680.06 |
696.36 |
|
4 |
P8- Solid Mass (kg) |
71.502 |
81.618 |
[1] Vijayan, S.N., Sendhilkumar, S., Kiran Babu, K.M. (2015). Design and analysis of automotive chassis considering cross design and analysis of automotive chassis considering cross-section and material. International Journal of Current Research, 7(5): 15697-15701.
[2] Cavazzuti, M., Splendi, L. (2011). Structural optimization of automotive chassis: theory, set up, design. Italy: Universita Degli Studi Di Modena E Reggio Emila.
[3] Chiandussi, G., Gaviglio, I., Ibba, A. (2004). Topology optimisation of an automotive component without final volume constraint specification. Advances in Engineering Software, 35(10-11): 609-617. https://doi.org/10.1016/J.Advengsoft.2003.07.002
[4] Pedersen, C. (2004). Crashworthiness design of transient frame structures using topology optimization. Computer Methods in Applied Mechanics and Engineering, 193(6-8): 653-678. https://doi.org/10.1016/j.cma.2003.11.001
[5] Letsatsi, M.T., Agarwal, A., Pitso, I. (2021). The finite element evaluation of support bracket using the application of topological optimization. Journal of Engineering Research, 1-13. https://doi.org/10.36909/Jer.Icippsd.15505
[6] Duddeck, F. (2008). Multidisciplinary optimization of car bodies. Structural and Multidisciplinary Optimization, 35(4): 375-389. https://doi.org/10.1007/S00158-007-0130-6
[7] Reddy, C.M.M. (2014). Modeling and analysis of container chassis using Fem. Iosr Journal of Engineering, 4(1): 34-37. https://doi.org/10.9790/3021-04153437
[8] Swami, K.I., Tuljapure, S.B. (2014). Analysis of ladder chassis of Eicher 20.16 using fem. Iosr Journal of Applied Geology and Geophysics, 2(1): 6-13. https://doi.org//10.9790/0990-02110613
[9] Godse, S., Patel, D. (2013). Static load analysis of tata ace ex chassis and stress optimisation using reinforcement technique. International Journal of Engineering Trends and Technology, 4(7): 55-58.
[10] Sharma, A., Kumar, P., Jabbar, A., Khan, M.M. (2014). Structural analysis of a heavy vehicle chassis made of different alloys by different cross sections. International Journal of Engineering Research & Technology (IJERT), 3(6): 1778-1785.
[11] Nalawade, K.G., Sabu, A., P, B. (2014). Dynamic (vibrational) and static structural analysis of ladder frame. International Journal of Engineering Trends and Technology, 11(2): 93-98. https://doi.org/10.14445/22315381/ijett-v11p218
[12] Singh, A., Soni, V., Singh, A. (2014). Structural analysis of ladder chassis for higher strength. International Journal of Emerging Technology and Advanced Engineering, 4(2): 254-259.
[13] Anurag, Singh, A., Tripathi, A., Tiwari, A., Upadhyay, N., Lal, S. (2016). Design and analysis of chassis frame. International Journal of Research and Engineering, 3(4): 31-34.
[14] Agarwal, A., Molwane, O.B., Letsatsi, M.T. (2021). Experimental investigation & analysis of heat transfer characteristics in automotive mmc disc brake under steady state and dynamic conditions. Journal of Engineering Research. https://doi.org/10.36909/jer.icippsd.15527
[15] Kainer, K.U. (2006). Metal Matrix Composites: Custom-Made Materials for Automotive and Aerospace Engineering. Wiley-vch verlag gmbh.
[16] Rohatgi, P.K., Xiang, C., Gupta, N. (2018). 4.11 aqueous corrosion of metal matrix composites. Comprehensive Composite Materials II, 4: 287-312. https://doi.org/10.1016/b978-0-12-803581-8.09985-9
[17] Agarwal, A., Mthembu, L. (2021). Numerical modelling and multi objective optimization analysis of heavy vehicle chassis. Processes, 9(11): 2028. https://doi.org/10.3390/pr9112028
[18] Plasun, R. (n.d.). Central composite designs. https://www.iue.tuwien.ac.at/phd/plasun/node32.html, accessed on Jan. 10, 2020.
[19] Overview of space-filling designs. (2018). https://www.datadvance.net/product/pseven-core/generic-tool-for-design-of-experiments/, accessed on Jan. 11, 2020.
[20] Agarwal, A., Molwane, O.B., Marumo, R. (2020). Design Optimization of Knuckle Stub Using Response Surface Optimization. In: Praveen Kumar A., Dirgantara T., Krishna P.V. (eds) Advances in Lightweight Materials and Structures. Springer Proceedings in Materials, vol 8. Springer, Singapore. https://doi.org/10.1007/978-981-15-7827-4_15
[21] Song, J.B., Song, R., Xiong, Z. (2018). Acoustic radiation features and structural-acoustic sensitivity of channel beam. Traitement du Signal, 35(1): 35-45. https://doi.org/10.3166/TS.35.35-45
[22] Tidke, N., Burande, D.H. (2017). Analysis of HCV chassis using FEA. International Engineering Research Journal, 1-5.
[23] De Oliveira, F.C.G., Borges, J.A.F. (2008). Design and optimization of a space frame chassis. SAE Technical Paper Series. https://doi.org/10.4271/2008-36-0253
[24] Rawal, S.P. (2001). Metal-matrix composites for space applications. JOM, 53(4): 14-17. https://doi.org/10.1007/s11837-001-0139-z
[25] Chennakesava Reddy, A. (2018). Metal matrix composites - their properties and applications. https://jntuhceh.ac.in/web/tutorials/faculty/1674_composites.pdf.
[26] Ansys library file. (n.d.). https://www.ansys.com/academic/, accessed on Aug 15, 2021.
[27] Wang, W., Xu, R.Q., Hao, Y.X., Wang, Q., Yu, L.L., Che, Q.Y., Cai, Q.Y., Wang, K.S., Ma, Z.Y. (2018). Corrosion fatigue behavior of friction stir processed interstitial free steel. Journal of Materials Science & Technology, 34(1): 148-156. https://doi.org/10.1016/j.jmst.2017.11.013
[28] Marumo, R., Molwane, O.B., Agarwal, A. (2020). Numerical Analysis of Rear Spoilers in Improving Vehicle Traction. In: Praveen Kumar A., Dirgantara T., Krishna P.V. (eds) Advances in Lightweight Materials and Structures. Springer Proceedings in Materials, vol 8. Springer, Singapore. https://doi.org/10.1007/978-981-15-7827-4_16
[29] Agarwal, A., Mthembu, L. (2021). Weight optimization of heavy-duty truck chassis by optimal space fill design using light weight Graphite Al GA 7-230 MMC. Materials Today: Proceedings. http://dx.doi.org/j.matpr.2021.11.053