Gong Chen* | Lv Zong | You Zuo | JunJie Pan | XueJian Cai | Feng Wu | Dongdong Hou | Yan Wang
© 2021 IIETA. This article is published by IIETA and is licensed under the CC BY 4.0 license (http://creativecommons.org/licenses/by/4.0/).
OPEN ACCESS
Technological parameters of magnetron sputtering have great influence on the transmittance and thickness of titanium dioxide coating. Traditional technology for single factor method ignores the parameters correlation. Novel grey relational quantitative model involves the construction of data absolute position difference and the difference of changing rate. Combined with sputtering temperature, background vacuum pressure, sputtering pressure and sputtering voltage, experiments were carried out. The optimal parameters were obtained from experiment. The transmittance and thickness of titanium dioxide films with different data were analyzed and calculated. The experimental study shows that compared with the traditional grey relational model, the detection accuracy of our proposed model improves 5-10%, and the model is more suitable for transmittance detection.
magnetron sputtering, titanium dioxide coating, transmittance, thickness, improved grey relational quantitative model
With the increasing demand of domestic optical film products, the requirements for high refractive index, wear resistance, and corrosion resistance performance are higher and higher. Titanium dioxide has a great influence on the coloring and spectral properties of glass [1]. It has high chemical and thermal stability, excellent photocatalytic activity [2-4]. So it is widely used in the medicine, solar cell electrode and self-cleaning [5, 6]. Magnetron sputtering is usually used for titanium dioxide. This method has the advantages of high sputtering rate, high bonding strength, easy control of composition and good repeatability [7-11].
During magnetron sputtering, technological parameter including the background vacuum pressure, sputtering pressure, oxygen argon nitrogen ratio, sputtering voltage, sputtering current, sputtering power, sputtering temperature, deposition time and power type have great influence on the properties of titanium dioxide films. To find the correlation of technological parameters, it is necessary to make multi-attribute objective decision, optimize process conditions and select the optimal process. Li [12] studied the effects of magnetron sputtering parameters on the film thickness, adhesion and surface roughness by single factor orthogonal test. The effects of magnetron sputtering parameters on the morphology, structure and properties of nickel plated samples were studied by orthogonal test. Most papers used single factor test method to study the effect of parameters on the microstructure and properties of titanium dioxide films [13-17].
During the process parameters of titanium dioxide coating, the gas flow ratio, power, deposition time and pre-sputtering time in the cavity are constant. The main parameters affecting the transmittance and film thickness are the voltage, background vacuum, sputtering temperature and air pressure. If the voltage increases, the impedance of the plasma in the circuit and the current will change in the gas. The changing current can produce more ions, and the sputtering rate can be controlled by the ion colliding with the target. The increase of air pressure can improve the ionization rate, but it shorts the average free path of sputtered atoms and reduces the sputtering rate. However, the increase of temperature can not only improve the ionization rate, but also improve the sputtering rate. Therefore, the sputtering temperature has the greatest influence on the coating thickness and transmittance. The background vacuum pressure affects the oxygen content on the film surface and the purity of titanium dioxide coating, but it has little effect on the coating thickness and transmittance. Therefore, during production process of titanium dioxide vacuum coating, the process parameters such as temperature, voltage, air pressure and background vacuum will affect the film thickness and transmittance.
About the traditional grey relational analysis, some researchers analyzed the theories of absolute relational degree, grey generalized absolute relational degree, T-type relational degree and grey slope relational degree [18]. Recently researchers combined grey relational analysis with entropy weight method and the separation coefficient weighting method to improve the weight value to evaluate different objects [19-24]. Liu et al. [25] used the improved grey slope relational analysis method to optimize the reliability model of hydraulic system. Yin et al. [18] established a computation model of grey incidence degree-Evolvement Model. In sum most papers focus on improving the weight of traditional grey relational analysis in different degrees. However, these studies do not provide much attention to practical application and analysis.
According to optical titanium dioxide coating, the aim of this paper is to provide methods to construct grey relational quantitative model. Novel model of dynamic parameters is established and applied to evaluate the influence of sputtering temperature, background vacuum pressure, sputtering pressure and sputtering voltage on the transmittance and thickness of titanium dioxide thin films. The results are compared with traditional grey relational model. The data-frame-moving method is used to make the correlation coefficients of the two models continuous. The accuracy of the improved model is verified based on the correlation coefficient.
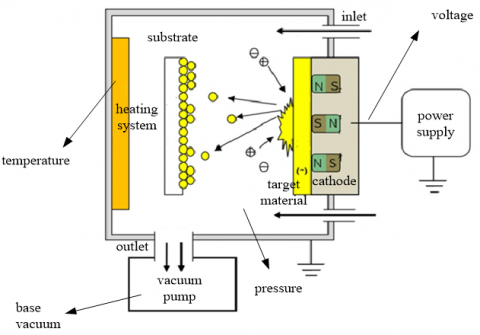
Magnetron sputtering titanium dioxide vacuum coating is to make target material from titanium deposited and fix target material on the magnetron cathode. Coating system comprises following steps. The substrate is placed on the anode directly opposite to the target surface with constant distance [26]. When the vacuum pressure reaches 0.0031-0.004 Pascal, the system is filled with 200ml/min Argon and 20ml/min Oxygen. At the same time, 0.7-0.75Pascal pressure range, 295-304V DC voltage, 6.6-6.8A current and 2000w constant power is adjusted between the cathode and anode.
The positive ions produced by the discharge fly to the cathode in the electric field. Ions collide with Argon atoms and ionize to produce Argon particles and new electrons. Argon particles fly to the cathode target and bombard the target surface with high energy to make the target sputter. The sputtered atoms escape from the target surface and deposit on the surface of the substrate to form titanium dioxide film. The sputtering temperature in the sputtering chamber requires 34.8-35.2℃, the deposition time and the pre-sputtering time are done with 120 and 38 seconds separately.
Figure 1 shows the working principle of titanium dioxide thin film by magnetron sputtering.
Figure 1. Schematic diagram of magnetron sputtering vacuum coating machine
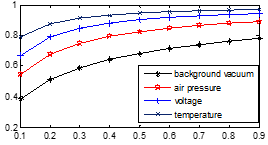
Select experiment data by grey relational analysis. Data is consistent with the empirical results. Taking the background vacuum, air pressure, voltage and temperature obtained by orthogonal experiment as sub-factor sequence, taking transmittance and film thickness as the parent-factor sequence. Change the resolution coefficient in turn, the grey relational degree between sub-factor sequence and parent-factor sequence is calculated.
(a)
(b)
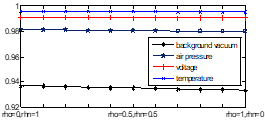
Figure 2. Comparison of gray relational degree (a. transmittance b. film thickness)
Adding temperature can increase the ionization rate and the sputtering rate. So, the sputtering temperature has the greatest influence on the film thickness and transmittance. Background vacuum pressure affects oxygen content of the film surface and the purity of titanium dioxide coating. It has little effect on the film thickness and transmittance. From experience and analysis, the influence factors is sorted by: temperature>voltage>air pressure>background vacuum.
In Figure 2, the abscissa is the resolution coefficient and the ordinate is the grey correlation degree, no matter how the resolution coefficient changes, the order of correlation between transmittance and film thickness is always constant, namely temperature>voltage>air pressure>background vacuum. With the increase of resolution coefficient, the correlation degree of each factor is also increasing in a positive correlations. When the resolution coefficient varies by 0.1 to 0.3, correlation degree changes obviously. When it is varying by 0.4 to 0.9, correlation degree tends to be stable. When the resolution coefficient is 0.5, not only the correlation degree is stable, but also the discrimination interval of process parameters is significant. In conclusion, the resolution coefficient is 0.5.
In order to make the formula in reference [26] representative, novel grey relational quantitative model coefficient is given by:
$\delta ({{x}_{0}}(k),{{x}_{i}}(k))=\frac{\begin{align} & 1+\xi \underset{i}{\mathop{\max }}\,\underset{k}{\mathop{\max }}\,\left| \Delta {{x}_{0i}}(k) \right|+ \\ & {{\eta }_{1}}\underset{i}{\mathop{\max }}\,\underset{k}{\mathop{\max }}\,\left| \Delta x_{_{0i}}^{(1)}(k) \right|+\cdots \\ & +{{\eta }_{k-2}}\underset{i}{\mathop{\max }}\,\underset{k}{\mathop{\max }}\,\left| \Delta x_{_{0i}}^{(k-2)}(k) \right| \\\end{align}}{\begin{align} & 1+{{\lambda }_{1}}\left| \Delta {{x}_{0i}}(k) \right|+{{\lambda }_{2}}\left| \Delta x_{_{0i}}^{(1)}(k) \right|+\cdots \\ & +{{\lambda }_{k-1}}\left| \Delta x_{_{0i}}^{(k-2)}(k) \right| \\ & +\xi \underset{i}{\mathop{\max }}\,\underset{k}{\mathop{\max }}\,\left| \Delta {{x}_{0i}}(k) \right| \\ & +{{\eta }_{1}}\underset{i}{\mathop{\max }}\,\underset{k}{\mathop{\max }}\,\left| \Delta x_{_{0i}}^{(1)}(k) \right|+\cdots \\ & +{{\eta }_{k-2}}\underset{i}{\mathop{\max }}\,\underset{k}{\mathop{\max }}\,\left| \Delta x_{_{0i}}^{(k-2)}(k) \right| \\\end{align}}$ (1)
where, $\lambda_{1}, \lambda_{2}, \cdots \lambda_{\mathrm{k}-1}>0, \lambda_{1}+\lambda_{2}+\cdots+\lambda_{\mathrm{k}-1}=1, \lambda_{1}$ is the weight of absolute position difference, $\lambda_{2}, \cdots \lambda_{\mathrm{k}-1}$ are the weights of the difference in the rate of change. $\xi$ is absolute position difference identification coefficient, $\eta_{1}, \cdots \eta_{k-2}$ are the identification coefficients of the difference between the first and $k$-2 order rate of change, $\xi=0.5 .$
$\Delta x_{o i}(k)=x_{0}(k)-x_{i}(k)$ is the absolute position difference of sequence $x_{0}(k)$ and $x_{i}(k)$ at point $k \cdot \Delta x_{\mathrm{oi}}^{(1)}(k)=$ $x_{0}^{(1)}(k)-x_{i}^{(1)}(k)$ is the change rate difference of the first order sequence. $\Delta x_{o i}^{(k-2)}(k)=x_{0}^{(k-2)}(k)-x_{i}^{(k-2)}(k)$ is the change rate difference of $k-2$ order sequence. $x_{i}^{(1)}(k)=$ $x_{i}(k)-x_{i}(k-1)$ is the rate of change of the first order sequence, $x_{i}^{(k-2)}(k)=x_{i}^{(k-3)}(k)-x_{i}^{(k-3)}(k-1)$ is the rate of change of $k-2$ order sequence $i=0,1,2, \cdots, n, k=$ $2,3, \cdots, m$.
Both sequences curves are similar when $\left|\Delta x_{o i}(k)\right|$ is smaller at this moment. The direction of both series curves is more similar when $\left|x_{i}^{(1)}(k)-x_{0}^{(1)}(k)\right|$ is smaller. The change rate of the development speed is more similar when $\left|x_{i}^{(2)}(k)-x_{0}^{(2)}(k)\right|$ is smaller.
The formula for grey relational degree has the form:
$\gamma_{i}=\frac{1}{n} \sum_{\hat{k}=1}^{n} \delta\left(x_{0}(k), x_{i}(k)\right)$ (2)
The above formulas are the novel grey relational quantitative model. The model can be proved to meet the grey relational degree of standardization, integrity, even pair symmetry and proximity.
① Standardization:
Obviously, $0<\delta\left(x_{0}(k), x_{i}(k)\right) \leq 1$, for $\lambda_{1}, \lambda_{2}, \cdots \lambda_{\mathrm{k}-1}>0$,
$\delta\left(x_{0}(k), x_{i}(k)\right)=1 \Leftrightarrow\left|\Delta x_{o i}^{(k-2)}(k)\right|=0, k=2,3, \cdots, m$ $\Leftrightarrow\left|\Delta x_{o i}^{(k-2)}(k)\right|=\left|x_{0}^{(k-2)}(k)-x_{1}^{(k-2)}(k)\right|=0, \quad k=$ $2,3, \cdots, m$ $\Leftrightarrow x_{0}^{(k-2)}(k)-x_{i}^{(k-2)}(k)=\cdots=x_{0}(k)-$$x_{i}(k)=0$
$\Leftrightarrow x_{0}(k)=x_{i}(k), \quad k=2,3, \cdots, m, \quad$ namely $\quad 0<$ $\delta\left(x_{0}(k), x_{i}(k)\right) \leq 1$ and $\delta\left(x_{0}(k), x_{i}(k)\right)=1 \Leftrightarrow X_{i}=X_{0}$ $X_{i}=\left\{x_{i}(k), k=2,3 \cdots m, i=1,2 \cdots n\right\}, X_{0}=\left\{x_{0}(k), k=\right.$ $2, \cdots m\}$. it means sequences $X_{i}$ and $X_{0}$ are parallel.
② Integrity
If $X_{i}^{*}=\left\{x_{i}(k), k=2, \cdots m, i=0,2 \cdots n\right\} \quad, \quad X_{0}^{*}=$$\left\{x_{1}(k), k=2, \cdots m\right\}$
Then, $\delta\left(x_{0}(k), x_{i}(k)\right) \neq \delta\left(x_{0}^{*}(k), x_{0}^{*}(k)\right)$
③ Even pair symmetry
Obviously, $\quad \delta\left(x_{0}(k), x_{i}(k)\right)=\delta\left(x_{i}(k), x_{0}(k)\right), \quad i=$ $1,2 \cdots n$
④ Proximity
When denominator of novel model $\left|\Delta x_{o i}(k)\right|=\mid x_{0}(k)-$ $x_{i}(k) \mid$ decreases, $\delta\left(x_{0}(k), x_{i}(k)\right)$ becomes lager. So novel model can be called novel grey relational quantitative model.
In order to simplify the calculation, the model is defined as:
$\delta *({{x}_{0}}(k),{{x}_{i}}(k))=\frac{\begin{align} & 1+\xi \underset{i}{\mathop{\max }}\,\underset{k}{\mathop{\max }}\,\left| \Delta {{x}_{0i}}(k) \right| \\ & +{{\eta }_{1}}\underset{i}{\mathop{\max }}\,\underset{k}{\mathop{\max }}\,\left| \Delta x_{_{0i}}^{(1)}(k) \right| \\\end{align}}{\begin{align} & 1+{{\lambda }_{1}}\left| \Delta {{x}_{0i}}(k) \right|+{{\lambda }_{2}}\left| \Delta x_{_{0i}}^{(1)}(k) \right| \\ & +\xi \underset{i}{\mathop{\max }}\,\underset{k}{\mathop{\max }}\,\left| \Delta {{x}_{0i}}(k) \right| \\ & +{{\eta }_{1}}\underset{i}{\mathop{\max }}\,\underset{k}{\mathop{\max }}\,\left| \Delta x_{_{0i}}^{(1)}(k) \right| \\\end{align}}$ (3)
$\Delta x_{o i}(k)=x_{0}(k)-x_{i}(k) x_{i}^{(1)}(k)=x_{i}(k)-x_{i}(k-1)$
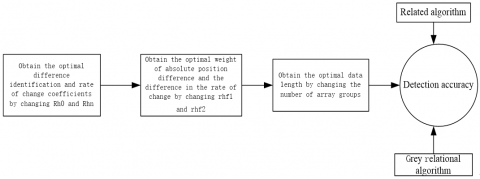
The flow chart of the experiment is shown in Figure 3. The purpose is to optimize the selection of parameters, quantify the experimental data and simplify the steps.
5.1 Obtain optimal model parameters by changing ξ and η1
ξ increases from 0 to 1, η1 decreases from 1 to 0. λ1=0.5, λ2=0.5.
x1(k)={background vacuum1, background vacuum2, .....background vacuumN}; x2(k)={pressure1, .....pressureN}; x3(k)={voltage1, .....voltageN}; x4(k)={temperature1, .....temperatureN}; x01(k)={transmittance1, .....transmittanceN}; x02(k)={film thickness1, .....film thicknessN}.
Figure 3. Flow chart of the experiment
(a)
(b)
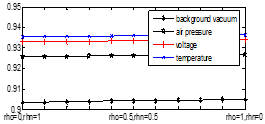
Figure 4. Novel grey relational degree
(a. transmittance b. film thickness, rho stands for ξ, rho stands for η1)
In Figure 4, the novel grey relational rankings of transmittance and film thickness are consistent with the traditional algorithm. The change of novel grey relational algorithm maintains constant, and it is different from the traditional one. The grey relational degree value between process parameters and transmittance improvement is larger than those of film thickness It indicates that the influence of process parameters on film thickness is lower than that of transmittance. For example, when adjusting the temperature, the influence on the film transmittance is greater than the film thickness. After some calculations we obtain that ξ=0.5, η1=0.5.
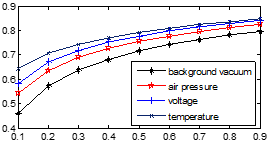
5.2 Obtain the optimal model parameters by changing λ1, λ2
To obtain the optimal model parameters λ1, λ2, 6, 10, and 14 groups of data are selected randomly by changing λ1 and λ2, respectively, the results are as follows:
(a)
(b)
(c)
Figure 5. Grey relational degree of transmittance and film thickness for different groups (a.6 groups b.10 groups c.14 groups)
In Figure 5, as λ1 and λ2 are changing continuously, most orders are consistent with the original algorithm: temperature>voltage>pressure>background vacuum. Whether groups selected are 6 or 14, the order is keeping change. So 0.2≤λ1≤0.5, 0.5≤λ2≤0.8 are the perfect parameters. Further analysis shows that the difference between voltage and pressure is also expanding with the increase of the value. So λ1=0.4, λ2=0.6 is selected to narrow the margin of error.
5.3 Comparison results
60, 80, 100, 120, 140, 160 groups of data are randomly selected from the database, and each group is equally divided into 10 groups. Correlation algorithm, traditional grey relational algorithm (ξ=0.5) and novel grey relational algorithm (ξ=0.5, η1=0.5, λ1=0.4, λ2=0.6) are compared.
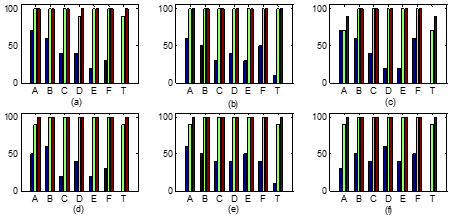
‘A’, ‘B’, ‘C’, ‘D’, ‘E’ and ‘F’ represent ‘a > b’, ‘a > c’, ‘a > d’, ‘b > c’, ‘b > d’ and ‘c > d ’respectively. ‘a’ stands for sputtering temperature, ‘b’ stands for voltage, ‘c’ stands for pressure, ‘d’ stands for background vacuum. The first level detection accuracy is defined as the ratio of correct quantity to total quantity in the case of ‘A’ to ‘F’. The second level detection accuracy is defined as the ratio of correct quantity to total quantity in the case of ‘a > b > c > d’ (indicated by ‘T’). Figures 6-7 shows the comparison of the accuracy of transmittance and film thickness detection.
Figure 6. Comparison of film transmittance detection accuracy (a. 600 groups b. 80 groups c. 100 groups d. 120 groups e. 140 groups f. 160 groups)
Figure 7. Comparison of film thickness detection accuracy (a. 600 groups b. 80 groups c. 100 groups d. 120 groups e. 140 groups f. 160 groups)
The evaluation of technological parameters is based on the secondary accuracy. In order to explore the relationship among different technological parameters, this paper also counts the first level accuracy. Compared with the traditional algorithm, the larger the amount of data, the higher the accuracy of secondary detection of film thickness, but it only reaches about 55%. When the data reaches 160 groups, the improved algorithm is lower than the traditional one. It shows that 160 groups of data have redundancy. For the transmission rate, when the data reach 60 groups, the primary and secondary detection accuracy of the improved algorithm reach 98%. When the number of groups increases, the detection accuracy remains basically constant, and the traditional algorithms are lower than the improved one.
The experimental results show that compared with the correlation algorithm, the novel grey relational algorithm and the traditional grey relational algorithm have higher first and second level detection accuracy. The novel grey relational algorithm is superior to the traditional grey relational algorithm in the accuracy of film transmittance detection and it has little correlation with the number of groups, generally, 60 groups can meet the requirements (The second level accuracy of the grey relational reaches 90%, and the novel grey relational reaches 100%). The accuracy of the novel grey relational algorithm is better than that of the traditional one, but the overall detection accuracy is only 60%.
In this paper, multi-factors technological parameter analysis method is used to observe the change of coating performance which is more realistic than the experimental data. The novel grey relational algorithm involves the absolute position difference and the change rate difference from data. Detection accuracy is better than the traditional gray relational and correlation algorithm. The second level detection accuracy is 10% higher than the traditional grey relational algorithm. Although the novel algorithm of titanium dioxide coating thickness also has advantages, the overall detection accuracy of the three algorithms are low. It is necessary to find a more suitable algorithm to study the influence of technological parameters about film thickness.
The paper is supported by Jiangsu special Funds for Transformation of Scientific and Technological Achievements (Grant No.: BA2019020032), Key Laboratory of Nondestructive Testing (Nanchang Hangkong University), Ministry of Education (Grant No.: EW201980089), Excellent Science and Technology Innovation Team of Colleges and Universities in Jiangsu Province.
[1] Hu, X.P. Lin, C.G., Rong, J.H., Huo, J.L., Xu, H.F., Xu, G.Y. (2017). Coloring mechanism of environmental dense flint glass SiO2-TiO2-Nb2O5. China Science and Technology Papers, 12(22): 2627-2631.
[2] Shen, G.X., Chen, Y.C., Lin, C.J. (2005). Corrosion protection of 316 L stainless steel by a TiO2 nanoparticle coating prepared by sol–gel method. Thin Solid Films, 489(1-2): 130-136. https://doi.org/10.1016/j.tsf.2005.05.016
[3] Liu, T. (2011). Fabrication of coatings on aluminum substrates with anodized pretreatment and research on properties of corrosion and biofilm protection. Ocean University of China.
[4] Twu, M.J., Chiou, A.H., Hu, C.C., Hsu, C.Y., Kuo, C.G. (2015). Properties of TiO2 films deposited on flexible substrates using direct current magnetron sputtering and using high power impulse magnetron sputtering. Polymer Degradation and Stability, 117: 1-7. https://doi.org/10.1016/j.polymdegradstab.2015.03.010
[5] Li, P. (2013). Study on the microstructure and properties of Ti and modified TiO2 films by magnetron sputtering. Nanjing University of Science and Technology, https://doi.org/10.7666/d.Y2277129
[6] Wang, H., Li, Y., Ba, X., Huang, L., Yu, Y. (2015). TiO2 thin films with rutile phase prepared by DC magnetron co-sputtering at room temperature: Effect of Cu incorporation. Applied Surface Science, 345: 49-56. https://doi.org/10.1016/j.apsusc.2015.03.106
[7] Wang, B., Wei, S.C., Wang, Y.J., Guo, L., Liang, Y., Pan, F.S., Xu, B.S. (2018). Titanium-oxide thin films prepared by magnetron sputtering method. Surface Technology, 47(8): 257-264. https://doi.org/10.16490/j.cnki.issn.1001-3660.2018.08.035
[8] Liu, Y., Hu, Y.L. (2013). TiN/TiO2 periodic films prepared by magnetron sputtering. China Surface Engineering, 36(2): 56-60.
[9] Wang, F. (2011). The experiment research of hydrophilicity for TiO2 film prepared by magnetron sputtering. Northeast University.
[10] Peng, J. (2014). Study on the properties of magnetron sputtering TiCN film and its composite film on AZ31 magnesium alloy. Chongqing University.
[11] Chen, F. (2012). Fabrication and properties of TiO2 thin filmsby DC facing-target magnetron sputtering. Tianjin University.
[12] Li, S. (2018). Preparation and properties of magnetron sputtered AIN film on AZ91 magnesium alloy. Inner Mongol University of Technology.
[13] Hong, B. (2016). Research on process, microstructure and properties of plating nickel film on molybdenum disc by magnetron sputtering. Wuhan University of Science and Technology.
[14] Reddy, Y.A.K., Shin, Y.B., Kang, I.K., Lee, H.C. (2016). Substrate temperature dependent bolometric properties of TiO2− x films for infrared image sensor applications. Ceramics International, 42(15): 17123-17127. https://doi.org/10.1016/j.ceramint.2016.07.225
[15] Sério, S., Jorge, M.M., Maneira, M.J.P., Nunes, Y. (2011). Influence of O2 partial pressure on the growth of nanostructured anatase phase TiO2 thin films prepared by DC reactive magnetron sputtering. Materials Chemistry and Physics, 126(1-2): 73-81. https://doi.org/10.1016/j.matchemphys.2010.12.008
[16] Pérez, J.B., Courel, M., Pal, M., Delgado, F.P., Mathews, N.R. (2017). Effect of ytterbium doping concentration on structural, optical and photocatalytic properties of TiO2 thin films. Ceramics International, 43(17): 15777-15784. https://doi.org/10.1016/j.ceramint.2017.08.141
[17] Nezar, S., Saoula, N., Sali, S., Faiz, M., Mekki, M., Laoufi, N.A., Tabet, N. (2017). Properties of TiO2 thin films deposited by rf reactive magnetron sputtering on biased substrates. Applied Surface Science, 395: 172-179. https://doi.org/10.1016/j.apsusc.2016.08.125
[18] Yin, H.Z., Liu, B., Zhang, H., Zhang, R. (2006). A new computation model of incidence degree met four axioms of grey incidence. HeNan Science, 24(2): 162-165.
[19] Yang, G., Wang, S. (2017). The improved grey relational analysis method and its application. Journal of Shenyang Normal University (Natural Science Edition), 35(2): 166-169.
[20] Tang, H. (2020). Application of improved grey relational analysis in groundwater evaluation, Northeast Water Resources and Hydropower, 38(8): 51-53, 72. https://doi.org/10.14124/j.cnki.dbslsd22-1097.2020.08.021
[21] Li, M.W., He, M.H., Hua, L.F., Tang, Y.W. (2020). Abnormal signal detection method based on improved grey relation. Journal of Air Force Early Warning Academy, 34(5): 330-334, 339.
[22] Lin, Z.H., Shi, P., Zhong, P.A., Zhai, S.M., Ji, X.M., Cui, Y.P. (2020). Dynamic similar flood recognition and forecasting method based on improved gray correlation analysis. Hydropower Energy Science, 38(1): 48-51.
[23] Zhang, P., Wang, Y.Q., Jiang, N., Ge, L.J., Ding, Y., Tang, P. (2018). Screening method for evaluation indicators of distribution network control level based on improved grey correlation degree. Journal of Electric Power System and Automation, 30(11): 64-69. https://doi.org/10.19635/j.cnki.csu-epsa.000087
[24] Li, H.B., Sun, Z.C., Zhou, J.J., Zhai, Q.Z. (2019). Wear condition evaluation method of TBM hob based on acoustic emission and improved grey correlation analysis. China Railway Science, 40(3): 65-71.
[25] Liu, Y.J., Yang, Y., Zhang, Y.S. (2018). Reliability model selection method of hydraulic system based on improved grey correlation. Machine Tool & Hydraulics, 46(1): 168-172.
[26] Olaf, S. (2017). Theory and Practice of Optical Thin Film Materials, National Defense Industry, Bei Jing.