
Buket Toptaş
© 2025 The author. This article is published by IIETA and is licensed under the CC BY 4.0 license (http://creativecommons.org/licenses/by/4.0/).
OPEN ACCESS
Early and accurate detection of plant diseases is critical for global food security and plays a decisive role in reducing agricultural production losses. Although deep learning-based image classification methods have achieved significant success in this field, fixed activation functions in conventional convolutional neural networks exhibit limitations in learning complex patterns. This study proposes a hybrid architecture that employs Kolmogorov-Arnold Networks as classifier heads in convolutional neural networks. In the proposed approach, pre-trained ResNet-18 and EfficientNet-B0 backbones are utilized for feature extraction, while Efficient KAN and Fast KAN structures with learnable activation functions are integrated into the classification layer. Using a cotton leaf disease dataset containing five disease classes, a transfer learning strategy was implemented by freezing the backbone weights, and each configuration was replicated with three different random seeds. Model performance was evaluated using accuracy, precision, recall, and F1-score metrics, while computational efficiency was analyzed through the number of trainable parameters and inference time. The combination of EfficientNet-B0 backbone with Fast KAN classifier exhibited the highest performance, achieving 93.71 ± 0.27% test accuracy and 92.33 ± 0.28% F1-score. These results, obtained on a modest, single-site dataset (1,373 images), should be interpreted as an initial reference point rather than a generalizable benchmark. According to the findings, this study provides a technical foundation for researchers optimizing KAN algorithms for agricultural applications.
Kolmogorov-Arnold Networks, plant disease classification, convolutional neural networks, cotton leaf disease
Climate variability and plant diseases are critical factors that adversely affect global agricultural productivity and increase uncertainties regarding food security [1]. Plant diseases constitute one of the primary factors constraining crop development. The proliferation of these diseases leads to significant annual crop yield losses worldwide, posing a serious threat to global food security. According to data from the Food and Agriculture Organization of the United Nations, plant diseases and pest infestations cause considerable losses in global agricultural production and are considered among the principal issues threatening global food security [2]. In this context, early and accurate detection of plant diseases is critically important for developing effective disease management strategies and minimizing agricultural losses.
In recent years, deep learning (DL)-based image classification methods have emerged as powerful and effective tools for automatic plant disease detection. In particular, Convolutional Neural Networks (CNNs) have achieved remarkable success in image-based disease recognition tasks and have demonstrated performance beyond that of traditional machine learning (ML) methods [3]. Deep learning has provided significant advances in the field of plant disease detection. These advances are discussed in the related works section.
1.1 Literature survey
Plant leaf disease detection and classification have been among the significant research topics in the literature, aiming to reduce yield losses in agricultural production. ML in agriculture has contributed substantially to plant disease management by enabling the automated analysis and interpretation of complex datasets [4]. However, due to the limitations of these approaches, which rely on manually extracted features, DL methods that automate feature learning from data have come to the forefront as alternatives to ML approaches [5]. Among DL methods, the CNN architecture has been widely preferred in studies on plant disease classification in the literature due to its structure that enables automatic feature extraction.
Singh et al. [6] examined the detection of Potato Virus Y (PVY) infection, which causes major yield losses in potatoes, using DL models. Their work highlighted the importance of high-quality datasets and the critical role of early diagnosis in reducing yield loss. Similarly, Saeed et al. [7] demonstrated the importance of representing field conditions through brightness-based data augmentation by using a lightweight and specially designed CNN architecture for tomato leaf diseases. Kaur et al. [8] proposed the InceptionResNet-V2–based MIR-V2 model and improved its performance through data enhancement, reduced pooling, and advanced skip-connection structures. Liu et al. [9] developed the PSOC-DRCNet model to address challenges such as complex backgrounds, blurred edges, and learning-rate optimization in rice diseases, improving feature extraction with dual-mode attention and residual adaptive blocks. Although these studies demonstrate the strong feature-learning capacity of CNNs, they remain limited in capturing global relations due to the use of fixed activation functions (ReLU) and their focus on local features.
In the context of cotton diseases, Faisal et al. [10] tested CNN-based models on a dataset constructed from real field images. However, they highlighted important limitations such as the need for high-quality images, limited disease variety, reduced performance in extreme weather conditions, and lack of real-time testing. Shao et al. [11] combined a bilinear coordinate attention mechanism with attention-guided data enhancement on a ResNet34 backbone to improve cotton leaf disease identification under complex natural backgrounds. However, the dataset was dominated by mid- to late-stage disease images, and the authors acknowledge the need for more lightweight models for practical agricultural deployment. Chen et al. [12] proposed the MobileViT V2–based MoSViT model for maize leaf diseases, improving both feature extraction and computational cost. Although the model demonstrated generalization success on small datasets, the weak theoretical foundations of existing enhancement techniques were noted as a major limitation.
Due to the limited global perception of CNNs and the information loss caused by pooling operations, ViT (Vision Transformer)–based approaches have recently attracted attention in plant disease classification. Parez et al. [13] proposed the ViT-based GreenViT model to overcome issues such as information loss due to pooling and limited global perception in CNNs. The model processes images by dividing them into patches within the Transformer structure. After parameter reduction, it achieved higher accuracy than CNN-based methods across three datasets. Srivastava et al. [14] proposed the Agriculture Transfer Learning ViT (AgriTL-ViT) model, replacing the MLP module in the classical ViT architecture with ResNet-based Transformer-ResNet encoder blocks. By using a dual multi-head self-attention mechanism, the model captured local and global context more effectively. Murugavalli and Gopi [15] introduced a Transformer-based Leaf Analysis approach, improving generalization and image quality through multi-head attention mechanisms. Their method achieved higher accuracy, better robustness, and lower computational cost compared to earlier neural-network-based approaches. However, Isinkaye et al. [16] emphasized that the complexity of Transformer-based models remains a major constraint in their hybrid Variational Autoencoder-ViT model. Similarly, Parez et al. [13] highlighted high model complexity and adaptability challenges for resource-limited devices. Palei and Mohapatra [17] combined features extracted from multiple CNN models to classify apple leaf diseases and achieved high accuracy using meta-heuristic optimization methods with random forest classification. Rahman et al. [18] proposed a new Transformer-based model for accelerated and efficient detection of cotton leaf diseases.
Although multilayer perceptrons (MLPs) constitute an essential part of encoder blocks in ViT architectures, they have limitations due to high parameter cost and their inability to directly model spatial information. In this context, Kolmogorov-Arnold Network (KAN)-based approaches grounded in the Kolmogorov-Arnold theorem [19] have enabled the development of architectures with higher representational power by replacing MLP layers. KAN architectures have also shown successful results outside agricultural image processing. Li et al. [20] proposed U-KAN, which integrates tokenized KAN layers into the U-Net backbone for medical image segmentation and diffusion-based generation, achieving the best accuracy-efficiency trade-off among the compared convolutional, MLP- and Mamba-based U-Net variants. However, the framework was validated only on two-dimensional medical datasets, and the authors identify extension to temporal, genomic and three-dimensional data as future work. Shukla et al. [21] replaced the MLP in physics-informed neural networks and operator networks with KANs to solve differential equations. The Chebyshev-based KAN variants matched the accuracy of the MLP versions with fewer parameters. However, the original B-spline KANs were slow, and the Chebyshev variants became unstable as network depth or polynomial order increased. Koenig et al. [22] used KANs in place of MLPs within the Neural ODE framework (KAN-ODEs) to learn dynamical systems and recover symbolic expressions from data without prior knowledge of the governing equations, outperforming MLP-based Neural ODEs in accuracy and generalization. However, KAN-ODEs iterate more slowly per epoch despite faster overall convergence, and show a tendency to overfit in later training stages.
The success of KANs has also been observed in medical imaging and text recognition. Alharbi et al. [23] integrated multi-omic data for cancer classification using a graph-based KAN structure by combining messenger RNA, microRNA, and DNA methylation data with protein-protein interaction networks, enabling interpretable feature extraction. Alsayed et al. [24] presented a hybrid method combining CNN and KAN for Arabic handwritten character recognition, merging the strong feature extraction capacity of convolutional networks with the ability of KANs to model complex functions with fewer parameters. Topşir et al. [25] combined synthetic data generated through data augmentation techniques with KAN for thyroid disease classification. They demonstrated that generative adversarial networks provide significant improvement, particularly in addressing class imbalance problems.
For cotton diseases, Xu et al. [26] proposed the ViTKAB model, which integrates an optimized ViT structure, a BiFormer module, and a KAN component to address challenges such as high computational cost of classical CNN- and ViT-based models, difficulty in capturing multi-scale disease symptoms, and limited data. The model achieved higher accuracy and generalization performance than previous methods by providing more efficient feature extraction, reducing background noise, and enabling strong multi-scale disease representation.
The current literature analysis shows that studies on plant disease classification have provided robust approaches, particularly in addressing challenges caused by complex texture structures, small lesions, and field conditions. Recently, with the increasing use of KAN–based approaches [19], modified architectural designs have emerged in DL methods. This study examines a hybrid approach combining CNN and KAN architectures for the disease classification of cotton plants, which are agricultural products. The proposed approach replaces the fully connected (FC) layer structures of the ResNet-18 [27] and EfficientNet-B0 [28] architectures with two different KAN variants: Efficient KAN and Fast KAN.
The main contributions of this study to the literature are summarized as follows:
•A controlled, frozen-backbone comparison of FC versus two KAN variants as classifier heads on ResNet-18 and EfficientNet-B0 for cotton leaf disease.
•A joint analysis of the accuracy–stability–efficiency trade-off of KAN versus FC heads.
•An indicative comparison against existing baselines reported on the same public dataset.
The remainder of the paper is structured as follows: First, the Materials and Methods section is presented, and the proposed approach is described in detail. Then, the Experimental Results section is provided, and the evaluation process is discussed. Finally, the Discussion and Conclusion section is presented.
2.1 Convolutional Neural Network backbone architectures
Two CNN architectures, widely employed in the image classification literature and representing different architectural design philosophies, are evaluated as feature extraction backbones.
ResNet-18: The ResNet-18 [27] architecture was introduced in the study titled "Deep Residual Learning for Image Recognition" proposed in 2015. The architecture contributed the concept of residual connections to the literature, developed to address the degradation problem encountered in deep CNN training. Consisting of 18 layers in total, the ResNet-18 [27] architecture, unlike classical sequential CNN structures, enables layers to learn not only the targeted mapping but also the difference between this mapping and the input. This structure provides a more stable and faster learning process by particularly reducing the gradient vanishing problem in deep networks. Mathematically, a residual block is presented in Eq. (1).
y = F(x) + x (1)
Here, x represents the block input, while F(x) denotes the transformation consisting of sequential convolution, normalization, and activation operations. Through the direct addition of input information to the output, information loss is kept at a minimum level even when the network is deepened.
In the ResNet-18 [27] architecture, following the global average pooling operation applied after the convolutional layers, a 512-dimensional feature vector is obtained for transfer to the classification layer. This feature vector enables effective representation of high-level and discriminative visual features of critical importance for disease diagnosis from cotton leaf images.
EfficientNet-B0: The EfficientNet-B0 [28] architecture was developed within the scope of the study "EfficientNet: Rethinking Model Scaling for Convolutional Neural Networks" proposed in 2019. This architecture is based on the compound scaling approach, which aims to scale network depth, channel width, and input resolution jointly and in a balanced manner in CNN-based models.
The EfficientNet-B0 [28] architecture, the base model of the EfficientNet family, is utilized as the starting point for deriving other variants. In this architecture, network parameters are defined by the mathematical expression presented in Eq. (2) under a single scaling coefficient φ.
$\mathrm{d}=\mathrm{\alpha}^{\varphi}, \mathrm{\omega}=\mathrm{\beta}^{\varphi}, \mathrm{r}=\mathrm{\gamma}^{\varphi}$ (2)
Here, d denotes the network depth, ω represents the channel width, and r indicates the input resolution. α, β, and γ are fixed scaling coefficients. To ensure a balanced and controlled increase in computational cost, the scaling coefficients are determined to satisfy the compound scaling constraint defined in Eq. (3).
$\mathrm{\alpha} \cdot \beta^2 \cdot \mathrm{\gamma}^2 \approx 2(\mathrm{\alpha} \geq 1, \mathrm{\beta} \geq 1, \mathrm{\gamma} \geq 1)$ (3)
The EfficientNet-B0 [28] architecture employs mobile inverted bottleneck convolution layer blocks as fundamental building units and generates a 1280-dimensional feature vector following the global average pooling operation applied in the final layer. This structure stands out by offering high classification performance, particularly in situations where computational resources are limited.
2.2 Classifier head architectures
FC layer: In CNN architectures, the mapping of high-level features obtained following the feature extraction stage to class labels is accomplished through fully connected layers. FC layers consist of linear transformations where all features from the previous layer are fully connected to each neuron and are widely employed as classification heads.
The FC structure employed as the baseline classifier in this study is defined by the mathematical expression given in Eq. (4).
$\mathrm{g}_{\mathrm{FC}}(\mathrm{z})=\mathrm{W}_2 \cdot \sigma\left(\mathrm{~W}_1 \cdot \mathrm{z}+\mathrm{b}_1\right)+\mathrm{b}_2$ (4)
Here, $\mathrm{z} \in \mathrm{R}^{\mathrm{d}}$ represents the d-dimensional feature vector obtained from the backbone network. $\sigma(\cdot)$ denotes the ReLU activation function used to introduce nonlinearity. $\mathrm{W}_1 \in \mathrm{R}^{(256×d)}$ corresponds to the weight matrix of the first fully connected layer, and $\mathrm{b}_1$ and $\mathrm{b}_2$ are the associated bias terms.
The fundamental function of the FC layer is to transform the spatial and semantic information extracted by convolutional layers into a linearly separable representation in the class space. In this context, FC layers occupy a central position in the decision-making mechanism within CNN architectures and directly influence the discriminative power of high-level features among classes. To enhance the generalization performance of the model and reduce overfitting, a dropout regularization method at a rate of 30% was applied following the hidden layer. The dropout method prevents the network from developing excessive dependency on specific features by randomly deactivating neurons during the training process, thereby promoting more robust representation learning. In the literature, it is known that the dropout mechanism enhances classification performance and generalization capability [29].
KAN architectures: KAN [19] employs learnable univariate functions instead of fixed activation functions used in traditional artificial neural networks. In the KAN architecture, each neuron performs computation through functions that independently transform each input component, rather than performing linear weighting on inputs. Consequently, the model can represent non-linear relationships in a more flexible and interpretable manner compared to classical multi-layer perceptron structures. The mathematical expression of the KAN classifier is presented in Eq. (5).
$\mathrm{g}_{\mathrm{KAN}}(\mathrm{z})=\left(\Phi_{L-1} \circ \Phi_{L-2} \circ \cdots \circ \Phi_0\right)(\mathrm{z})$ (5)
where, $z \in \mathbb{R}^{\mathrm{d}}$ is the feature vector produced by the backbone and gKAN(z) is obtained by composing L successive KAN layers (L = 3 in this study, with layer widths 512–256–128–5 for ResNet-18 and 1280–512–256–5 for EfficientNet-B0).
3.1 Experimental environment and training details
All experiments were conducted on a system with an NVIDIA GeForce RTX 2080 Ti (11 GB VRAM) graphics processing unit, Intel Core i7 processor, and 32 GB RAM hardware configuration. Python 3.10, PyTorch 2.7+, and CUDA 11.8 were utilized as the software environment. Open-source libraries were leveraged for the KAN-based classifier head.
The Adam optimizer was preferred for model training, with the initial learning rate set to 1 × 10⁻⁴ and weight decay to 1 × 10⁻³. These values follow common configurations used in transfer learning literature when training classifier heads on frozen backbone networks. These values were selected based on preliminary pilot experiments on the training set, consistent with common configurations used in transfer learning literature when training classifier heads on frozen backbone networks. A batch size of 64 was employed throughout training, constrained by available GPU memory (11 GB VRAM). The maximum number of epochs was limited to 100. The ReduceLROnPlateau scheduler was configured to reduce the learning rate by a factor of 0.5 when validation loss showed no improvement for 5 epochs, with a minimum learning rate of 1 × 10⁻⁷. Training was terminated through early stopping when validation loss showed no improvement for 10 consecutive epochs.
All images were resized to 256 × 256 pixels and normalized using the ImageNet channel-wise mean (0.485, 0.456, 0.406) and standard deviation (0.229, 0.224, 0.225). Three data augmentation techniques were applied to the training set: horizontal flip to account for arbitrary camera orientations, random rotation within ±30° to represent natural leaf angle variations, and color jitter to introduce variability in brightness and contrast. These augmentations were selected to simulate visual variations present in field conditions. These specific parameter ranges were determined through pilot experiments on the training set, chosen as a balance between simulating realistic field variations and avoiding excessive distortion of disease-relevant lesion features. The dataset was partitioned using stratified sampling with a 70:15:15 split for training, validation, and test sets to maintain proportional class distribution across splits. Because augmentation was performed after the split and restricted to the training subset, no augmented version of any validation or test image exists, which prevents data leakage.
3.2 Used dataset
Experiments were conducted on the publicly available "Cotton Leaf Image Dataset for Disease Classification and Health Monitoring" [30]. The dataset contains high-resolution images of cotton leaves and is divided into five different classes. In this study, we used only the Original subset (1,373 images), and the provider's augmented subset was not used. The per-class distribution of the Original subset is reported in Table 1. According to the dataset descriptor, the images were collected at a single site, the cotton garden of Sher-e-Bangla Agricultural University, Dhaka, Bangladesh. Each leaf was detached and photographed against a white background under predominantly natural light, from multiple viewing angles, using four smartphone cameras of differing specifications, and stored in PNG format. Leaves were sampled at a rate of five to six per plant from multiple plants using a randomized sampling strategy, and labels were verified by an agricultural expert.
Table 1. Data set distribution
|
Class Name |
Number of Images |
|
Alternaria leaf |
173 |
|
Bacterial blight |
218 |
|
Fusarium wilt |
337 |
|
Healthy leaf |
333 |
|
Verticillium Wilt |
312 |
|
Total |
1,373 |
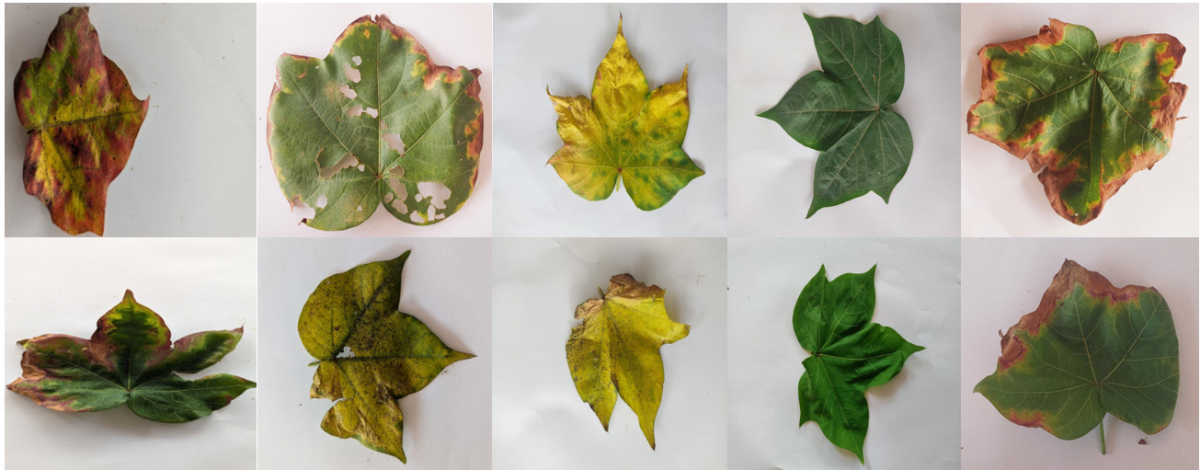
In Figure 1, visual examples belonging to five classes are presented, with two images per class. The "alternaria leaf" class in the first row is a leaf class resulting from a fungal infection. The "bacterial blight" class in the second row is a devastating disease type caused by bacterial blight. The "Fusarium Wilt" class in the third row is a disease resulting from infection and can affect all growth stages of the cotton plant. The "healthy leaf" class in the fourth row represents the healthy cotton plant class. The "Verticillium Wilt" class in the fifth row is a soil disease type caused by Fungi.
Figure 1. Sample images from the dataset. In order: Alternaria leaf, bacterial blight, Fusarium Wilt, healthy leaf, Verticillium Wilt
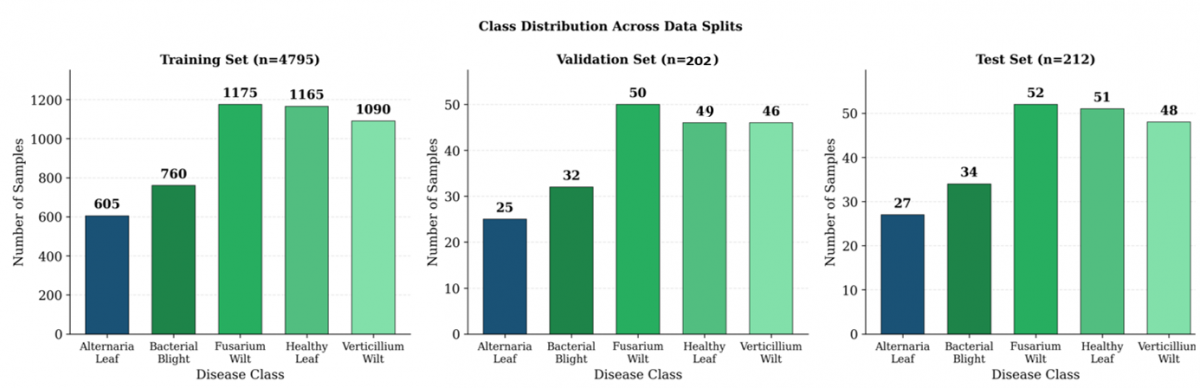
Data augmentation was performed to enhance the generalization capacity of the training set. Horizontal Flip, small random rotation (±30°), and Color Jitter techniques were employed as data augmentation techniques. Horizontal flip was preferred for greater robustness against spatial variations, while small random rotation (±30°) was preferred to enable the model to learn features for leaves at different angles. The Color Jitter method is a data augmentation method realized through the application of random variations in color tones of images and was preferred to reduce the risk of model overfitting to lighting conditions. Each training image was expanded into five samples, increasing the training subset from 959 to 4,795 images. Data augmentation techniques were applied only to the training dataset, thereby preventing data leakage. The model was divided into a 70% training set, 15% validation set, and 15% test set, and class distributions are presented in Figure 2.
Figure 2. Class distribution across data splits
3.3 Evaluation metrics
For the objective and comparable evaluation of the classification performance of the models proposed in this study, quantitative performance metrics widely employed in the literature were utilized. These metrics enable holistic assessment of the model's overall accuracy, inter-class distinguishability, and prediction balance. TP, TN, FP, and FN denote true positive, true negative, false positive, and false negative sample counts, respectively.
Accuracy (Acc), representing the proportion of all samples correctly classified by the model, is well known. This metric demonstrates the overall classification success of the model by encompassing accurate predictions of both positive and negative classes. The mathematical expression is presented in Eq. (6).
$\mathrm{Acc}=\frac{\mathrm{TP}+\mathrm{TN}}{\mathrm{TP}+\mathrm{TN}+\mathrm{FP}+\mathrm{FN}}$ (6)
Precision (Pr) represents the proportion of actual positives among samples predicted as positive by the model. This metric is particularly important for evaluating the effectiveness of false positive predictions. The mathematical expression for Pr is presented in Eq. (7).
$\mathrm{Pr}=\frac{\mathrm{TP}}{\mathrm{TP}+\mathrm{FP}}$ (7)
Recall (R) demonstrates to what extent actual positive samples are correctly detected by the model. This metric serves as a fundamental indicator in evaluating model performance in problems where false negative predictions are critical. The mathematical expression is defined in Eq. (8).
R=TP/(TP+FN) (8)
The F1-score is defined as the harmonic mean of precision and recall metrics; this metric provides a more comprehensive evaluation of the model's classification performance by enabling balanced assessment of both metrics. The mathematical expression is presented in Eq. (9).
F1 - score $=\frac{2 . \operatorname{Pr} . R}{\operatorname{Pr}+R}$ (9)
When these four metrics are considered together, both the overall accuracy levels and inter-class performance balances of models can be comprehensively evaluated.
3.4 Overall classification performance
In the experimental studies, the performance evaluation of three classification heads on two CNN backbone networks over the dataset was compared. To ensure fairness in these comparisons, all experiments were conducted under identical conditions. Furthermore, to ensure the reproducibility and statistical validity of experimental results, each experimental configuration was independently replicated using three different random seed values (42, 123, and 456). The obtained experimental results are presented in Table 2 in the form of mean values and standard deviations.
Table 2. Classification results on the test set (average ± Std over 3 seeds)
|
Backbone |
Classifier Head |
Acc (%) |
Pr (%) |
R (%) |
F1-Score (%) |
|
ResNet-18 |
FC Efficient KAN Fast KAN |
89.15 ± 0.00 90.25 ± 0.54 89.47 ± 1.52 |
88.25 ± 0.20 89.55 ± 0.66 88.56 ± 1.46 |
86.55 ± 0.10 87.79 ± 0.49 86.97 ± 1.77 |
87.16 ± 0.03 88.45 ± 0.54 87.57 ± 1.68 |
|
EfficientNet-B0 |
FC Efficient KAN Fast KAN |
92.61 ± 0.72 93.08 ± 0.54 93.71 ± 0.27 |
92.83 ± 0.57 93.28 ± 0.37 93.77 ± 0.40 |
90.08 ± 0.90 90.55 ± 0.73 91.61 ± 0.48 |
91.00 ± 0.78 91.49 ± 0.60 92.33 ± 0.28 |
Note: FC = fully connected; KAN = Kolmogorov-Arnold Network.
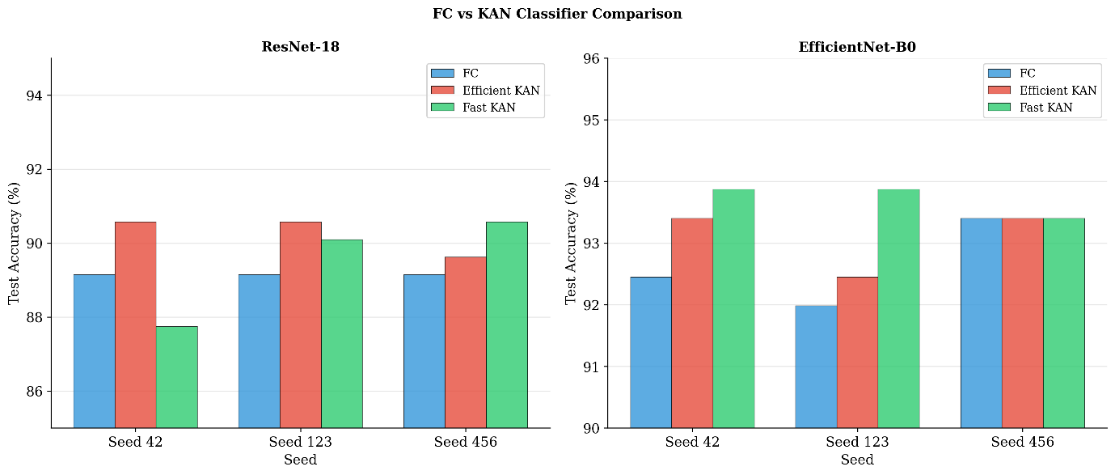
Table 2 presents the results of the ResNet-18 [27] and EfficientNet-B0 [28] CNN architectures with three classification heads according to four different performance metrics. Here, the highest performance results among all experiments were obtained with the Fast KAN classification head of the EfficientNet-B0 architecture. Although there is an overall performance difference in the classification results of the ResNet-18 and EfficientNet-B0 CNN architectures, the performance difference among the classification heads of these classifiers is low. The test accuracy rates obtained from the FC, Efficient KAN, and Fast KAN classification heads of the ResNet-18 architecture and EfficientNet-B0 architecture at three different seed values are presented in Figure 3. According to this visualization, when examining the ResNet-18 backbone, it is observed that the FC classifier demonstrates stable performance (89.15%) across all three seed values. While Efficient KAN provides a notable improvement over FC with approximately 90.5% accuracy at seed 42 and seed 123, it is noteworthy that the performance of Fast KAN exhibits significant variability depending on the seed value. Particularly, it is observed that Fast KAN remains below FC at 87.7% at seed 42, but reaches the highest value at 90.5% at seed 456.
Figure 3. Fully connected (FC) vs Kolmogorov-Arnold Network (KAN) classifier comparison
In the EfficientNet-B0 backbone, it is observed that the Fast KAN classifier exhibits both the highest accuracy rates and the lowest variance. While Fast KAN demonstrates consistent performance in the range of 93.4-93.8% across all three seed values, Efficient KAN and FC classifiers exhibit greater fluctuation depending on the seed value. These findings reveal that backbone selection has a decisive effect on the performance and stability of KAN classifiers.
3.5 Model complexity analysis
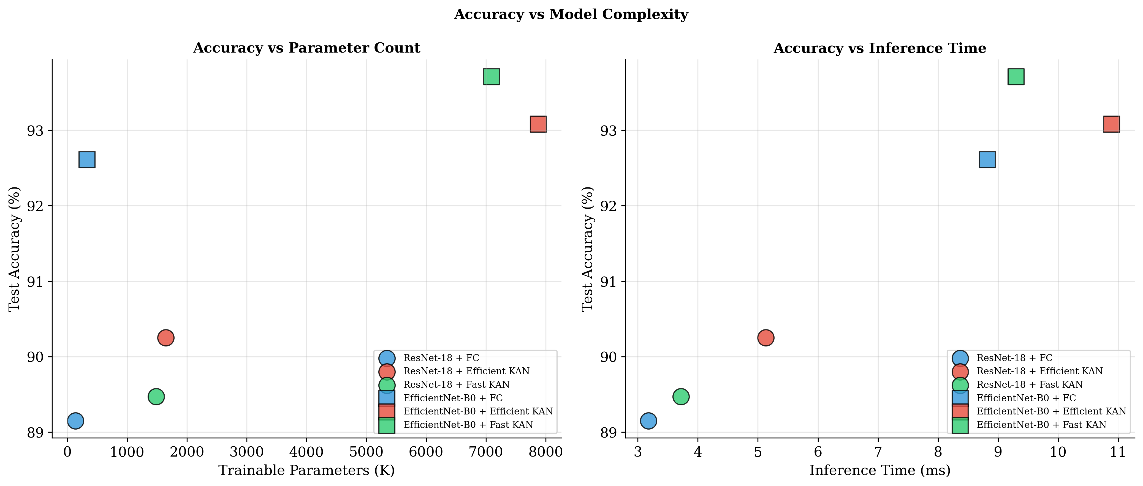
As illustrated in Figure 4, an examination of the number of trainable parameters indicates that KAN [19]–based classifiers contain a substantially higher number of parameters compared to those employing FC layers. When evaluated in terms of the accuracy–complexity trade-off, it is observed that despite the pronounced increase in parameter count, model inference times remain within acceptable limits for practical applications. In this context, models based on the ResNet-18 architecture exhibit inference times of approximately 3–5 ms, whereas those based on the EfficientNet-B0 architecture demonstrate inference times in the range of 8–11 ms.
Figure 4. Accuracy vs. model complexity
Notably, the Fast KAN architecture is found to possess both a lower number of trainable parameters and a shorter inference time compared to the Efficient KAN structure. All configurations exhibited low inference latency on the experimental hardware (below 15 ms per image). This indicates that the added KAN heads do not introduce a prohibitive computational overhead. However, latency was measured under controlled conditions on a desktop GPU, and no on-device or in-field deployment was evaluated. Table 3 reports the total and trainable parameters, model size, and per-image inference time for all six backbone–head configurations. Across both backbones, Fast KAN is consistently lighter than Efficient KAN in both trainable parameters and inference time.
Table 3. Computational complexity of the backbone–head configurations
|
Backbone |
Head |
Total Params |
Trainable Params |
Size (MB) |
Inference (ms) |
|
ResNet-18 |
FC |
11,309,125 |
132,613 |
43.18 |
3.20 |
|
ResNet-18 |
Efficient KAN |
12,821,312 |
1,644,800 |
48.99 |
5.39 |
|
ResNet-18 |
Fast KAN |
12,659,037 |
1,482,501 |
48.33 |
3.37 |
|
EfficientNet-B0 |
FC |
4,336,769 |
329,221 |
16.70 |
8.89 |
|
EfficientNet-B0 |
Efficient KAN |
11,884,668 |
7,877,120 |
45.59 |
11.07 |
|
EfficientNet-B0 |
Fast KAN |
11,101,849 |
7,094,277 |
42.51 |
9.51 |
Note: FC = fully connected; KAN = Kolmogorov-Arnold Network.
In this study, the performances of three different classification heads applied to the ResNet-18 and EfficientNet-B0 architectures were compared for the classification of five distinct cotton leaf types. In the experimental evaluations, KAN models were employed as classification heads instead of conventional FC layers on top of pre-trained CNN architectures. According to the experimental results, replacing the FC head with a KAN head produced modest, configuration-dependent gains in accuracy, ranging from +0.32% to +1.10% across the four backbone–head combinations (Table 4). We therefore characterise the contribution of KAN heads as a consistent but small improvement rather than a large performance leap.
Table 4. Improvement rate shown by the Kolmogorov-Arnold Network (KAN) classifier header compared to fully connected (FC)
|
Backbone |
KAN Classifier |
Improvement |
|
ResNet-18 |
Efficient KAN Fast KAN |
+1.10% +0.32% |
|
EfficientNet-B0 |
Efficient KAN Fast KAN |
+0.47% +1.10% |
Note: KAN = Kolmogorov-Arnold Network.
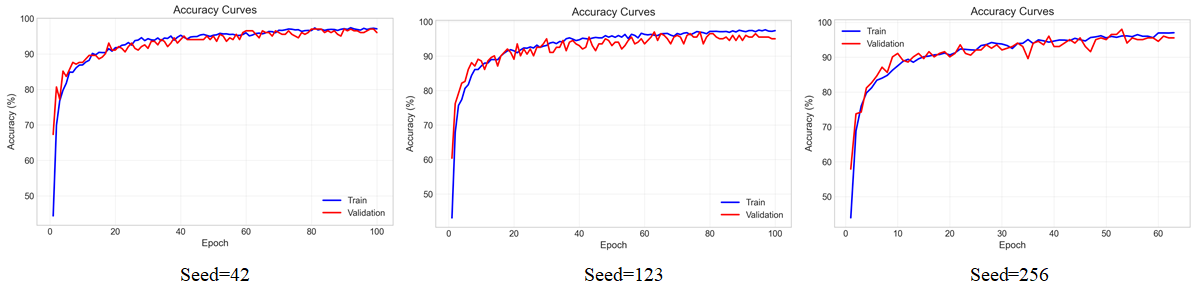
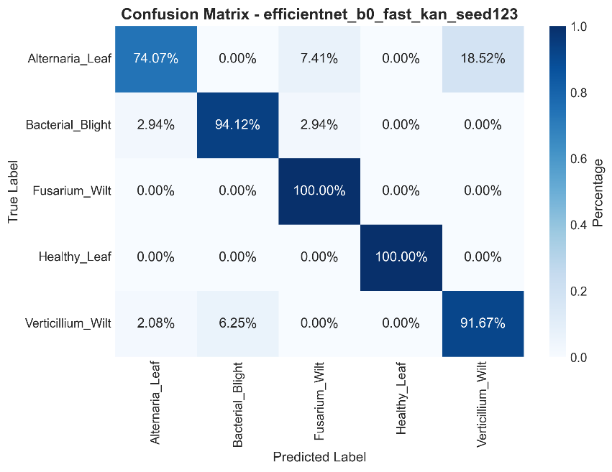
Across all experiments, the best performance was achieved using the EfficientNet-B0 architecture with the Fast KAN classification head. Consequently, the accuracy curves obtained over 100 epochs for this model are presented in Figure 5. These curves demonstrate that the model exhibits stable and consistent training behavior across three different random seed values. In addition, the class-wise prediction performance of the EfficientNet-B0 + Fast KAN model is illustrated through the confusion matrix shown in Figure 6.
Figure 5. Accuracy curve of the model at different seed values (seeds 42, 123, and 456, in that order)
Figure 6. Confusion matrix of the model
The performance advantage of Fast KAN over FC classifiers arises from the fact that Fast KAN employs Gaussian radial basis functions as learnable activation functions on the network edges, whereas FC layers use fixed ReLU activations at the nodes. This design enables each connection to learn disease-specific nonlinear transformations that are adapted to the feature distributions extracted by the CNN backbone. Because the dataset is recent, few prior results are available; nevertheless, the dataset descriptor [30] reports baseline results on the same Original subset, providing a reference point. As summarized in Table 5, DenseNet121 and MobileNetV2 reach 85.91% and 83.90% accuracy on this dataset, whereas the proposed EfficientNet-B0 + Fast KAN configuration reaches 93.71%. These figures are indicative rather than a strictly controlled benchmark; since the protocols differ, we therefore interpret the comparison qualitatively and emphasize the controlled, within-study FC-vs-KAN comparison as our primary evidence. In this research, the primary investigation centers on how the model performance changes when KAN is used instead of FC layers. In other words, the analysis examines whether the KAN architecture is advantageous compared to FC layers, whether it yields a meaningful performance difference, and how it behaves in terms of statistical significance and model stability. In this context, the study serves as an initial reference point for researchers aiming to employ KAN algorithms in agricultural applications.
Table 5. Comparison with baseline results reported on the same dataset
|
Study |
Model |
Accuracy |
|
[30] |
DenseNet121 |
85.91% |
|
[30] |
MobileNetV2 |
83.90% |
|
Our |
EfficientNet-B0 backbone + Fast KAN head |
93.71% |
Note: KAN = Kolmogorov-Arnold Network.
As depicted in Figure 6, the model achieves perfect classification performance with 100% accuracy for the Fusarium Wilt and Healthy Leaf classes. High accuracy rates are also obtained for the Bacterial Blight (94.12%) and Verticillium Wilt (91.67%) classes. In contrast, the Alternaria Leaf Spot class exhibits the lowest classification performance, with an accuracy of 74.07%. Specifically, 18.52% of the samples in this class are misclassified as Verticillium Wilt, while 7.41% are incorrectly classified as Fusarium Wilt. One of the reasons for this failure is that Alternaria and Verticillium diseases lead to similar lesions on the leaf, causing the CNN backbone to learn similar color and texture features. Moreover, the Alternaria class has the smallest sample size in the dataset, with 173 samples, which is almost %50 fewer than the largest class. This imbalance prevents the model from sufficiently learning the variability within the Alternaria class.
This study has important limitations that restrict its practical applicability and generalizability. The dataset contains only 1,373 images and was collected from a single geographical region and a single growing season. This limited scale prevents the model from learning disease variability across different environmental conditions, cultivars, and growth stages. All images were captured under controlled laboratory conditions with uniform illumination and clean backgrounds. However, in practical agricultural environments, images are obtained with mobile devices under variable lighting and often under conditions involving dust, water droplets, and complex backgrounds. No field validation has been conducted; therefore, real-world performance remains unknown. In terms of computational cost, Fast KAN requires more trainable parameters than FC, increasing model size and training time.
Model compression techniques will be necessary for deployment on resource-constrained devices, but these techniques have not been explored in this study. The study focuses solely on cotton diseases; transferability to other crops has not been verified. Since the proposed classifier heads operate on pooled backbone features rather than crop-specific representations, the same controlled FC-vs-KAN comparison protocol could in principle be extended to other leaf-disease datasets or similar image-based agricultural classification tasks without architectural modification. Statistical McNemar testing was performed using only 212 test samples and 3 random seeds; however, such tests are not sufficiently powered to detect small but meaningful differences. Despite these limitations, the study provides a comprehensive comparison of FC and KAN classifiers in a controlled setting and establishes a reproducible basis for future research on hybrid CNN–KAN architectures in agricultural image classification. Future studies are planned to focus on extensive evaluations across diverse agricultural datasets, investigating the impact of backbone fine-tuning on KAN performance, and applying model compression techniques for deployment on mobile and resource-constrained devices.
I would like to thank Ripon and colleagues for publicly sharing the “Cotton Leaf Image Dataset for Disease Classification” used in this study.
The AI tool “ChatGPT” has been used for language editing and readability improvements.
[1] Singh, B.K., Delgado-Baquerizo, M., Egidi, E., et al. (2023). Climate change impacts on plant pathogens, food security and paths forward. Nature Reviews Microbiology, 21: 640-656. https://doi.org/10.1038/s41579-023-00900-7
[2] Nazarov, P.A., Baleev, D.N., Ivanova, M.I., Sokolova, L.M., Karakozova, M.V. (2020). Infectious plant diseases: Etiology, current status, problems and prospects in plant protection. Acta Naturae, 12(3): 46-59. https://doi.org/10.32607/actanaturae.11026
[3] Mohanty, S.P., Hughes, D.P., Salathé, M. (2016). Using deep learning for image-based plant disease detection. Frontiers in Plant Science, 7: 1419. https://doi.org/10.3389/fpls.2016.01419
[4] Shoaib, M., Shah, B., Ei-Sappagh, S., et al. (2023). An advanced deep learning models-based plant disease detection: A review of recent research. Frontiers in Plant Science, 14: 1158933. https://doi.org/10.3389/fpls.2023.1158933
[5] Sarker, I.H. (2021). Deep learning: A comprehensive overview on techniques, taxonomy, applications and research directions. SN Computer Science, 2: 420. https://doi.org/10.1007/s42979-021-00815-1
[6] Singh, C., Randhawa, G.S., Farooque, A.A., et al. (2025). Evaluation of deep learning models for RGB image-based detection of potato virus y strain symptoms (O, NO, and NTN) in potato plants. Smart Agricultural Technology, 10: 100755. https://doi.org/10.1016/j.atech.2024.100755
[7] Saeed, A., Abdel-Aziz, A.A., Mossad, A., Abdelhamid, M.A., Alkhaled, A.Y., Mayhoub, M. (2023). Smart detection of tomato leaf diseases using transfer learning-based convolutional neural networks. Agriculture, 13(1): 139. https://doi.org/10.3390/agriculture13010139
[8] Kaur, P., Harnal, S., Gautam, V., Singh, M.P., Singh, S.P. (2023). A novel transfer deep learning method for detection and classification of plant leaf disease. Journal of Ambient Intelligence and Humanized Computing, 14: 12407-12424. https://doi.org/10.1007/s12652-022-04331-9
[9] Liu, Z.W., Zhou, G.X., Zhu, W.K., et al. (2024). Identification of rice disease under complex background based on PSOC-DRCNet. Expert Systems with Applications, 249: 123643. https://doi.org/10.1016/j.eswa.2024.123643
[10] Faisal, H.M., Aqib, M., Rehman, S.U., et al. (2025). Detection of cotton crops diseases using customized deep learning model. Scientific Reports, 15: 10766. https://doi.org/10.1038/s41598-025-94636-4
[11] Shao, M., He, P., Zhang, Y., Zhou, S., Zhang, N., Zhang, J. (2022). Identification method of cotton leaf diseases based on bilinear coordinate attention enhancement module. Agronomy, 13(1): 88. https://doi.org/10.3390/agronomy13010088
[12] Chen, Y.Q., Wang, A.P., Liu, Z.Y., et al. (2025). MoSViT: A lightweight vision transformer framework for efficient disease detection via precision attention mechanism. Frontiers in Artificial Intelligence, 8: 1498025. https://doi.org/10.3389/frai.2025.1498025
[13] Parez, S., Dilshad, N., Alghamdi, N.S., Alanazi, T.M., Lee, J.W. (2023). Visual intelligence in precision agriculture: Exploring plant disease detection via efficient vision transformers. Sensors, 23(15): 6949. https://doi.org/10.3390/s23156949
[14] Srivastava, M., Sisaudia, V., Meena, J. (2025). AgriTL-ViT: A Vision Transformer model with attention techniques for classification of plant leaf disease. Expert Systems with Applications, 294: 128793. https://doi.org/10.1016/j.eswa.2025.128793
[15] Murugavalli, S., Gopi, R. (2025). Plant leaf disease detection using vision transformers for precision agriculture. Scientific Reports, 15: 22361. https://doi.org/10.1038/s41598-025-05102-0
[16] Isinkaye, F.O., Olusanya, M.O., Akinyelu, A.A. (2025). A multi-class hybrid variational autoencoder and vision transformer model for enhanced plant disease identification. Intelligent Systems with Applications, 26: 200490. https://doi.org/10.1016/j.iswa.2025.200490
[17] Palei, S., Mohapatra, P. (2025). Metaheuristic-integrated DensoMobileForestNet for apple leaf disease identification. Applied Fruit Science, 67: 142. https://doi.org/10.1007/s10341-025-01384-w
[18] Rahman, M.M., Hossain, M.S., Dhakal, K., Poudel, R., Islam, M.M., Ahmed, M.R. (2025). A novel transformer model for accelerated and efficient cotton leaf disease identification. In 2025 International Conference on Quantum Photonics, Artificial Intelligence, and Networking (QPAIN), Rangpur, Bangladesh, pp. 1-6. https://doi.org/10.1109/QPAIN66474.2025.11172151
[19] Liu, Z.M., Wang, Y.X., Vaidya, S., et al. (2024). KAN: Kolmogorov–Arnold Networks. In International Conference on Learning Representations, pp. 70367-70413. https://proceedings.iclr.cc/paper_files/paper/2025/hash/afaed89642ea100935e39d39a4da602c-Abstract-Conference.html.
[20] Li, C., Liu, X., Li, W., et al. (2025). U-KAN makes strong backbone for medical image segmentation and generation. Proceedings of the AAAI Conference on Artificial Intelligence, 39(5): 4652-4660. https://doi.org/10.1609/aaai.v39i5.32491
[21] Shukla, K., Toscano, J.D., Wang, Z., Zou, Z., Karniadakis, G.E. (2024). A comprehensive and FAIR comparison between MLP and KAN representations for differential equations and operator networks. Computer Methods in Applied Mechanics and Engineering, 431: 117290. https://doi.org/10.1016/j.cma.2024.117290
[22] Koenig, B.C., Kim, S., Deng, S. (2024). KAN-ODEs: Kolmogorov–Arnold network ordinary differential equations for learning dynamical systems and hidden physics. Computer Methods in Applied Mechanics and Engineering, 432: 117397. https://doi.org/10.1016/j.cma.2024.117397
[23] Alharbi, F., Budhiraja, N., Vakanski, A., et al. (2025). Interpretable graph Kolmogorov–Arnold networks for multi-cancer classification and biomarker identification using multi-omics data. Scientific Reports, 15: 27607. https://doi.org/10.1038/s41598-025-13337-0
[24] Alsayed, A., Li, C.L., Abdalsalam, M., Fat’hAlalim, A. (2025). A hybrid model for Arabic character recognition using CNN and Kolmogorov Arnold Networks (KANs). Multimedia Tools and Applications, 84: 44973-44996. https://doi.org/10.1007/s11042-025-20934-8
[25] Topşir, A., Güler, F., Çetin, E., Burak, M.F., Ağraz, M. (2025). Thyroid disease classification using generative adversarial networks and Kolmogorov-Arnold network for three-class classification. BMC Medical Informatics and Decision Making, 25: 284. https://doi.org/10.1186/s12911-025-03014-7
[26] Xu, L.X., Song, H.Y., Yang, X.D., Xu, P., Cai, Z.P. (2025). ViTKAB: An efficient deep learning network for cotton leaf disease identification. Frontiers in Plant Science, 16: 1719877. https://doi.org/10.3389/fpls.2025.1719877
[27] He, K.M., Zhang, X.Y., Ren, S.Q., Sun, J. (2016). Deep residual learning for image recognition. In 2016 IEEE Conference on Computer Vision and Pattern Recognition (CVPR), pp. 770-778. https://doi.org/10.1109/CVPR.2016.90
[28] Tan, M.X., Le, Q.V. (2019). EfficientNet: Rethinking model scaling for convolutional neural networks. In Proceedings of the 36th International Conference on Machine Learning (ICML), Long Beach, California, pp. 6105-6114. https://proceedings.mlr.press/v97/tan19a.html?ref=ji.
[29] Srivastava, N., Hinton, G., Krizhevsky, A., Sutskever, I., Salakhutdinov, R. (2014). Dropout: A simple way to prevent neural networks from overfitting. Journal of Machine Learning Research, 15(56): 1929-1958. https://jmlr.org/papers/v15/srivastava14a.html.
[30] Ripon, S., Gani, R., Niha, N.M., et al. (2025). Cotton leaf image dataset for disease classification and health monitoring. Data in Brief, 63: 112142. https://doi.org/10.1016/j.dib.2025.112142