Yunus Emre Karaca* | Serpil Aslan
© 2022 IIETA. This article is published by IIETA and is licensed under the CC BY 4.0 license (http://creativecommons.org/licenses/by/4.0/).
OPEN ACCESS
Early detection of lung cancer increases the response rate to treatment. Therefore, the accuracy of diagnostic methods is of great importance. Reading the patient's medical images by radiologists can cause a severe time cost besides subjective result. In this context, Artificial Intelligence (AI) methods create an innovative field to reduce the workforce of radiologists and obtain objective results. AI methods play a vital role in improving the analysis of the dataset, extracting meaningful features, clustering, and classification. In our study, the data set contains healthy images besides CT images of malignant and benign tumors with lung cancer; AlexNet is trained using DenseNet 201, GoogleNet, MobileNetV2, and ResNet50 architectures. In addition, a hybrid model has been developed to classify lung CT images. The developed model constitutively used GoogleNet, MobileNetV2, and ResNet50 architectures. The feature maps obtained in these three architectures were combined and classified into different classifiers. Among the classifiers used in the study, the highest accuracy rate was achieved in the Ensemble Subspace KNN classifier. The accuracy value obtained in this classifier is 98.3%.
lung cancer, deep learning, convolutional neural networks, image processing, hybrid model, artificial intelligence
Cancer usually consists of a multistage process that progresses from a lesion to a malignant tumor. It is caused by the transformation of normal cells into tumor cells. These changes include physical carcinogens such as ultraviolet and ionizing radiation as well as a person's genetic factors; the result of interactions between chemical carcinogens such as asbestos, tobacco smoke components, alcohol, aflatoxin (a food pollutant), and arsenic (a drinking water pollutant), and biological carcinogens such as infections from certain viruses, bacteria or parasites [1]. According to data published by the World Health Organization, lung cancer is the second most common. This type of cancer is the leading cause of cancer-related death worldwide, the course of the disease is closely related to the stage at the time of diagnosis [1, 2].
In addition, in most cases, the diagnosis is made in advanced stages, when treatment is no longer possible [3]. Therefore, it is necessary to develop new diagnostic methods that increase the accuracy of early diagnosis to catch lung cancer in the early stages when successful treatments are possible, to improve overall survival, and reduce the side effects of health care costs due to systemic treatments [4]. One of the essential pre-diagnosis procedures of lung cancer is the examination of computed tomography (CT) images. Pre-diagnosis resulting from X-ray or Computed Tomography (CT) scanning is time-consuming and tiring for the radiologist. In addition, this scanning process requires very high concentration and skill. Less experienced radiologists have highly variable detection rates, which increases the speed of false positive detection, mainly where interpretation is highly dependent on prior experience [5].
In light of this information, Accurate and automated detection of lung cancer can help speed up early detection leading to better treatment and higher survival rates. In addition, this innovation can greatly assist radiologists and provide significant time savings. Especially recently, researchers have increased their work on deep learning models that promise to increase the speed and accuracy of detecting lung cancer.
Computers are trained to process lung cancer CT scans to examine the hallmarks of malignant, benign, and healthy images. In this study, our dataset, which includes healthy photos as well as pictures of malignant and benign tumors with lung cancer, was trained on AlexNet, DenseNet 201, GoogleNet, MobileNetV2, and ResNet50 architectures. A hybrid model was created and classified on GoogleNet, MobileNetV2, and ResNet50. These three models are determined within these architectures. In the experimental results, the proposed model was the best performing technique in the Ensemble Subspace KNN model type with a success rate of 98.3%.
The remainder of this work is organized as follows: Chapter 2 presents a literature review of relevant studies in this area. Chapter 3 describes the obtained dataset, the preprocessing steps applied to this dataset, and the relevant theoretical frameworks. Chapter 4 describes the proposed approach and comparatively analyzes the experimental results of the proposed approach on the given data set. Chapter 5 concludes the study.
Correct diagnosis and prognosis are essential in the selection and planning of treatment in diseases. However, with the rapid progress of medical imaging technology, whole slide imaging (WSI) in pathology is on its way to becoming a routine procedure for the clinic. Recently, artificial intelligence has shown high performance in studies such as deep learning, tumor site identification, prognosis prediction, metastasis detection, and lung tissue image analysis.
To facilitate the rapid detection of lung cancer, a considerable amount of studies are found when the literature is scanned. Wang and coworkers [6] proposed a new CNN-based model to classify malignant or non-malignant. Full-slide imaging (WSI) is typically a megapixel in the proposed model, so much smaller image patches extracted from WSI are often used as input. This 2018 study used each 300 × 300 pixel image patch from lung adenocarcinoma (ADC) WSIs. A success rate of 89.8% was achieved in the proposed model. In another study, Šarić et al. [7] proposed a fully automated method for lung cancer detection in whole slide images of lung tissue samples. This method performs classification at the image patch level using a convolutional neural network (CNN). Two CNN architectures (VGG and ResNet) are trained, and their performances are compared. In another study by Sajja et al. [8], a deep neural network was designed based on a pre-trained CNN, GoogleNet. The proposed network's densely connected architecture is distributed with 60% of all neurons deployed in dropout layers to reduce computational cost and avoid overfitting in network learning. The performance of the proposed network was validated through a simulation on a preprocessed CT scan image dataset and then compared with the dataset and pre-trained AlexNet, GoogleNet, and ResNet50. A study by Fang [9], proposed a fast, accurate, stable lung cancer detection system based on new deep learning techniques. A transfer learning approach created a convolutional neural network (CNN) structure similar to GoogLeNet. It used Median Density Projection (MIP) to incorporate the multi-image features of three-dimensional computed tomography (CT) scans. MIPS enabled the proposed system to learn the characteristics of malignant and benign lung nodules integrated during training and achieve high accuracy when tested in validation sets. In Mohite's study [10], the Transfer Learning architecture of MobileNet, VGG16, VGG19, DenseNet-201, and ResNet-101 are extensively compared in the classification of the dataset consisting of 1100 lung CT scans. Among them, DenseNet-201 showed the best performance. Jayaraj and Sathiamoorthy [11] developed a computer-aided model comprised of a series of processes for detecting lung cancer on CT images. After the input image is preprocessed, the segmentation of the images will be performed with the watershed segmentation algorithm, which produces the output as a segmented image in binary format. Next, a collection of key features of the fragmented images was obtained. Then, a collection of the main characteristics of the fragmented images was produced. Then, the classification of images was performed using the random forest (RF) classifier model, which outputs as 'normal' or 'abnormal' classified images, achieving a maximum accuracy of 89,90.
On the other hand, Zhang et al. [12] introduced a modified version of ResNet. They applied it to segment the gross target volume on computed tomography images of non-small cell lung cancer patients. Then, normalization was applied to reduce the differences between the pictures, and data augmentation techniques were used to enrich the training set's data further. Two different residual convolution blocks are used to efficiently extract deep features of tomography images, combining elements from all levels of ResNet into a single output. This simple design created a combination of deep semantic and shallow appearance features to produce pixel-dense results. Compared to the U-Net, this model was significantly more accurate based on the overlap and receiver operating characteristic curves. Xie et al. [13] developed a new (Fuse-TSD) lung nodule classification algorithm that uses outcome-oriented tissue, shape, and deep model-learned information to distinguish between malignant and benign lung nodules. The gray-level co-occurrence matrix (GLCM) based texture descriptor uses a Fourier shape descriptor to characterize the heterogeneity of nodules and a deep convolutional neural network (DCNN) to automatically learn the slice-by-slice feature representation of the nodules on it. It trains an AdaBoosted back propagation neural network (BPNN) using each feature type and combines the decisions made by the three classifiers to distinguish nodules. We evaluated this algorithm against three approaches in the LIDC-IDRI dataset. In terms of accuracy, it reached a maximum of 89.53%. In the study of Tekade and Rajeswari [14], the lung patients were divided into sections using Computed Tomography (CT) scan images and U-Net architecture to detect and classify lung nodules and determine the malignancy level of these nodules. The study proposes a 3D multipath VGG-like network evaluated on 3D cubes extracted from datasets. Predictions from U-Net and 3D multipath VGG-like networks are combined for final results. Using this architecture, lung nodules are classified, and successful results can be detected at the level of malignancy.
3.1 Dataset and preprocessing
Figure 1. Dataset containing healthy, benign and malignant images
The dataset is taken from Kaggle, an online platform [15] that allows users to find and publish datasets. Our dataset (IQ-OTH/NCCD) lung cancer dataset; was gathered in Iraq-Oncology Training Hospital/National Cancer Diseases Center for three months in 2019. The IQ-OTH/NCCD file, which has cancer images at different stages besides healthy subjects, was marked by oncologists and radiologists in the centers. The dataset contains 1190 images representing CT scan slices of 110 cases. An example part is shown in Figure 1. These cases are divided into three classes normal, benign, and malignant. Forty of them are malignant; It was obtained from 15 mild and 55 standard cases and classified into a classification [16]. Experiments were carried out on the MATLAB platform, a multi-model numerical computing tool and software for training in CNN architectures. All investigations are tested on Intel Core i7 Windows 10 operating system 8 GB RAM computer.
3.2 Methodology
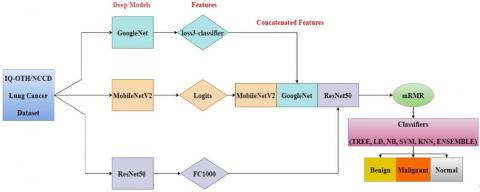
In this section, firstly, the central theme of our study is briefly explained, and then basic information about the CNN models used in the study is given. First, the dataset was trained with AlexNet, DenseNet201, GoogleNet, MobileNetV2, and ResNet50 architectures. It was aimed to increase the success rate in these architectures, where good performance results were obtained, and a hybrid model was created with the three selected architectures, GoogleNet, MobileNetV2, and ResNet50. The created hybrid model was run with six classification models in the MATLAB platform, and the most successful 6 model types were determined. The block diagram of the proposed model is given in Figure 2.
Table 1. Metrics used in analysis of confusion matrix
|
Derivations |
|
|
Sensitivity |
TPR = TP / (TP + FN) |
|
Specificity |
SPC = TN / (FP + TN) |
|
Precision |
PPV = TP / (TP + FP) |
|
Negative Predictive Value |
NPV = TN / (TN + FN) |
|
False Positive Rate |
FPR = FP / (FP + TN) |
|
False Discovery Rate |
FDR = FP / (FP + TP) |
|
False Negative Rate |
FNR = FN / (FN + TP) |
|
Accuracy |
ACC = (TP + TN) / (P + N) |
|
F1 Score |
F1 = 2TP / (2TP + FP + FN) |
|
Matthews Correlation Coefficient |
TP*TN - FP*FN / sqrt((TP+FP) * (TP+FN) * (TN+FP) * (TN+FN)) |
As performance metrics, Sensitivity, specificity, and positive and negative predictive values (PPV and NPV) are calculated with false positive rate, false discovery rate, false negative rate, Accuracy, Precision, F1 Score, and Matthews Correlation Coefficient. In Table 1, the calculation methods of the metrics are given with their formulas.
3.3 Baseline CNN architectures
Different CNN architectures were preferred in the study. These architectures are accepted in the literature.
AlexNet: One of the deep learning models, AlexNet, was developed to classify objects in images and won the ImageNet classification competition in 2012. The input layer is fed with an image size of 227 by 227. The 227 MB model consists of five convolutional, maximum pooling, three fully connected, 1000-way softmax, and output layers for 25 layers. The entire structure of the model contains 61 million trainable parameters. AlexNet can be installed in Matlab or Python using custom toolboxes [17].
DenseNet201: The DenseNet-201 model, on the other hand, was designed to reduce the number of parameters and to have more efficient and shorter connections between layers. The model was evaluated in four competitive object recognition benchmarking tasks (CIFAR-10, CIFAR-100, SVHN, and ImageNet). The 77 MB model consists of 201 deep layers. The input layer is fed with an image size of 224 by 224. The entire structure of the model includes 20 million trainable parameters [18].
GoogleNet: The model was proposed in the 2014 ImageNet classification competition. It comprises 144 layers, 22 deep and 27 MB in size. The input layer is fed with an image size of 224 by 224. All convolutions use the ReLU enable function. The entire structure of the model includes 7 million trainable parameters [19].
MobileNetV2: A convolution module is added for less memory usage in the model measured using ImageNet classification, COCO object detection, and VOC image segmentation. The model consists of 53 deep layers with a size of 13 MB, while the input layer is fed with an image size of 224 x 224. The entire structure of the model includes 3.5 million trainable parameters [20].
ResNet50: Introduced by Facebook AI Research (FAIR), the deep network model that now implements learning. Although it provides significantly high accuracy, it requires significant processing time due to the considerable depth of the network. The input layer is fed with an image size of 224 by 224. ResNet50 is 96 MB in size, consists of 50 primary and 177 layers, and contains 25.6 million trainable parameters [21].
Figure 2. Suggested model
Table 2. Used architectures and accuracy rates
|
Deep learning neural network |
Accuracy |
|
AlexNet |
0.8995 |
|
DenseNet 201 |
0.9132 |
|
GoogleNet |
0.9087 |
|
MobileNetV2 |
0.9269 |
|
ResNet 50 |
0.9269 |
Table 3. Machine learning techniques that work best
|
Model type |
Accuracy |
|
Medium Tree |
86.1% |
|
Linear Discriminant (LD) |
97.0% |
|
Kernel Naive Bayes (NB) |
87.1% |
|
Support Vector Machines (SVM) Quadratic |
97.9% |
|
K Nearest Neighbours (KNN) Fine |
98.2% |
|
Ensemble Subspace KNN |
98.3% |
We used MATLAB, a multi-paradigm numerical computing tool, and software. The dataset we use consists of computed tomography data, which includes images of 3 different classes of lung cancer malignant tumors, non-cancer cells, benign tumors, and healthy lungs, obtained from the open access site Kaggle, which hosts online datasets. In our study, AlexNet, DenseNet 201, GoogleNet, MobileNetV2, and ResNet50 architectures were the first to run on our dataset. The experimental results of the respective architectures are shown in Table 2. A new hybrid model was proposed with three architectures selected among these architectures for the classification process.
This study proposed an innovative hybrid model based on GoogleNet, MobileNetV2, and ResNet50 architectures. In the study, the data set is divided into 80% training and 20% testing to test the fundamental architectures and the proposed model. Then, feature extraction was performed separately with the three selected architectures in the proposed model, and the resulting features were combined after training the proposed model with the obtained features. Our hybrid model was run in all six machine learning models in the classification training section in Matlab. The techniques that gave the best results among the six models are listed in Table 3. Among these model types, Ensemble Subspace KNN achieved 98.3% success and became the best performing technique.
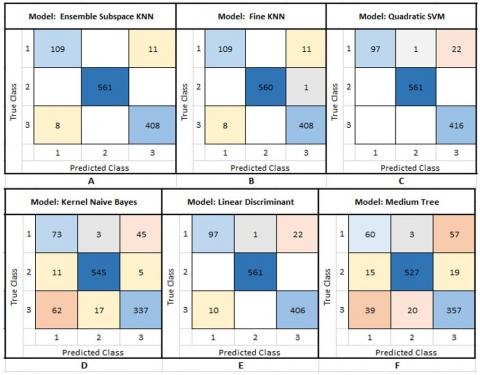
Some methods and calculations were made to determine the performance of this model type with various measures. The confusion matrix is the most common way to analyze the results of a machine learning model in a classification. As seen in Figure 3, as a result of the Ensemble Subspace KNN Confusion Matrix analysis, three classes were evaluated separately, and high-performance results were obtained. The probabilities that the model used in solving the complexity matrix predicted correctly (True Positive (TP), True Negative (TN)) and the probability that it predicted incorrectly, False Positive (FP), False Negative (FN), were calculated separately for each classification. These calculated values were calculated with various metrics showing the classification success rate. The results are given in detail in Table 4.
In our study, when the Sensitivity and specificity, PPV, and NPV values were analyzed for the three training classes of the dataset, the high result showed the accuracy of the statistics; FPR, PNR, and FDR values are close to zero, which shows the success of the study.
When we look at our classification model's accuracy, precision, and F1 Score parameters and the results for all classes, we can say that it makes a successful estimation with results close to 1 and 1. Matthews Correlation Coefficient has a minimum value of 0.91 for all education classes. These values are relative to 1, indicating that the model does an excellent job predicting.
Figure 3. (A) Ensemble subspace KNN, (B) K nearest neighbors (KNN) fine, (C) Support vector machines (SVM) quadratic, (D) Kernel naive bayes (NB), (E) Linear discriminant (LD), (F) Medium tree confusion matrix
Table 4. (A) Benign, (B) Malicious, (C) Analysis results of healthy images
|
Measure |
Value |
Measure |
Value |
Measure |
Value |
|
Sensitivity |
0.9083 |
Sensitivity |
1 |
Sensitivity |
0.9808 |
|
Specificity |
0.9918 |
Specificity |
1 |
Specificity |
0.9838 |
|
Precision |
0.9316 |
Precision |
1 |
Precision |
0.9737 |
|
Negative Predictive Value |
0.9888 |
Negative Predictive Value |
1 |
Negative Predictive Value |
0.9882 |
|
False Positive Rate |
0.0082 |
False Positive Rate |
0 |
False Positive Rate |
0.0162 |
|
False Discovery Rate |
0.0684 |
False Discovery Rate |
0 |
False Discovery Rate |
0.0263 |
|
False Negative Rate |
0.0917 |
False Negative Rate |
0 |
False Negative Rate |
0.0192 |
|
Accuracy |
0.9827 |
Accuracy |
1 |
Accuracy |
0.9827 |
|
F1 Score |
0.9198 |
F1 Score |
1 |
F1 Score |
0.9772 |
|
Matthews Correlation Coefficient |
0.9102 |
Matthews Correlation Coefficient |
1 |
Matthews Correlation Coefficient |
0.9633 |
|
A |
B |
C |
|||
Figure 4. ROC curves of (A) Benign, (B) Malicious, (C) Healthy image classes
Finally, the AUC curves obtained in the proposed hybrid model are given in Figure 4. ROC curve is a graph that summarizes the performance of all parameters that may occur after classification, such as Ensemble Subspace KNN. Also, the area under the curve (AUC) measures how much a variable's quality differs between two classes.
Lung cancer is one of the leading causes of cancer deaths worldwide [22, 23]. This type of cancer causes more deaths in men based on gender. According to a study conducted in 2018, there were 1.2 million men and 576,100 women, totaling 1.8 million deaths. This result means 1 in 5 of all cancer deaths [24]. The relatively high death rate is mainly due to the diagnosis of advanced cancer, in which most patients have an inadequate response to medical therapy [25]. In short, delayed diagnosis is a major contributor to poor outcomes and remains a major challenge [26]. To overcome this problem, the lung cancer screening guideline in the United States was changed in 2013. Recommended low-dose computed tomography (LDCT) scan for people 55 to 80 years old who smoke 30 packs a year or adults who quit less than 15 years ago [27]. Different attempts have been made to identify other screening methods for the diagnosis of lung cancer. Chest radiography or sputum sample has been observed to be less efficient than LDCT. In addition, the importance of CT images has emerged [28, 29]. The integration of the concept of artificial intelligence in all areas of life with the developing technology and these situations have revealed various methods to facilitate the work of radiologists in this field [30].
This study has been prepared to solve the above-mentioned problems. A hybrid image processing method has been proposed to extract different features from the images of the lung cancer dataset (IQ-OTH/NCCD) and to obtain successful results. With these extracted features, various supervised deep-learning architectures were used to detect and classify the existing cancerous mass. While the accuracy obtained using only deep learning architectures is 92%, by converting the model to hybrid; it performed very successfully in the "Ensemble Subspace KNN" classification with an accuracy of 98.3%.
Table 5. Literature review
|
Reference |
Year |
Model/Method |
Accuracy |
|
[6] |
2018 |
Inception (V3) |
%89.8 |
|
[7] |
2019 |
VGG16 |
%83.3 |
|
[9] |
2018 |
GoogLeNet |
%81 |
|
[10] |
2021 |
DenseNet-201 |
%92.94 |
|
[11] |
2019 |
Random Forest (RF) |
%89.90 |
|
[13] |
2018 |
Fuse-TSD |
%89.53 |
|
[14] |
2018 |
U-Net |
%95.60 |
In Table 5, the models and accuracy rates of the studies mentioned in the section are given. Considering this information, the performance of the model we developed among the pre-trained models gave a more successful result. With this successful result, our model can act as a savior in the medical world where there is no or insufficient manpower in this field. Even if there is qualified manpower, it not only saves a lot of time but also has a supportive feature with the objective results it offers.
To mention some of the limitations of the study, cases such as data being open to the public and obtained from a single center are the shortcomings of our study. However, it is among our goals that this system will be supported by patient images collected from more centers in the future, and experts from more regions will be included in the study.
Since very early diagnosis increases the response rate to treatment for lung cancer patients, the accuracy of diagnostic methods is also essential in this context. Reading cancerous images by radiologists can cause severe losses in time and subjective results. Therefore, artificial neural networks are an open field for innovations in this field to reduce the radiology workforce and obtain objective results. Synthetic intelligence methods play a vital role in improving the analysis of the dataset, extracting meaningful features, clustering, and classification.
This study developed a new hybrid model to classify lung CT images. The developed model was more successful than the pre-trained models in the literature. The accuracy value obtained in the proposed model is 98.3%. This value shows that the developed model can be used to diagnose lung cancer. Even more, successful results can be obtained by expanding the classes in the data set and increasing the data.
[1] https://www.who.int/news-room/fact-sheets/detail/cancer, accessed on August 1 2022.
[2] https://gco.iarc.fr/today/home, accessed on July 21 2022.
[3] Lucas, E. (2011). Cancer survival in Africa, Asia, the Caribbean and Central America. R. Sankaranarayanan, & R. Swaminathan. Lyon: International Agency for Research on Cancer.
[4] Walters, S., Maringe, C., Coleman, M.P., et al. (2013). Lung cancer survival and stage at diagnosis in Australia, Canada, Denmark, Norway, Sweden and the UK: A population-based study, 2004-2007. Thorax, 68(6): 551-564. https://dx.doi.org/10.1136/thoraxjnl-2012-202297
[5] Shen, S., Han, S.X., Aberle, D.R., Bui, A.A., Hsu, W. (2019). An interpretable deep hierarchical semantic convolutional neural network for lung nodule malignancy classification. Expert Systems with Applications, 128: 84-95. https://doi.org/10.1016/j.eswa.2019.01.048
[6] Wang, S., Chen, A., Yang, L., et al. (2018). Comprehensive analysis of lung cancer pathology images to discover tumor shape and boundary features that predict survival outcome. Scientific Reports, 8(1): 10393. https://doi.org/10.1038/s41598-018-27707-4
[7] Šarić, M., Russo, M., Stella, M., Sikora, M. (2019). CNN-based method for lung cancer detection in whole slide histopathology images. In 2019 4th International Conference on Smart and Sustainable Technologies (SpliTech), Split, Croatia, pp. 1-4. https://doi.org/10.23919/SpliTech.2019.8783041
[8] Sajja, T., Devarapalli, R., Kalluri, H. (2019). Lung Cancer detection based on CT scan images by using deep transfer learning. Traitement du Signal, 36(4): 339-344. https://doi.org/10.18280/ts.360406
[9] Fang, T. (2018). A novel computer-aided lung cancer detection method based on transfer learning from GoogleNet and median intensity projections. In 2018 IEEE International Conference on Computer and Communication Engineering Technology (CCET), Beijing, China, pp. 286-290. https://doi.org/10.1109/ccet.2018.8542189
[10] Mohite, A. (2021). Application of transfer learning technique for detection and classification of lung cancer using CT images. International Journal of Scientific Research and Management, 9(11): 621-634. https://doi.org/10.18535/ijsrm/v9i11.ec02
[11] Jayaraj, D., Sathiamoorthy, S. (2019). Random forest based classification model for lung cancer prediction on computer tomography images. In 2019 International Conference on Smart Systems and Inventive Technology (ICSSIT), Tirunelveli, India, pp. 100-104. https://doi.org/10.1109/ıcssıt46314.2019.8987772
[12] Zhang, F., Wang, Q., Li, H. (2020). Automatic segmentation of the gross target volume in non-small cell lung cancer using a modified version of resNet. Technology in Cancer Research & Treatment, 19: https://doi.org/10.1177/1533033820947484
[13] Xie, Y., Zhang, J., Xia, Y., Fulham, M., Zhang, Y. (2018). Fusing texture, shape and deep model-learned information at decision level for automated classification of lung nodules on chest CT. Information Fusion, 42: 102-110. https://doi.org/10.1016/j.inffus.2017.10.005
[14] Tekade, R., Rajeswari, K. (2018). Lung cancer detection and classification using deep learning. In 2018 fourth international conference on computing communication control and automation (ICCUBEA), Pune, India, pp. 1-5. https://doi.org/10.1109/ıccubea.2018.8697352
[15] https://en.wikipedia.org/wiki/Kaggle, accessed on July 7 2022.
[16] https://www.kaggle.com/datasets/hamdallak/the-iqothnccd-lung-cancer-dataset, accessed on July 1 2022.
[17] Krizhevsky, A., Sutskever, I., Hinton, G.E. (2017). Imagenet classification with deep convolutional neural networks. Communications of the ACM, 60(6): 84-90. https://doi.org/10.1145/3065386
[18] Huang, G., Liu, Z., Van Der Maaten, L., Weinberger, K.Q. (2017). Densely connected convolutional networks. In Proceedings of the IEEE Conference on Computer Vision and Pattern Recognition, Honolulu, HI, USA, pp. 4700-4708. https://doi.org/10.1109/CVPR.2017.243
[19] Szegedy, C., Liu, W., Jia, Y., et al. (2015). Going deeper with convolutions. In 2015 IEEE Conference on Computer Vision and Pattern Recognition (CVPR), Boston, MA, pp. 1-9. https://doi.org/10.1109/cvpr.2015.7298594
[20] Sandler, M., Howard, A., Zhu, M., Zhmoginov, A., Chen, L.C. (2018). Mobilenetv2: Inverted residuals and linear bottlenecks. In 2018 IEEE/CVF Conference on Computer Vision and Pattern Recognition, Lake City, UT, USA, pp. 4510-4520. https://doi.org/10.1109/CVPR.2018.00474
[21] He, K., Zhang, X., Ren, S., Sun, J. (2016). Deep residual learning for image recognition. In 2016 IEEE Conference on Computer Vision and Pattern Recognition (CVPR), Las Vegas, NV, USA, pp. 770-778. https://doi.org/10.1109/cvpr.2016.90
[22] Fitzmaurice, C., Allen, C., Barber, R.M., et al. (2017). Global, regional, and national cancer incidence, mortality, years of life lost, years lived with disability, and disability-adjusted life-years for 32 cancer groups, 1990 to 2015: A systematic analysis for the global burden of disease study. JAMA Oncology, 3(4): 524-548. https://doi.org/10.1001/jamaoncol.2016.5688
[23] Bray, F., Ferlay, J., Soerjomataram, I., Siegel, R.L., Torre, L.A., Jemal, A. (2018). Global cancer statistics 2018: GLOBOCAN estimates of incidence and mortality worldwide for 36 cancers in 185 countries. CA: A Cancer Journal for Clinicians, 68(6): 394-424. https://doi.org/10.3322/caac.21492
[24] Garcia, M., Jemal, A., Ward, E. M., Center, M.M., Hao, Y., Siegel, R.L., Thun, M.J. (2007). Global cancer facts & figures 2007. Atlanta, GA: American Cancer Society, 1(3): 52.
[25] Howlader, N., Noone, A.M., Krapcho, M., et al. (2016). SEER cancer statistics review, 1975-2013. National Cancer Institute, 1992-2013.
[26] O'Dowd, E., Mackenzie, J., Balata, H. (2021). Lung cancer for the non-respiratory physician. Clinical Medicine, 21(6): e578. https://doi.org/10.7861/clinmed.2021-0657
[27] Moyer, V.A., US Preventive Services Task Force. (2012). Screening for prostate cancer: US preventive services task force recommendation statement. Annals of Internal Medicine, 157(2): 120-134. https://doi.org/10.7326/0003-4819-157-2-201207170-00459
[28] Manser, R., Irving, L.B., Stone, C., Byrnes, G., Abramson, M., Campbell, D. (2001). Screening for lung cancer (Cochrane Review). The Cochrane Library.
[29] National Lung Screening Trial Research Team. (2011). Reduced lung-cancer mortality with low-dose computed tomographic screening. New England Journal of Medicine, 365(5): 395-409. https://doi.org/10.1056/nejmoa1102873
[30] Shiraishi, J., Li, Q., Appelbaum, D., Doi, K. (2011). Computer-aided diagnosis and artificial intelligence in clinical imaging. Seminars in Nuclear Medicine, 41(6): 449-462. https://doi.org/10.1053/j.semnuclmed.2011.06.004