Synthesis of Honeycomb-Shaped LiNi0.5Mn0.5O2 Using a Sol-Gel Method with Polymethylmethacrylate (PMMA) and Organic Surfactant

Seon-Jin Lee | Hea-in Kim | Eui-Jeong Park | Jong-Tae Son*
© 2022 IIETA. This article is published by IIETA and is licensed under the CC BY 4.0 license (http://creativecommons.org/licenses/by/4.0/).
OPEN ACCESS
Layered-structural LiNi0.5Mn0.5O2 has high discharge capacity, abundant availability, enhanced chemical stability, convenient environmental benignancy, and low cost. However, LiNi0.5Mn0.5O2 suffers from poor intrinsic rate capability due to its poor ionic conductivity (2.54 × 10⁻⁷ S/cm) and poor cycle stability owing to the volume change of the cathode materials during cycling. To address this issue, honeycomb-shaped LiNi0.5Mn0.5O2 was developed for lithium-ion batteries using a sol-gel method with spherical polymethylmethacrylate (PMMA) particles. PMMA particles provide spherical voids in LiNi0.5Mn0.5O2 cathode materials due to their relatively low decomposition temperature (< 350 °C). Honeycomb-shaped LiNi0.5Mn0.5O2 has a higher surface area (2.63 m2/g) than the LiNi0.5Mn0.5O2 (2.00 m2/g) produced by conventional sol-gel method. The initial discharge capacities of conventional nano LiNi0.5Mn0.5O2 and honeycomb-shaped LiNi0.5Mn0.5O2 are 151.9 mAh g-1 and 200.4 mAh g-1, respectively at 0.1 C. After 50 cycles at 1 C, honeycomb-shaped LiNi0.5Mn0.5O2 has a larger capacity retention than conventional nano LiNi0.5Mn0.5O2, measuring 67.9% and 58.8%, respectively. The superior electrochemical performance of honeycomb-shaped LiNi0.5Mn0.5O2 increases the effective surface area for Li-ion diffusion, leading to better rate capability, and buffers the volume change during Li+ion insertion/extraction, improving the cycling stability.
cathode materials, sol-gel method, PMMA, organic surfactant, honeycomb
Lithium-ion batteries (LIBs) are gaining attention for their applications in Electronic vehicle (EV) [1–3]. Since LiNi0.5Mn0.5O2 (LNMO) was first reported by Ohzuku and Makimura [4], it has been considered promising candidates for use in LIBs. The advantageous characteristics of LNMO include high discharge capacity, abundant resources, improved chemical stability, environmental benignancy, and cost competitiveness compared to LiCoO2 [5–19]. LNMO exhibits several merits in its electrochemical performance; however, it suffers from poor intrinsic rate performance due to its poor ionic conductivity (2.54 × 10⁻⁷ S/cm [20]).
Over the past few years, some researches have sought to enhance the rate capabilities of nanostructured layer cathode materials [13–19]. Nano-sized materials exhibit higher capacities and better rate capabilities due to their shorter diffusion pathway and broader electrolyte/electrode contact areas. However, the nano-sized particles in these studies were exfoliated from the Al current collector during repeated expansion and contraction due to volume change. Therefore, it is preferable to study the surface area without reducing the particle size.
In this study, honeycomb-shaped LNMO (H-LNMO) was developed by using the sol-gel method with spherical polymethylmethacrylate (PMMA) particles and organic surfactant. The PMMA particles provide voids in LNMO after calcination due to the lower decomposition temperatures of the particles (< 350 °C). In addition, the inner carbon layer is generated by decomposing the PMMA particles and organic surfactant during the calcining process. H-LNMO has a larger specific surface area (2.69 m2/g) than conventional nano LNMO (C-LNMO) (2.00 m2/g) because its honeycomb-shaped design generates a wide surface area without reducing the particle size to prevent exfoliation by an Al current collector [22-24]. This leads to improved ionic conductivity due to enhanced insertion and desorption of Li+ions, and consequently, significantly improved discharge capacity and cycle stability compared to conventional nanoparticles.
2.1 Preparation of LiNi0.5Mn0.5O2
The chemicals used for the initial steps of citrate gel synthesis were LiNO3 : 1.379g, (Aldrich) Ni(NO3)26·H2O : 2.907g (Aldrich), Mn(NO3)2 ·4H2O : 2.587g (Aldrich, 97%), and C6H8O7 : 7.7628g (Aldrich, 99%).
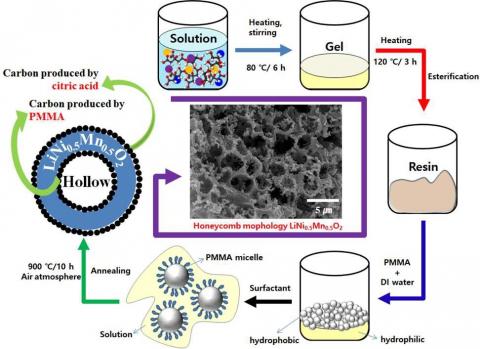
The overall procedure for the preparation of LNMO is shown in Scheme 1. The initial materials were dissolved in deionized (DI) water and stirred for 6 h at 80 °C to form a Seon-Jin Lee et al. / J. New Mat. Electrochem. Systems sticky gel. The gel precursors were then dried in an oven for 3 h at 120 °C to form a resin-like sponge. The resin precursors were dissolved in DI water again, after which commercially available PMMA (ASP Corp., Korea) was added to the solution (1:1 vol. ratio). To dissolve the hydrophobic PMMA in the hydrophilic solution, polyoxyethylene (10) tridecyl ether (Aldrich) was added as a surfactant, and the solution was mixed until a paste formed. The resulting paste was calcinated at 900 °C for 10 h in open air to obtain H-LNMO.
Scheme 1. Flow chart depicting the preparation of H- LNMO.
2.2 Material characterization
X-ray diffraction (XRD) patterns for the cathodes were obtained using a Siemens D–5000 diffractometer in the 2θ range from 10° to 80 ° with Cu Kα radiation (λ = 1.5406 Å). The morphology of the powder was observed using a JSM– 7610F scanning electron microscope (SEM). The particle size distribution was measured using a particle size analyzer (CILAS, 1090L).
2.3 Electrochemical test
To prepare the positive electrode, a mixture of 80%LNMO powder, 10% super-P carbon black (Sigma–Aldrich), 10% polyvinylidene difluoride (Kureha KF100) binder was added to a crucible and ground.
The resulting viscous slurry was spread on an aluminum foil using a doctor blade to achieve uniform thickness. The film was then dried at 120 °C for 4 h in a vacuum oven.
Afterwards, the CR2032-type coin cell was assembled in a glove box from the cathode film, a lithium metal foil, a porous polypropylene film, and a 1 M LiPF6 solution in ethylene carbonate (EC)/dimethyl carbonate (DMC) mixture (volume ratio = 3:7).
Lithium metal foil was used as the counter and reference electrodes, respectively. After the coin cell assembly, the test cells were charged and discharged galvanostatically between 3.0 and 4.6 V versus Li/Li+ at a constant current density (17 mAg-1 at a rate of 0.1 C). Cycle performances were carried out at a high current density (170 mAg-1 at a rate of 1 C rate). Volume of electrolyte: 0.2ml, Ar atmosphere, glove box brand :korea kiyon , glove box moisture content: 0.4ppm.
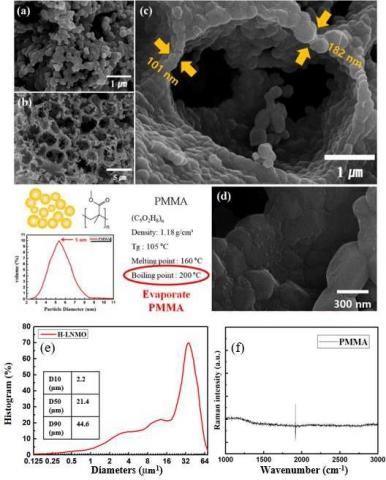
Figure 1 (a) shows an SEM image of the as-prepared C- LNMOThe average particle size of C-LNMO was estimated to be 100–300 nm. The PMMA decomposition process at a temperature of 200 °C (Figure 1 (b)) shows that the honeycomb structure of H-LNMO is formed by evaporation before reaching the synthesis temperature. The average diameter of PMMA measured by PSA was approximately 5 μm. The pore diameters within the LNMO were 4.12 μm on average, similar to the particle size of PMMA. Figure 1(e) shows the average particle size of honeycomb-shaped LiNi0.5Mn0.5O2. The average size is 21.42 µm. Figure 1 (f) there is no carbon peak of PMMA. It is considered that the carbon peak is not observed because PMMA is an amorphous material.
Figure 1. SEM images of (a) conventional nano (C- LNMO)and (b) honeycomb-shaped LiNi0.5Mn0.5O2 (H- LNMO) materials. (Inset (c) is an expanded image of (b), and inset (d) is an expanded image of (c)). (e) PSA images of honeycomb-shaped LiNi0.5Mn0.5O2 (f) Raman spectra of PMMA in 1000-3000cm-1
This result suggests that the solid-state diffusion length of Li+ in H-LNMO is shorter than that of Li+ in C-LNMO. These factors indicate that H-LNMO has significantly improved rate performance compared to C-LNMO.
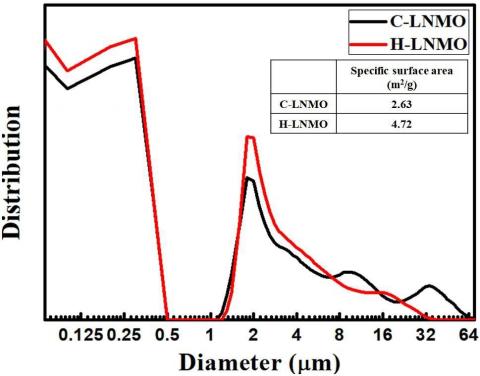
Figure 2. Particle size distributions and specific surface areas of C-LNMO and H-LNMO.
The particle size distribution of the as-synthesized C- LNMO and H-LNMO samples was measured by PSA, shown in Figure 2. The primary particles were nano-sized. However, the secondary particles were agglomerated and ranged in size from 1.1 to 64 μm. H-LNMO had smaller aggregated particle sizes than C-LNMO due to CO2 and O2 gas generated by the evaporation of PMMA. The gases can physically block particle agglomeration. The specific surface area was also measured. H-LNMO had a larger specific surface area (4.72 m2/g) than C-LNMO (2.63 m2/g) due to the reduction in aggregated secondary particle size and the shape of the pores, as shown in the SEM images.
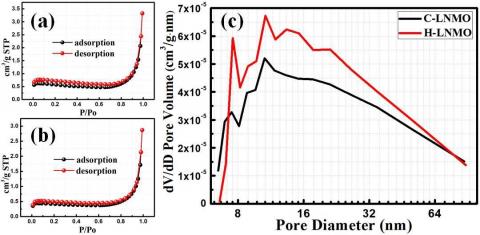
Figure 3. Nitrogen adsorption and desorption isotherms for (a) C-LNMO and (b) H-LNMO, and (c) the corresponding pore size distribution curve determined.
The Brunauer–Emmett–Teller (BET) specific surface areas ofC-LNMO and H-LNMO were measured using N2 adsorption–desorption isotherms at 77K (Figure 3 (a) and (b)). Notably, C-LNMO had a BET surface area of 2.00 m2g−1, which was muchsmaller than that of H-LNMO (2.69 m2g−1).
In addition, the pore-size distribution analysis shown in Figure 3(c) indicated that H-LNMO possessed a relatively larger pore size distribution. These results showed that spherical PMMA can inhibit the aggregation of nanoparticles and dramatically increase the surface area.
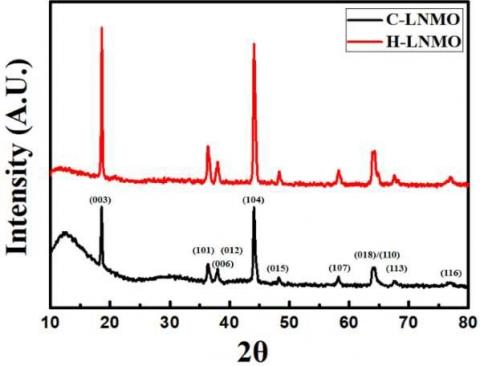
Figure 4. (a) XRD patterns of C-LNMO and H-LNMO cathode materials.(b)
Table 1. Lattice parameters of C-LNMO and H-LNMO
|
Sample |
a (Å) |
c (Å) |
Volume (Å3) |
|
C-LNMO |
2.895 (± 0.004) |
14.166 (± 0.013) |
102.778 |
|
H-LNMO |
2.895 (± 0.003) |
14.142 (± 0.009) |
102.634 |
Figure 4. shows the XRD patterns of the as-synthesized C- LNMO and H-LNMO samples. The diffraction peaks of both C-LNMO and H-LNMO indicated a pristine hexagonal structure with an R3m space group. With the same synthetic solution, a fairly broad peak was observed around 13° for C- LNMO, whereas a weak peak was observed in the same location for H-LNMO. It is speculated that the difference in peak strengths occurs due to O2 gas produced by the evaporation of PMMA reacting with the carbon residue. As a result, the thickness of the carbon coating can be controlled by varying the volume of PMMA.
Table 1 lists the lattice parameters of the C-LNMO and H- LNMO samples. Although H-LNMO had a larger surface area than C-LNMO, there was no significant change in the size of the lattice parameters.
Figure 5. (a) Initial charge–discharge curves and (b) differential capacity versus voltage plots of C-LNMO and H-LNMO in the voltage range 3.0–4.6 V at 0.1 C. (c) Rate capabilities of C-LNMO and H-LNMO. (d) Discharge capacity versus cycle number of C-LNMO and H-LNMO cycled at 1 C in the voltage range 3.0–4.6 V at 25 °C.
As shown in Figure 5 (a), the initial charge–discharge capacities of C-LNMO and H-LNMO were evaluated between 3.0 and 4.6 V at a constant current density of 17 mAg−1 (rate of 0.1 C) and a temperature of 25 °C. The initial discharge capacities of C-LNMO and H-LNMO were 151.9 mAhg−1 and 200.4mAhg−1, respectively. The differential capacity versus voltage plot (Figure 5 (b)) illustrates the polarization between the charge–discharge peaks of C- LNMO and H-LNMO, at 89 mV and 110 mV, respectively. Figure 5 (c) shows the rate capabilities of C-LNMO and H- LNMO. The rate performance of H-LNMO was higher than that ofC-LNMO for all C-rate ranges.
Figure 5 (d) shows the discharge capacities versus cycle number of C-LNMO and H-LNMO when the materials were evaluated in the voltage range 3.0–4.6 V at a constant current density of 170 mAg−1 (rate of 1 C) and a temperature of 25°C.
After 50 cycles, the remaining capacity of H-LNMO (67.9%) was higher than that of C-LNMO (57.8%). These results suggest that smaller grains in the composite shorten the diffusion lengthof Li+, and macro-pores and a wide specific surface Seon-Jin Lee et al. / J. New Mat. Electrochem. Systems area improve the interfacial contact between the electrode and electrolyte [25].
In addition, the enhanced cycle stability suggests that the structure of H-LNMO induces volume expansion and contraction to the inner cavities during cycling, thereby preventing the exfoliation of the electrode from the Al current collector. This shows improved ionic conductivity due to enhanced insertion and desorption of Li+ ions, and consequently, significantly improved electrochemical performance compared to conventional nanoparticles.
Table 2. Film resistance of the surface membrane (RSEI) and charge-transfer resistance (Rct) of C-LNMO and H-LNMO by Nyquist circles
|
Sample |
RSEI (Ω) (before cell test) |
Rct (Ω) (before cell test) |
RSEI (Ω) (after 50 cycles) |
Rct (Ω) (after 50 cycles) |
|
C-LNMO |
76.05 |
254.62 |
71.36 |
599.62 |
|
H-LNMO |
32.33 |
299.88 |
8.12 |
11.86 |
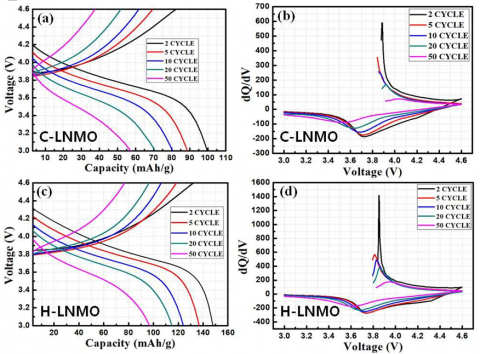
Figure 6. (a), (c) Initial charge–discharge curves and (b), differential capacity versus voltage plots of C-LNMO and H-LNMO in the voltage range from 3.0 to 4.6 V at 1 C. Peak voltage of differential capacity plots versus cycle number.
Figure 6 illustrates various behaviors that confirm the benefits of increased surface area. Figure 6 (a) and (c) depict initial charge–discharge curves and Figure 6 (b) and 6 (d) show differential capacity patterns versus voltage from 3.0 to 4.6 V at 1 C.
Figure 6 (e) illustrates the peak voltages of the differential capacity plots versus cycle number. In both samples, the overvoltage increases as the cycles progress; however, the overvoltage of H-LNMO is noticeably less than that of C- LNMO.
The overvoltages at 20 cycles were 275 mV and 160 mV for C-LNMO and H-LNMO, respectively, and the overvoltages at 50 cycles were 526 mV and 340 mV, respectively. The differences between the overvoltages of C-LNMO and H- LNMO in cycles 20 and 50 were 115mV and 186mV, respectively. This result is evidence that the honeycomb- shaped structure facilitates the diffusion of Li+ as the cycles progress.
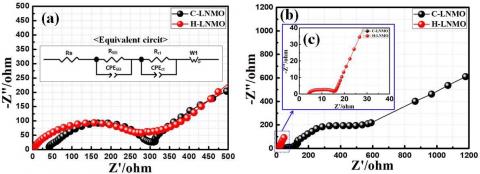
Figure 7. Impedance plot of C-LNMO and H-LNMO electrodes (a) before the cell test and (b) after 50 cycles at the state of charge = 0. (c) Inset figure displaying the enlarged Nyquist circles at higher frequencies.
Figure 7 shows the AC impedance spectrum and Nyquist plot which demonstrate the improved electrochemical performance of the half-cell. The impedance results were interpreted using an equivalent circuit.
In Figure 7 (a), Rs is the ohmic resistance of the electrolyte solution, RSEI is the film resistance of the surface membrane, and Rct is the charge-transfer resistance at the electrolyte [26,27].
Figure 7 (a) shows the Nyquist plot before the cell test. The RSEI values of C-LNMO and H-LNMO were 76.05 Ω and 32.33 Ω, respectively, and the Rct values were 254.62 Ω and 299.88 Ω, respectively. These results are listed in Table 2. The Rct increased because the large surface area of H-LNMO helps the sufficient penetration of the electrolyte.
Figure 7 (b) shows the Nyquist plot after 50 cycles. The RSEI values of C-LNMO and H-LNMO were 71.36 Ω and 8.12 Ω, respectively, and the Rct values were 599.62 Ω and 11.86 Ω, respectively, as shown in Table 2. The reason for the drastic decrease in Rct was due to the increased number of Li+ diffusion paths resulting from the large surface area of H- LNMO.
H-LNMO was successfully synthesized using a sol-gel method with PMMA and an organic surfactant. The XRD results indicated an α-NaFeO2 structure. The primary particle sizes of C-LNMO were approximately 100–300 nm. The wall thickness of H-LNMO was approximately 142 nm. The specific surface areas of the as-synthesized C-LNMO and H- LNMO samples were 2.00 m2g−1 and 2.69 m2g−1, respectively. The initial discharge capacities of C-LNMO and H-LNMO were 151.9 m2g−1 and 200.4 mAh g−1, respectively. The rate performance of H-LNMO was higher than that of C-LNMO for all C-rate ranges. The large specific surface area and the short Li+ diffusion pathways of H-LNMO incresed ionic conductivity due to enhanced insertion and desorption of Li+ ions and improved the discharge capacity and rate performance of the material compared to conventional nanoparticles.
Financial support for this study was granted by the Ministry of SMEs and Startups, the Republic of Korea (S2928638), and the National Research Foundation of Korea (NRF), which is funded by the Korean government (MSIT) (No. 2021R1F1A1063481). Additional financial support was provided by the Technology Innovation Program (or Industrial Strategic Technology Development Program- Material Parts Technology Development Project) (20003747, Development of high-performance cathode material manufacturing technology through valuable metal upcycling from waste battery and waste cathode material), which is funded by the Ministry of Trade, Industry & Energy (MOTIE, Korea).
|
°C |
temperature |
|
g |
weight |
|
V |
Voltage |
|
Greek symbols |
|
|
λ |
wavelength |
|
θ |
angle |
|
µ |
Micro- (one millionth) |
[1] Balke, N., Jesse, S., Morozovska, A., Eliseev, E., Chung, D., Kim, Y., Adamczyk, L., García, R., Dudney, N. and S., Kalinin. (2010). Nanoscale mapping of ion diffusion in a lithium-ion battery cathode. Nature Nanotechnology, 5(10): 749-754.
[2] Kim, S., Yun, J., Son, B., Lee, Y., Kim, K., Lee, Y., Cho, K. (2014). Graphite/silicon hybrid electrodes using a 3D current collector for flexible batteries. Advanced Materials, 26(19): 2977-2982.
[3] Wang, M., Li, X., Gao, M., Pan, H., Liu, Y. (2014). A Novel synthesis of MgS and its application as electrode material for lithium-ion batteries. Journal of Alloys and Compounds, 603: 158-166.
[4] Wu, Y., Gao, M., Li, X., Liu, Y., Pan, H. (2014). Preparation of mesohollow and microporous carbon nanofiber and its application in cathode material for lithium–sulfur batteries. Journal of Alloys and Compounds, 608: 220-228.
[5] Gu, Y., Chen, Y., Liu, H., Wang, Y., Wang, C., Wu, H. (2011). Structural characterization of layered LiNi0.85−xMnxCo0.15O2 with x=0, 0.1, 0.2 and 0.4 oxide electrodes for Li batteries., Journal of Alloys and Compounds, 509(30): 7915-7921.
[6] Islam, M., Davies, R., Gale, J. (2003). Structural and electronic properties of the layered LiNi0.5Mn0.5O2 lithium battery material. Chemistry of Materials, 15(22): 4280- 4286.
[7] Fergus, J. (2010). Recent developments in cathode materials for lithium ion batteries. Journal of Power Sources, 195(4): 939-954.
[8] Li, D., Yuan, C., Dong, J., Peng, Z., Zhou, Y. (2007). Synthesis and electrochemical properties of LiNi0.85−xCoxMn0.15O2 as cathode materials for lithium-ion batteries. Journal of Solid State Electrochemistry, 12(3): 323-327.
[9] Gao, D., Li, Y., Lai, X., Bi, J., Lin, D. (2011). Room- temperature synthesis of crystallized LiCoO2 thin films by electrochemical technique. Journal of Alloys and Compounds, 509(3): 697-703.
[10] Ohzuku, T., Makimura, Y. (2001). Layered lithium insertion material of LiNi1/2Mn1/2O2: a possible alternative to LiCoO2 for advanced lithium-ion batteries. Chemistry Letters, 30(8): 744-745
[11] Ahn, W., Lim, S., Jung, K., Yeon, S., Kim, K., Song, H., Shin, K. (2014). Combustion-synthesized LiNi0.6Mn0.2Co0.2O2 as cathode material for lithium ion batteries. Journal of Alloys and Compounds, 609: 143- 149.
[12] Lu, Y., Jiang, Y., Yang, Z., Han, J., Huang, Y. (2013). Ma, J. Polymer-assisted synthesis of LiNi2/3Mn1/3O2 cathode material with enhanced electrochemical performance. Journal of Alloys and Compounds, 559: 203- 208.
[13] Hwang, B., Yu, T., Cheng, M., Santhanam, R. (2009). Rapid microwave-enhanced ion exchange process for the synthesis of LiNi0.5Mn0.5O2 and its characterization as the cathode material for lithium batteries. Journal of Materials Chemistry, 19(26): 4536-4544.
[14] Liu, Y., Chen, B., Cao, F., Zhao, X., Yuan, J. (2011). Synthesis of nano architectured LiNi0.5Mn0.5O2 spheres for high-performance rechargeable lithium-ion batteries via an in situ conversion route. Journal of Materials Chemistry, 21(28): 10437-10441.
[15] Lu, X., Sun, Y., Jian, Z., He, X., Gu, L., Hu, Y., Li, H., Wang, Z., Chen, W., Duan, X., Chen, L., Maier, J., Tsukimoto, S., Ikuhara, Y. (2012). New insight into the atomic structure of electrochemically delithiated O3-Li(1– x)CoO2 (0 ≤ x ≤ 0.5) nanoparticles. Nano Letters, 12(12): 6192-6197.
[16] Shannon, R. (1976). Revised effective ionic radii and systematic studies of interatomic distances in halides and chalcogenides. Acta Crystallo graphica Section A, 32(5): 751-767.
[17] Reimers, J. (1992). Electrochemical and in situ X-Ray diffraction studies of lithium intercalation in LixCoO2. Journal of The Electrochemical Society, 139(8): 2091- 2097.
[18] Amatucci, G. (1996). CoO2, The end member of the LixCoO2 solid solution. Journal of The Electrochemical Society, 143(3): 1114-1123.
[19] Li, H., Yabuuchi, N., Meng, Y., Kumar, S., Breger, J., Grey, C., Shao-Horn, Y. (2007). Changes in the cation ordering of layered O3 LixNi0.5Mn0.5O2 during electrochemical cycling to high voltages: an electron diffraction study. Chemistry of Materials, 19(10): 2551- 2565.
[20] Xia, H., Tang, S., Lu, L. (2008). Novel synthesis and electrochemical behavior of layered LiNi0.5Mn0.5O2. Journal of Alloys and Compounds, 449(1-2): 296-299.
[21] Meng, X., Dou, S., Wang, W. High power and high capacity cathode material LiNi0.5Mn0.5O2 for advanced lithium-ion batteries. Journal of Power Sources, 184(2): 489-493.
[22] Zhang, X., Jiang, W., Mauger, A., Qilu, Gendron, F., Julien, C. (2010). Minimization of the cation mixing in Li1+x(NMC)1−xO2 as cathode material. Journal of Power Sources, 195(5): 1292-1301.
[23] Song, M., Park, C., Park, H., Mumm, D. (2012). Variations in the electrochemical properties of metallic elements-substituted LiNiO2 cathodes with preparation and cathode fabrication conditions. Electronic Materials Letters, 8(1): 37-42.
[24] Song, M., Park, C., Yoon, S., Park, H., Mumm, D. The effects of C-rate on the discharge capacities of LiNi1−yMyO2 (M=Ni, Ga, Al and/or Ti) cathodes. Electronic Materials Letters, 5(4), 151-155: (2009).
[25] Lee, K., Myung, S., Prakash, J., Yashiro, H., Sun, Y. (2008). Optimization of microwave synthesis of Li[Ni0.4Co0.2Mn0.4]O2 as a positive electrode material for lithium batteries. Electrochimica Acta, 53(7): 3065-3074.
[26] Cai, L., Liu, Z., An, K., Liang, C. (2012). Probing Li-Ni cation disorder in Li1−xNi1+x−yAlyO2 cathode materials by neutron diffraction. Journal of The Electrochemical Society, 159(7): A924-A928.
[27] Stoyanova, R. (2000). Aluminium coordination in LiNi1−yAlyO2 solid solutions. Solid State Ionics, 128(1-4): 1-10.