L. Colaco | M. Turakhia | J. Butani | A. Sengar | L. Mutreja | P. Kamat*
© 2026 The authors. This article is published by IIETA and is licensed under the CC BY 4.0 license (http://creativecommons.org/licenses/by/4.0/).
OPEN ACCESS
A precise and automated evaluation of ripeness level and grading of mangoes is necessary for effective post-harvest management and accurate price determination in the market. However, the majority of available solutions consider them as separate, unimodal classification problems. A multimodal, multitask Artificial Intelligence (AI) framework is proposed for automated mango grading, integrating Red, Green, and Blue (RGB) images and their weight to simultaneously predict the maturity stage and the Malaysian grade. A thorough investigation of different machine learning techniques and fusion methods demonstrates that the Gradient Boosting algorithm with early fusion provides consistent results, obtaining accuracy scores of 97.1% and 91.3% for ripeness and quality classification, respectively. An agent-assisted rule-based layer is introduced for intelligent preprocessing of inputs that filters low-quality images, validates the correct fruit perspective, and assigns appropriate weights for proper inference. In addition, goal-oriented interactions allow users to provide prompts regarding the task at hand (e.g., buying or selling) and receive ranked lists of selected mango samples with predicted prices. In this regard, the proposed solution integrates predictive analysis with decision-making processes of farms by enabling accurate classification, effective pricing, and proper recommendation-based decisions, thereby assisting in the emergence of an intelligent post-harvest system.
Artificial Intelligence, decision support systems, Gradient Boosting, multimodal fusion, multitask classification, precision agriculture
In farming, accurate estimation of the quality and maturity of fruits is essential in the post-harvest phase of production as well as the price evaluation process. For mangoes, these features are key determinants of their preference, usability, and price [1]. The conventional practice of grading commercial mangoes in Malaysia mainly utilizes visual inspection, depending upon parameters like maturity level, outer appearance, size, and any visible flaws in their surface. This procedure is time-consuming, biased, and may lead to inconsistent results because of differences among the operators as well as inherent differences in fruits themselves.
Thus, there exists a need for a smart automated grading system for commercial purposes. In recent times, as a response to the emerging requirements in precision agriculture, the need for automation and a data-oriented approach in assessing these characteristics of fruits is on the rise. With recent advancements in machine learning and computer vision, automated fruit classification systems have been developed, especially by using images [2]. However, the current systems mainly classify fruits using the unimodal technique, where the prediction of these qualities is seen as distinct from each other. In this system, the physical and physiological state of the fruit is not fully considered; the inclusion of additional information, such as the weight of the fruit, improves such classifications [3].
To overcome the mentioned challenges, the suggested research employs a multimodal and multitask learning system. In this approach, the visual features of mango images are combined with weight features to predict maturity and quality, leading to increased prediction accuracy. A machine learning system is suggested for combining multimodal features and making predictions based on multimodal data. Also, the rule-based agentic Artificial Intelligence (AI) system is employed to improve the intelligence level of the system through input validation, feedback, and decision-making processes. The suggested system is capable of evaluating the image quality, guaranteeing proper data acquisition, and providing recommendations to the user at any time. Through the combination of multimodal learning, multitask prediction, and agentic intelligence, the suggested system goes beyond classification approaches.
In this section, the current literature (Table 1) is critically analyzed to comprehend the developments in intelligent agriculture. The objective here is to identify the shortcomings within the current methods in order to develop the scope of this study. The recent innovations in agriculture highlight the increasing trend in the use of multimodal and multitask architectures complemented with an agent-assisted decision support module. Table 1 outlines how different types of data and various learning systems, along with the methodologies behind such system paradigms, are used to increase predictive power in areas such as disease detection [4], climate recommendation [5], crop suggestion [6, 7], and fruit grading [8]. The distinct trend towards the use of fusion and hybrid methodologies and the incorporation of heterogeneous data and models provides optimal results. Moreover, agentic intelligence in agriculture has allowed the creation of adaptable, context-aware, and real-time solutions.
Table 1. Multimodal and multi-task fruit classification
|
Paradigm |
Input |
Output |
Dataset |
Rule-Based Agent |
Algorithm |
Fusion Technique |
Accuracy |
Ref. |
|
Multimodal |
Image, Text |
Disease detection, Classification |
Sugarcane Disease Image Dataset (~10,000 images collected) |
•Image quality check. •Tool selection based on task type. •Task-specific decision (e.g., diagnosing disease type). |
Vision-language Pretraining |
Fusion of vision and language data |
94.84% |
[4] |
|
Multi-Task |
Climate data, user inputs |
Climate adaptation recommendations, queries |
Agricultural data from multiple sources (Online dataset) |
•Context-aware decisions based on user inputs (e.g., location, climate data). •Dynamic agent feedback. |
Multi-agent system |
Hybrid fusion |
Not mentioned |
[5] |
|
Multi-Task |
Soil images, environmental data |
Soil classification, crop suggestion, fertilizer recommendation |
Soil dataset, crop dataset (2,200 crop collected samples) |
•Context-aware decision-making for crop selection. •Fertilizer recommendation based on dynamic weather data. |
MobileNet-V2, ResNet, XGBoost |
Feature-level fusion |
94.7% for fertilizer recommendation |
[6] |
|
Multimodal |
Soil data, environmental data |
Crop yield predictions, fertilizer suggestions |
Soil, crop datasets (~5,000 online images) |
•Real-time decision-making using environmental data. •Weather forecasts for personalized crop and fertilizer recommendations. |
Random Forest, CNN, DNN |
- |
92.4% for crop suggestion |
[7] |
|
Multi-Task |
RGB images, weight data |
Maturity classification |
Mango, banana, peach, tomato |
•Decision-making based on image quality to retake photo if blurry or wrong angle. |
VGG16, DenseNet121, YOLOv7-tiny |
Late fusion |
96.39% (validation) |
[8] |
Although multimodal and multitask learning have demonstrated significant improvements in classifying fruits, some of the crucial issues associated with this process remain unaddressed. These encompass the problem of integrating data in real time [9], decision-making based on different environmental situations, and scalability in agriculture. The current paper attempts to develop a system that integrates multimodal, multitask learning, and a rule-based decision support module for mango classification.
Despite advancements, the following are the critical gaps in the existing research:
•Lack of research on multimodal Mango fruit classification.
•Limited study in an integrated multimodal and multitask fruit grading framework.
•Insufficient integration of automated decision support for real-time agricultural systems.
This research paper addresses the above-mentioned gaps by introducing a multimodal multitask learning architecture using weights and images for mango categorization. Furthermore, the rule-based agent helps improve decision-making by giving feedback about the inputs, thus ensuring more reliable data sources. This approach is capable of providing an interactive environment for the users, who have the choice to either buy or sell mangoes based on the recommendations provided by the system through price prediction. This model has been developed to work well in resource-constrained agricultural environments.
This section outlines the characteristics of the dataset, the structure of the model proposed in this research, and the procedures adopted in the model training. It provides information regarding the data gathering process and analysis, and the training and validation approach adopted.
3.1 Dataset description
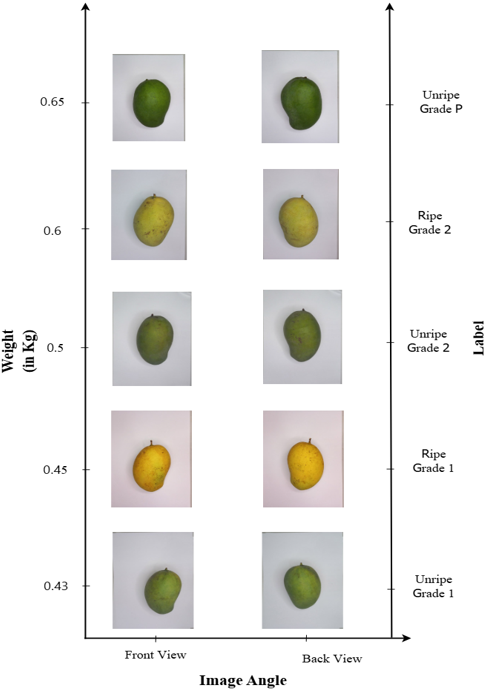
The mango dataset comprises 276 data points, where each data point is associated with two images, front and back, of the respective mango, along with its weight value. These are labeled based on their ripeness level (P- Unripe, K- Ripe) and Malaysian Standard (MS) grade (P, 1, 2). The size of the classes of the given dataset is depicted in Table 2. The images have various colors, textures, and lighting, which are useful for classification, whereas the weights provide information regarding the physical properties of the fruit. Figure 1 shows some of the representative samples from the mango datasets being used in the current study. The dataset used in the current study can be accessed at https://www.kaggle.com/code/mypapit/harumanis-mango-mass-weight-estimation-from-photo.
Table 2. Class-wise sample size distribution
|
Mango Samples |
Unripe |
Ripe |
Grade 1 |
Grade 2 |
Grade P |
|
276 |
184 |
92 |
115 |
108 |
53 |
Figure 1. Representative examples of the mango dataset
Each of the mango samples is made up of front and back Red, Green, and Blue (RGB) images, making a total of 552 images. Data augmentation is performed using random rotation, flip, and changing brightness to increase the number of images to 1,656 images. During the partition of the dataset, the GroupShuffleSplit approach is used, where the mango sample is taken as the group. As a result, each image related to the same mango sample, including its augmented form, is allocated to either the training or test set exclusively. The dataset was, therefore, split into 1,242 images for training and 414 images for testing.
3.1.1 Image pre-processing
The images of the mango fruits are resized into the dimensions of 224 × 224 pixels for uniformity in all samples. The visual feature extraction consisted of three types of complementary features. Color features were extracted based on color histograms that provided the distributions of hue, saturation, and intensity components [10]. Texture features were extracted through Gray-Level Co-occurrence Matrix (GLCM)-based techniques like contrast, correlation, energy, and homogeneity. Moreover, statistical measures like mean, standard deviation, skewness, and kurtosis were extracted to analyze the intensity distribution [11]. The feature set obtained from the front and back images are then concatenated together to create one feature vector that is further fused with normalized weight features. The feature vector obtained from each image is as follows:
$F_i=\left[f_1, f_2, f_3, \ldots \ldots, f_n\right]$ (1)
where, n is the number of image features. As the samples have images of mangoes from front and back view, their feature vectors are concatenated together as:
$F_{i m g}=\frac{1}{N} \sum_{i=1}^N F_i$ (2)
where, N stands for the total number of different viewpoints at which the fruit can be seen. In this study, N = 2 as the research is done on two viewpoints: front view and back view of the same mango.
3.1.2 Weight pre-processing
The mango weight data are considered as numeric attributes and are scaled and normalized to ensure uniformity in their range [12]. This ensures that the weight values play an effective role in model training without overshadowing other attributes [13]. The normalization for weight is performed through min-max normalization and it is given by:
$W_{norm}=\frac{W-W_{min}}{W_{max}-W_{min}}$ (3)
where, W is the original weight of the mango sample, Wmin is the minimum weight, while Wmax is the maximum weight found in the dataset. The process of normalization guarantees that the weight values will be within the range of [0, 1]. This allows the use of normalized weight values in conjunction with the image features to generate the input to the model.
3.2 Model architecture
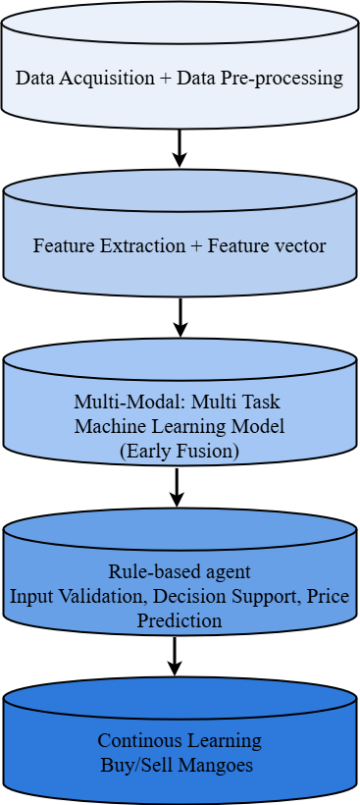
The suggested architecture, as illustrated in Figure 2, adopts an organized pipeline for intelligent decision support in mango fruit analysis. The first stage entails acquiring data and preprocessing image and weight data [14]. Feature extraction transforms the input features into discriminative feature vectors, which are combined using an early fusion approach and fed to a multimodal multitask learning classifier for predicting maturity and quality simultaneously [15]. The rule-based module acts as a validator and helps in making decisions. The recommendation and decision support component allows the system to evolve with time, with suitable buying and selling decisions [16].
Figure 2. Multimodal mango analysis framework
3.2.1 Multimodal-multitask Gradient Boosting pipeline
Figure 3. Early fusion Gradient Boosting architecture
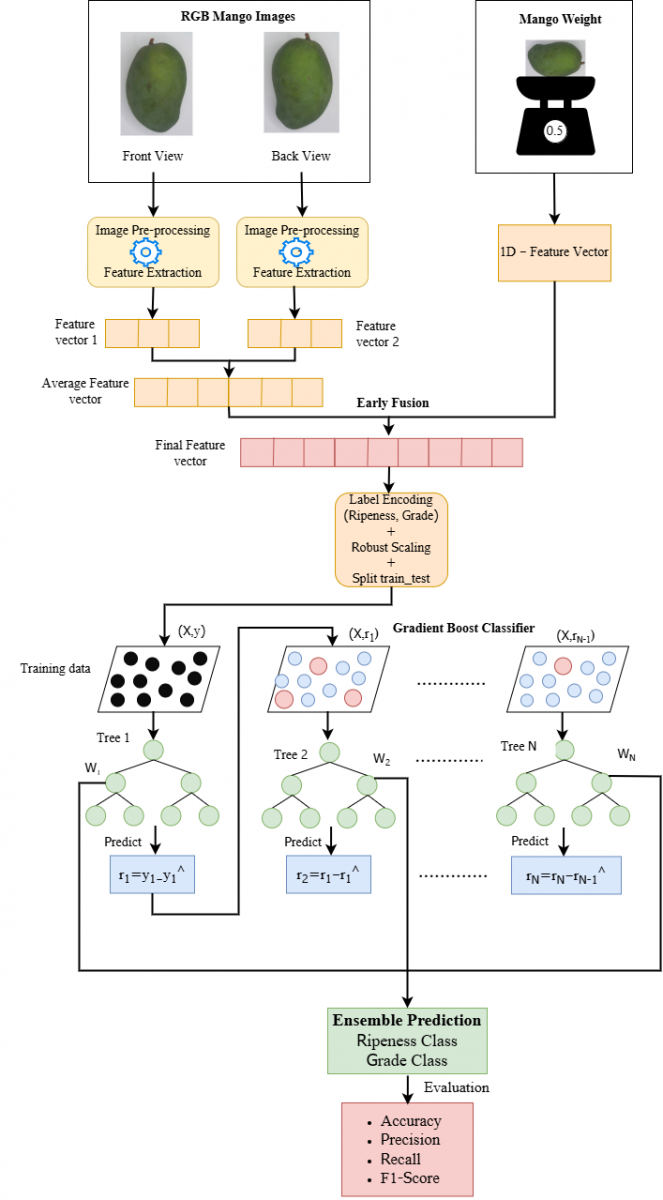
The model architecture begins by fusing diverse features at an early stage, as depicted in Figure 3. Independent feature vectors derived from different angles of an object are initially merged (for example, through averaging to mitigate viewpoint effects and variance) and subsequently combined with weighted structured feature sets to construct one high-dimensional feature vector [17]. The fused feature vector is defined as:
$F_{fusion}=F_ {img} \oplus W_{norm}$ (4)
where, ⊕ represents the concatenation symbol. The procedure enables the model to learn the relationships between modalities, hence improving the joint learning across several objectives. The fused features are then processed using the Gradient Boosting algorithm that includes the construction of Decision Trees (DTs) in stages. The first stage of the procedure involves the construction of a prediction model:
$F_0(x)=\arg \min _{\{\gamma\}} \sum_{i=1}^N L\left(y_i, \gamma\right)$ (5)
where, γ represents the constant prediction value, N is the total number of training examples, L is the loss function and yi represents the true class label. Initially, the model makes a base prediction using the selected loss function on all the training examples. This baseline is used as a starting point for boosting. Then, the residual error at the mth iteration becomes:
$r_{i m}=-\left[\frac{\delta L\left(y_{i,} F\left(x_i\right)\right)}{\delta F\left(x_i\right)}\right]$ (6)
In each iteration, the tree learns to fit the residuals from the preceding model, minimizing loss through the assignment of weights to weak learners and optimal splitting of the most significant features [18]. The model is then updated to:
$F_m(x)=F_{m-1}(x)+\eta h_m(x)$ (7)
where, $\eta$ is the learning rate, $F_{m-1}(x)$ is the previous model and $h_m(x)$ is the newly trained DT. The prediction function of the model is updated based on the addition of the weighted contribution of the new weak learner.
3.2.2 Agentic logic and decision making
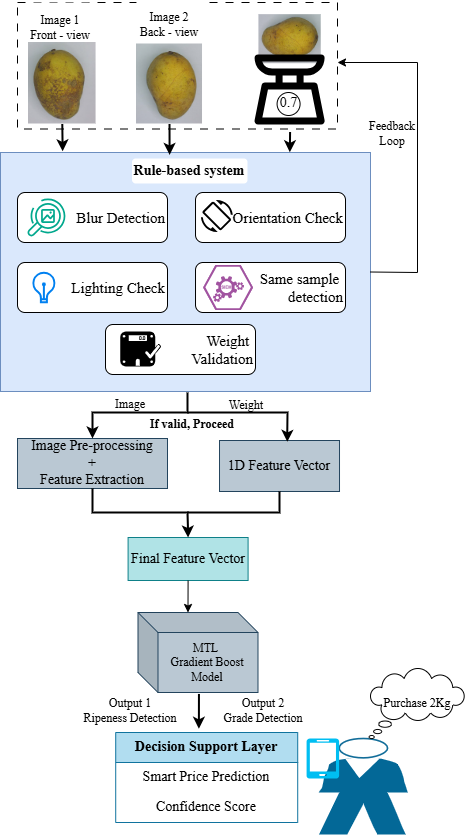
The suggested framework, as presented in Figure 4, incorporates the design of an agentic input validation unit for ensuring the accuracy and reliability of mango evaluation. Multi-view RGB images and weight values are initially fed into an agentic framework that automatically executes a quality assurance process. This includes operations such as blur detection, alignment consistency, illumination equalization, duplication/sampling validation, and weight value validity verification, facilitated by the use of a closed-loop feedback system [19]. The rule-based validation module executes a set of quality tests that are predefined prior to extraction of features. The blur is detected by measuring the laplacian variance, with rejection of images that fall below the predefined value. The illumination quality is tested using the histogram brightness analysis, which helps to detect the images that are either underexposed or overexposed. The orientation is checked to confirm availability of complementary views for both front and back sides, and Structural Similarity Index Measure (SSIM) index is used to ensure that the images belong to the same sample of the fruit. Finally, the weight measurement of the fruit is checked against the predefined acceptable values, which are calculated on the basis of the dataset.
Figure 4. Rule-based decision support framework
Once the inputs are validated, task-specific feature extraction is executed, and the resultant features are combined to form a high-dimensional feature vector. The fused feature vector is then employed as the input in a multitasking Gradient Boosting approach where a sequence of optimized DTs are trained for detecting the interaction between different nonlinear features to simultaneously classify ripeness and grade [20]. The decision support system has been included to show the application of the proposed framework. The buy/sell suggestion and price forecasting system has been developed as a prototype to highlight how the system could be used in reality [21].
3.3 Experimental setup
This section deals with the evaluation of various machine learning models along with different types of fusion approaches for the classification of mango. This experiment has been conducted in three stages: baseline model comparison, fusion-based experiment, and final system selection. In the first stage, seven models have been trained by the extracted feature dataset, where Random Forest (RF), Support Vector Machine (SVM), Naive Bayes (NB), DT, k-Nearest Neighbor (KNN), Extreme Gradient (XG) Boosting, and Gradient Boosting are evaluated. The fusion-based experiments, like Multi-View and Stacking, along with ensemble-level methods, have shown some variations, making the results less reliable [22]. As per these findings, Gradient Boosting, along with the early fusion method, is considered as the classifier since they showed consistency in all scenarios [23].
Under the early fusion approach, the disparate features derived from both the RGB images and the normalized weight attribute are concatenated at the feature level to create one single feature vector. Before concatenation, all the numeric features are scaled down to the same standard to avoid biasness in any particular feature because of disparity in their magnitude. The fused feature vector holds all the relevant information pertaining to color, texture, statistical, and weight attributes and forms the common input feature vector for the Gradient Boosting classifier.
The suggested multi-task model involves a common multimodal feature representation which is obtained from early feature fusion. Two separate Gradient Boosting models are then trained for ripeness classification and Malaysian grade classification respectively, thereby sharing the feature space but keeping task specific model parameters independent.
3.3.1 Model training
The GroupShuffleSplit strategy is employed to avoid data leakage in order to place the front and back pictures of the same fruit in the same fold. The dataset is split into 75% training (1242 samples after augmentation) and 25% testing (414 samples). In order to validate the model’s ability to generalize, the performance of the model is evaluated through 5-fold cross-validation [24]. The feature extraction process involves the extraction of color, texture, and statistical features, which are then weighted and fused through early fusion. RobustScaler is used to scale the features in order to minimize the influence of the outliers. Initially, the training is done using default parameters of the Gradient Boosting algorithm (n_estimators = 100, learning_rate = 0.1, max_depth = 3, subsample = 1.0, loss = deviance), for both ripeness and grade predictions. The model learns step-by-step through sequential DTs, making corrections to its previous mistakes [25].
Prior studies have proved that fruit classification can be reliably accomplished through small datasets [26]. However, in the current research, the model is trained on 276 samples of mango fruits for two classifications- fruit maturity and quality assessment, by using multimodal data (images and weight). However, increasing the amount of data is important in future to generalize to different conditions under which the mangoes have been cultivated and imaged.
3.3.2 Hyperparameter tuning and optimization
The hyperparameters are adjusted in order to optimize the performance and yet maintain generalization. The main hyperparameters are nestimators, learning_rate, and max_depth, which refer to the number of trees, tree contribution, and the complexity of the model, respectively [27]. Parameter combinations are evaluated using cross-validation, with n_estimators ranging from 50 to 150, learning_rate between 0.05 and 0.2, and max_depth between 3 and 7. The results suggest that adding more estimators greater than 100 would yield marginal benefits but at the expense of additional calculations, while increasing tree depth will result in overfitting within the context of fusion. The optimal model setting is therefore (n_estimators = 100, learning_rate = 0.1, max_depth = 5).
3.4 Model evaluation
The performance of the model is analyzed using the following metrics [28]:
•Accuracy: The percentage of the number of mangoes where the model correctly predicts maturity and quality from the total number of tested mangoes.
•Precision: The percentage of mangoes classified under a certain category (e.g. "ripe good") that really belong to that category.
•Recall: Number of mangoes from the given class (for example, “overripe”) that are correctly recognized by the model.
•F1-Score: Balanced measure based on precision and recall metrics to be applied for classification tasks, in case class imbalance (e.g., ripe versus unripe) exists.
•Confusion Matrix: A table showing how many mangoes are correctly and incorrectly classified into each maturity/quality class (e.g., true ripe, false ripe, missed ripe, etc.).
In this section, the system is comprehensively analyzed with regard to its model performance under different fusion techniques, in addition to the incorporation of agent-based validation and decision-making processes. Furthermore, it also shows how the framework can be effectively implemented using a graphical user interface, including aspects such as input validation, accuracy of predictions, and usability.
4.1 Multimodal and multi-task classification
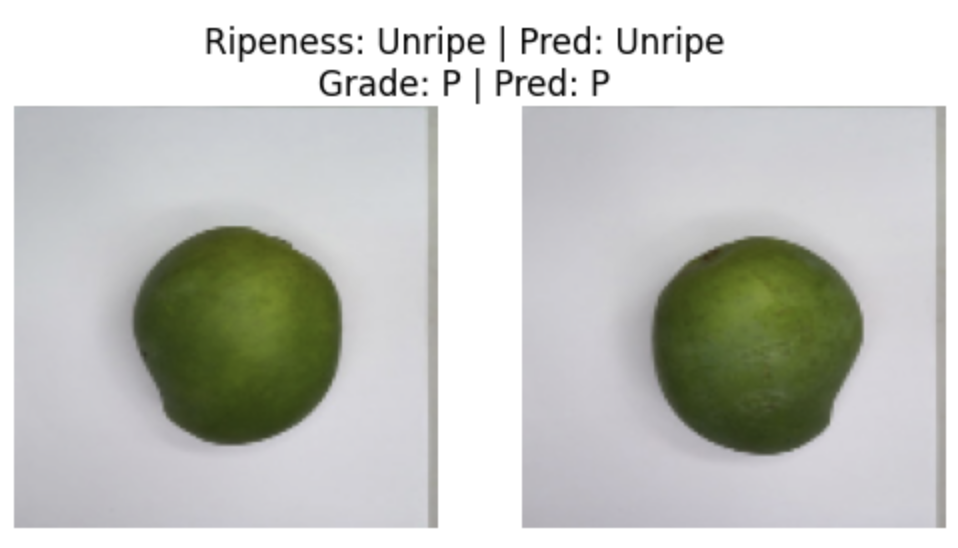
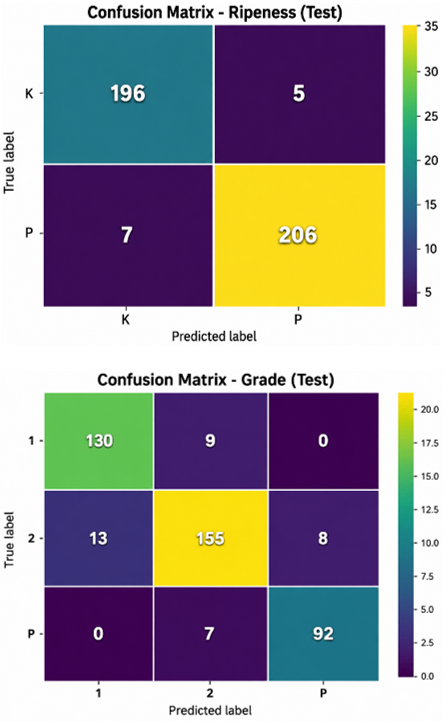
The experimental validation of the presented multimodal-multitask approach indicates consistently high and stable accuracy results in classifying fruit ripeness and quality level in all considered fusion scenarios, as depicted in Table 3. This demonstrates that ensemble methods such as RF and Gradient Boosting are capable of producing the most stable results across all evaluation metrics. This can be attributed to their strong ability to handle heterogeneity in multimodal data. In addition, multi-view methods and stacking techniques allow multiple views and interactions between features, whereas early fusion builds a joint feature representation effectively. As a result, gradient boosting with early fusion is chosen as the optimal model due to its high performance, stability, and efficiency. Moreover, the practical use of the prediction result (Figure 5) reveals that the model is indeed applicable in real-world classification tasks. Confusion matrices (Figure 6) reveal a predominance of correctly classified instances along the diagonal line, implying good class separation even in close-looking situations.
Figure 5. Ripeness and grade prediction for a mango sample
Figure 6. Confusion matrices for ripeness and grade classification
In terms of physiological aspects, ripeness and Malaysian grade depend on the physical properties of the fruits along with their appearance. The processes of maturity for mangoes result in changes in skin color, structure, moisture, and weight. Although the RGB images help visualize changes in color and texture of mangoes during the maturation process, the weight also provides information about the development process and fruit sizes that cannot be estimated visually. Thus, the use of the proposed multimodal approach helps classify visually similar mangoes into categories based on their ripeness or Malaysian grade.
Table 3. Model performance across fusion strategies
|
Model |
Fusion Strategy |
Accuracy % (Grade) |
Accuracy % (Ripeness) |
Precision |
Recall |
F1-Score |
Overall Mean Accuracy (5-Fold CV) |
Std. Dev. (%) |
95% CI |
|
Naive Bayes |
Early Fusion |
0.7681 |
0.9420 |
0.8580 |
0.8520 |
0.8549 |
85.2 |
1.42 |
83.96-86.44 |
|
Stacking |
0.7536 |
0.9420 |
0.8500 |
0.8455 |
0.8477 |
84.1 |
1.63 |
82.67-85.53 |
|
|
Multi-view |
0.7536 |
0.9420 |
0.8490 |
0.8465 |
0.8477 |
84.25 |
1.58 |
82.87-85.63 |
|
|
Late Fusion |
0.7681 |
0.9420 |
0.8575 |
0.8525 |
0.8549 |
85.35 |
1.36 |
84.16-86.54 |
|
|
XGBoost |
Early Fusion |
0.8990 |
0.9310 |
0.9380 |
0.9320 |
0.9349 |
91.15 |
0.98 |
90.29-92.01 |
|
Stacking |
0.8986 |
0.9410 |
0.9375 |
0.9320 |
0.9347 |
91.05 |
1.05 |
90.13-91.97 |
|
|
Multi-view |
0.9075 |
0.9465 |
0.9450 |
0.9310 |
0.9379 |
92.1 |
0.92 |
91.29-92.91 |
|
|
Late Fusion |
0.8990 |
0.9610 |
0.9385 |
0.9315 |
0.9349 |
91.35 |
1.01 |
90.46-92.24 |
|
|
DT |
Early Fusion |
0.3265 |
0.5510 |
0.4420 |
0.4355 |
0.4387 |
43.9 |
2.74 |
41.50-46.30 |
|
Stacking |
0.8696 |
0.9655 |
0.9300 |
0.9250 |
0.9274 |
91.25 |
1.28 |
90.13-92.37 |
|
|
Multi-view |
0.8696 |
0.9555 |
0.9290 |
0.9260 |
0.9274 |
91.1 |
1.33 |
89.93-92.27 |
|
|
Late Fusion |
0.3061 |
0.3878 |
0.3500 |
0.3440 |
0.3469 |
34.25 |
2.81 |
31.79-36.71 |
|
|
KNN |
Early Fusion |
0.3265 |
0.5918 |
0.4620 |
0.4565 |
0.4592 |
45.9 |
2.46 |
43.74-48.06 |
|
Stacking |
0.8696 |
0.9510 |
0.9230 |
0.9175 |
0.9202 |
91 |
1.21 |
89.94-92.06 |
|
|
Multi-view |
0.8986 |
0.9410 |
0.9370 |
0.9325 |
0.9347 |
91.8 |
1.08 |
90.85-92.75 |
|
|
Late Fusion |
0.3265 |
0.4898 |
0.4120 |
0.4040 |
0.4079 |
40.8 |
2.37 |
38.72-42.88 |
|
|
SVM-RBF |
Early Fusion |
0.8415 |
0.9878 |
0.9180 |
0.9115 |
0.9147 |
90.2 |
1.26 |
89.10-91.30 |
|
Stacking |
0.8116 |
0.9855 |
0.9020 |
0.8950 |
0.8984 |
89 |
1.41 |
87.76-90.24 |
|
|
Multi-view |
0.8261 |
0.9655 |
0.9090 |
0.9025 |
0.9057 |
89.55 |
1.35 |
88.37-90.73 |
|
|
Late Fusion |
0.7927 |
0.9578 |
0.8935 |
0.8870 |
0.8902 |
87.95 |
1.52 |
86.62-89.28 |
|
|
RF |
Early Fusion |
0.9030 |
0.9670 |
0.9320 |
0.9180 |
0.9249 |
93.65 |
0.94 |
92.83-94.47 |
|
Stacking |
0.9020 |
0.9555 |
0.9270 |
0.9105 |
0.9186 |
92.85 |
0.99 |
91.98-93.72 |
|
|
Multi-view |
0.8551 |
0.9275 |
0.8940 |
0.8850 |
0.8894 |
89.15 |
1.29 |
88.02-90.28 |
|
|
Late Fusion |
0.8406 |
0.9275 |
0.8870 |
0.8810 |
0.8839 |
88.9 |
1.35 |
87.72-90.08 |
|
|
Gradient Boosting |
Early Fusion |
0.9130 |
0.9710 |
0.9450 |
0.9390 |
0.9419 |
94.2 |
0.83 |
93.47-94.93 |
|
Stacking |
0.8551 |
0.9440 |
0.9160 |
0.9100 |
0.9129 |
89.75 |
1.22 |
88.68-90.82 |
|
|
Multi-view |
0.9010 |
0.9630 |
0.9355 |
0.9285 |
0.9319 |
92.05 |
0.97 |
91.20-92.90 |
|
|
Late Fusion |
0.8990 |
0.9710 |
0.9380 |
0.9320 |
0.9349 |
93 |
1.03 |
92.10-93.90 |
4.2 Agentic logic and decision making
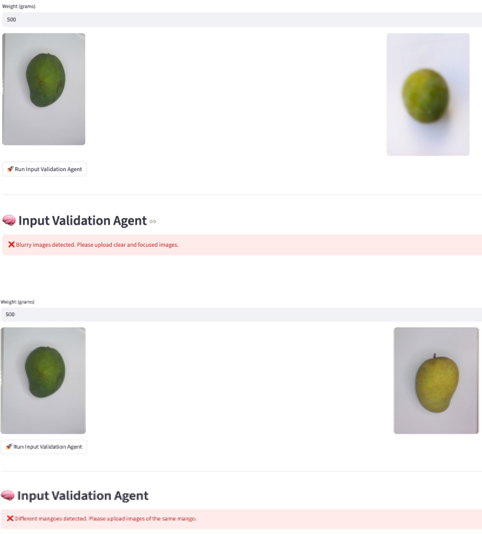
An agentic logic layer employs a pipeline for input validation using rules and features to maintain data integrity prior to inference, as presented in Figure 7. The input validation agent examines multi-view images employing quantitative metrics like brightness histogram analysis to measure illumination, variance of Laplacian to detect blur, and SSIM to identify duplicate or identical views. Furthermore, consistency across multiple views is ensured by verifying whether both images refer to the same mango, along with ensuring that there are two complementary views from the front and back perspectives. In case of any inconsistency, the agent initiates a feedback loop for correcting the input data.
Figure 7. Input validation agent outputs
4.3 Practical deployment of the system
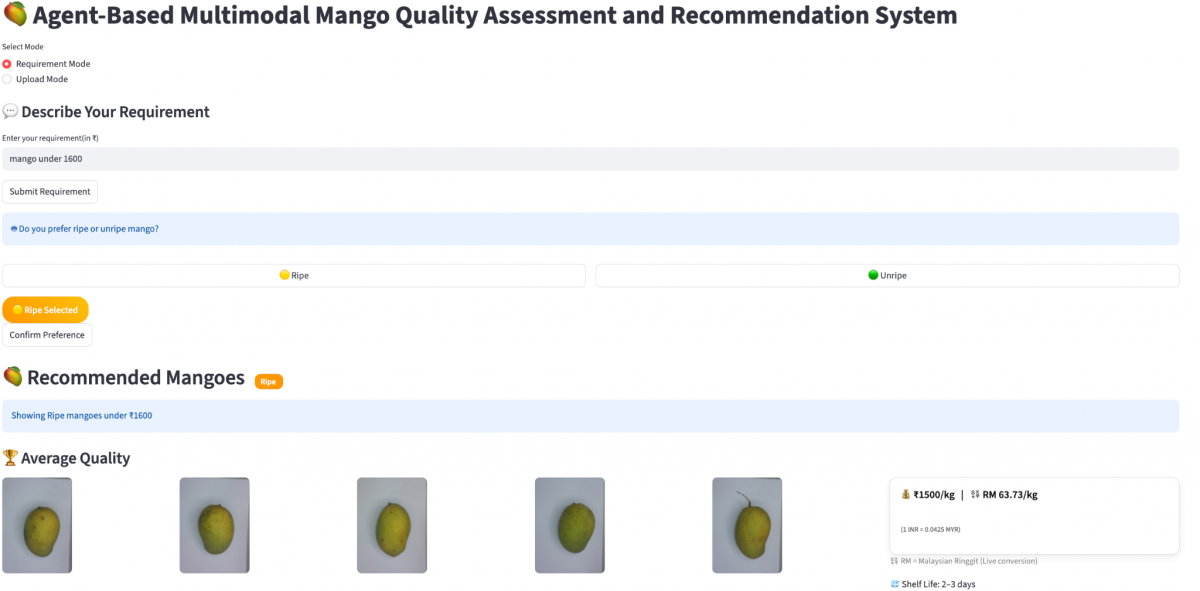
The prototype system interface showcases the real-life usage of the suggested agent-based multimodal system for practical applications in mango transactions. The system operates in two modes- requirement-based or upload-based, depicted in Figure 8. While in the former mode, users have the flexibility to define various parameters, including the price range, ripeness level, or their roles (buyer/seller). In contrast, the latter method allows users to insert multiple views of mango images and their weight measurements. Depending on user preference as well as inferred parameters of ripeness and grade, mango samples are filtered and recommended to users along with relevant details like cost estimates, quality categories, and shelf lives.
Figure 8. User interfaces of the mango assessment system
The recommendation and price estimation module is provided only as a prototype illustration of the proposed framework. The current model demonstrates how the forecasted maturity and quality classes can facilitate user interactions and decisions. Yet, the price estimation sub-module is not trained and tested on real market pricing data, and it is provided for demonstration purposes only.
This study provides an efficient and scalable solution for automated mango quality evaluation and recommendation through a multimodal multitasking agent-based model. The visual data extracted from multi-view images is combined with structured weight information to provide reliable predictions. The addition of an agentic validation and reasoning layer increases the robustness of the model because it guarantees the credibility of the input information and allows for making intelligent decisions regarding feedback, which solves the problem of the transition from the purely computational model to its practical application. In addition, the experiments conducted on the practical example prove the applicability of the suggested system in real life. Future research will include validation of the proposed framework through large-scale datasets and comparison of its results with those of other state-of-the-art deep learning fruit grading models. In general, this research makes contributions not only in the field of automated fruit grading techniques but also in intelligent agriculture technologies.
|
F |
Extracted feature vector |
|
f |
Individual image feature |
|
W |
Mango weight, Kg |
|
N |
Number of samples |
|
M |
Boosting iteration index |
|
L |
Loss function |
|
y |
Actual class label |
|
r |
Residual error |
|
Greek symbols |
|
|
γ |
Constant prediction value |
|
η |
Learning rate |
|
Subscripts |
|
|
i |
Image |
|
n |
Features |
|
front |
Front-view |
|
back |
Back-view |
|
norm |
Normalization |
|
min |
Minimum |
|
max |
Maximum |
[1] Zhao, M.M., You, Z.H., Chen, H.Y., Wang, X., Ying, Y.B., Wang, Y.X. (2024). Integrated fruit ripeness assessment system based on an artificial olfactory sensor and deep learning. Foods, 13(5): 793. https://doi.org/10.3390/foods13050793
[2] Cai, Y.Q., Cui, B., Deng, H., et al. (2024). Cherry tomato detection for harvesting using multimodal perception and an improved YOLOv7-tiny neural network. Agronomy, 14(10): 2320. https://doi.org/10.3390/agronomy14102320
[3] Um, D., Koram, C., Nethala, P., et al. (2025). Beyond color: Phenomic and physiological tomato harvest maturity assessment in an NFT hydroponic growing system. Agronomy, 15(7): 1524. https://doi.org/10.3390/agronomy15071524
[4] Xu, Z.N., Xu, J., Zhang, M.Q., Wang, P.J., Deng, C., Liu, C.L. (2025). Multimodal agricultural agent architecture (MA3): A new paradigm for intelligent agricultural decision-making. arXiv preprint arXiv:2504.04789. https://arxiv.org/abs/2504.04789
[5] Cantonjos, N.A., Biswas, A. (2025). AgroAskAI: A multi-agentic AI framework for supporting smallholder farmers' enquiries globally. arXiv preprint, arXiv: 2512.14910. https://arxiv.org/abs/2512.14910.
[6] Srinivasu, P.N., Pavate, A., JayaLakshmi, G., Shafi, J., Choi, J., Ijaz, M.F. (2026). Agentic AI for smart and sustainable precision agriculture. Frontiers in Plant Science, 16: 1706428. https://doi.org/10.3389/fpls.2025.1706428
[7] Swati, N.L.P., Gupta, S.V., Duddela, N.S., Parvathy, L.R. (2026). Agentic AI-driven autonomous decision support system for smart agriculture. Scientific Reports, 16: 9972. https://doi.org/10.1038/s41598-026-39472-w
[8] Rangarajan, S., Harshad, A., Dhinesh, A.M. (2026). Comparing and analysing the effectiveness of Multi-Agent Reinforcement Learning (MARL) algorithms for simplistic coordination in row cultivation applications. Smart Agricultural Technology, 13: 101842. https://doi.org/10.1016/j.atech.2026.101842
[9] Ferrer-Ferrer, M., Ruiz-Hidalgo, J., Gregorio, E., Vilaplana, V., Morros, J.R., Gené-Mola, J. (2023). Simultaneous fruit detection and size estimation using multitask deep neural networks. Biosystems Engineering, 233: 63-75. https://doi.org/10.1016/j.biosystemseng.2023.07.010
[10] Sikder, M.S., Islam, M.S., Islam, M., Reza, M.S. (2025). Improving mango ripeness grading accuracy: A comprehensive analysis of deep learning, traditional machine learning, and transfer learning techniques. Machine Learning with Applications, 19: 100619. https://doi.org/10.1016/j.mlwa.2025.100619
[11] Xiao, F., Wang, H.B., Xu, Y.Q., Zhang, R.Q. (2023). Fruit detection and recognition based on deep learning for automatic harvesting: An overview and review. Agronomy, 13(6): 1625. https://doi.org/10.3390/agronomy13061625
[12] Maheswari, P., Raja, P., Apolo-Apolo, O.E., Pérez-Ruiz, M. (2021). Intelligent fruit yield estimation for orchards using deep learning based semantic segmentation techniques-a review. Frontiers in Plant Science, 12: 684328. https://doi.org/10.3389/fpls.2021.684328
[13] Sabouri, A., Bakhshipour, A., Poorsalehi, M., Abouzari, A. (2025). Machine learning techniques for non-destructive estimation of plum fruit weight. Scientific Reports, 15: 751. https://doi.org/10.1038/s41598-024-85051-2
[14] Basak, J.K., Paudel, B., Kim, N.E., Deb, N.C., Kaushalya Madhavi, B.G., Kim, H.T. (2022). Non-destructive estimation of fruit weight of strawberry using machine learning models. Agronomy, 12(10): 2487. https://doi.org/10.3390/agronomy12102487
[15] Duan, J.L., Lai, L.Q., Yang, Z., Luo, Z.J., Yuan, H.T. (2024). Multi-feature language-image model for fruit quality image classification. Computers and Electronics in Agriculture, 227: 109462. https://doi.org/10.1016/J.COMPAG.2024.109462
[16] Elsayed, S., Gala, H., Abd El-Baki, M.S., et al. (2025). Hyperspectral technology and machine learning models to estimate the fruit quality parameters of mango and strawberry crops. PLoS ONE, 21(3): e0345011. https://doi.org/10.1371/journal.pone.0313397
[17] Yang, Z.X., Li, Y.S., Wang, R.F., Hu, P.F., Su, W.H. (2025). Deep learning in multimodal fusion for sustainable plant care: A comprehensive review. Sustainability, 17(12): 5255. https://doi.org/10.3390/SU17125255
[18] Fu, Y., Sun, D.W. (2026). Advancing fruit quality monitoring with artificial intelligence-augmented non-destructive technologies. Food Engineering Reviews, 18(2): 9. https://doi.org/10.1007/s12393-026-09437-w
[19] Murad, M., Ahmed, M., din, N.U., et al. (2026). Agentic AI framework to automate traditional farming for smart agriculture. AgriEngineering, 8(1): 8. https://doi.org/10.3390/agriengineering8010008
[20] Masud, S.R., Hossain, S.M., Sarkar, M.R., Mahmood, M.S., Morol, M.K., Sajib, R.H. (2026). An explainable ensemble learning framework for crop classification with optimized feature pyramids and deep networks. arXiv preprint arXiv:2603.25070. https://arxiv.org/pdf/2603.25070.
[21] Barriere, V., Claverie, M., Schneider, M., Lemoine, G., d'Andrimont, R. (2024). Boosting crop classification by hierarchically fusing satellite, rotational, and contextual data. Remote Sensing of Environment, 305: 114110. https://doi.org/10.1016/j.rse.2024.114110
[22] Sarker, I.H. (2021). Machine learning: Algorithms, real-world applications and research directions. SN Computer Science, 2(3): 160. https://doi.org/10.1007/S42979-021-00592-X
[23] Tripodi, P., D'alessandro, R., Festa, G., Taviani, P., Rea, R. (2022). Profiling the diversity of sweet pepper 'peperone cornetto di pontecorvo' PDO (capsicum annuum) through multi-phenomic approaches and sequencing-based genotyping. Agronomy, 12(6): 1433. https://doi.org/10.3390/agronomy12061433
[24] Mahesh, P., Soundrapandiyan, R. (2024). Yield prediction for crops by gradient-based algorithms. PLoS ONE, 19(8): e0291928. https://doi.org/10.1371/journal.pone.0291928
[25] Elvanidi, A., Katsoulas, N. (2022). Performance of gradient boosting learning algorithm for crop stress identification in greenhouse cultivation. Biology and Life Sciences Forum, 16(1): 25. https://doi.org/10.3390/IECHO2022-12508
[26] Saha, K.K., Rahman, A., Moniruzzaman, M., et al. (2023). Classification of starfruit maturity using smartphone-image and multivariate analysis. Journal of Agriculture and Food Research, 11: 100473. https://doi.org/10.1016/j.jafr.2022.100473
[27] Reddy, D.M.S., Usha Rani, N. (2024). Automated machine learning based crop recommendation system. International Research Journal on Advanced Science Hub, 6(05): 103-109. https://doi.org/10.47392/irjash.2024.018
[28] Rainio, O., Teuho, J., Klén, R. (2024). Evaluation metrics and statistical tests for machine learning. Scientific Reports, 14(1): 6086. https://doi.org/10.1038/S41598-024-56706-X