Maxim Kocharov*![]() | Islam Alexandrov
| Islam Alexandrov![]() | Ilya Melikov
| Ilya Melikov![]() | Nikita Karpov
| Nikita Karpov![]() | Dmitriy Krasovskiy
| Dmitriy Krasovskiy![]()
© 2025 The authors. This article is published by IIETA and is licensed under the CC BY 4.0 license (http://creativecommons.org/licenses/by/4.0/).
OPEN ACCESS
This study proposes a methodology to maximize income using a novel Customer Potential Index (CPI) to optimize production programs in small and medium-sized enterprises (SMEs) engaged in customized manufacturing. The research addresses the gap in existing systems that fail to integrate long-term customer value into production planning. Using regression analysis of accounting reports from 33 clients, we developed a CPI model to predict repeat order likelihood. This index was integrated into a mixed-integer linear programming framework that jointly maximizes current marginal profit, projected CPI-based revenue growth, and minimizes opportunity costs from order postponement. In a real-world case with 11 competing orders, the CPI-based optimization identified a high-potential client with a predicted CPI for a higher-margin but low-potential order, resulting in a better strategic allocation of constrained resources. The model was tested using the root mean square error (RMSE) and mean absolute percentage error (MAPE) metrics and was well represented. The novelty of this research lies in bridging customer analytics and production scheduling without proprietary customer relationship management data and using artificial intelligence (AI), while making advanced planning accessible to resource-constrained SMEs.
CPI, production optimization, customer segmentation, SMEs, customized manufacturing
In the contemporary manufacturing context, planning production capacity is the most labor-intensive task for a modern enterprise. This task execution efficiency significantly affects the enterprise's profitability. In the digital economy, large and resource-intensive companies have been shown to efficiently use information from supply chains and each production operation, thereby maximizing production capacity, optimizing planning, and significantly reducing costs [1, 2].
However, small and medium-sized enterprises (SMEs) in the machine-building industry that specialize in the production of customized goods face fundamentally different challenges when planning their production capacities. The activities of these enterprises are distinguished by high labor intensity, the pivotal role of the human factor, and limited resources. The number of staff and their qualifications, which make the production system less predictable than automated processes, determine the production capacity and productivity of such enterprises. Limited resources hinder production flexibility and customer service quality, thereby complicating the planning, control, and monitoring of production processes [3, 4].
An additional complication is that SMEs cannot always afford to implement advanced technologies such as cyber-physical systems (CPS), computer-aided process planning (CAPP), and enterprise resource planning (ERP) solutions. This is because it requires significant financial resources and highly skilled staff. In contrast to large companies, digitalization and innovation are underutilized in the SME sector, even though these enterprises are an essential part of the modern economy [5].
Despite their relatively small production capacities, SMEs offer a wide range of products and are highly flexible and adaptable. However, the variety of products and the uncertain number of orders make planning processes more complex. Since decision-making often uses expert assessments, in a competitive environment for highly skilled employees, this requires computerized support.
The central problem for SMEs in the field of customized manufacturing is the lack of efficient tools for assessing customer potential and allocating limited production resources optimally among different orders. Current solutions are either too resource-intensive for small businesses or do not consider the specifics of customized production and interaction with customers. These factors lead to suboptimal production program planning and inefficient use of production capacity.
This study proposes a methodology to determine the optimal order prioritization list for SMEs with high production customization to maximize revenue. Additionally, this study suggests using the CPI, a novel indicator based on publicly available operational and financial data that reflects customer potential. The CPI helps assess the probability of repeat orders from specific customers, which is critical for companies with limited resources to plan production that satisfies customer demands. Using the CPI in mathematical modeling optimizes the production program by selecting priority orders more informatively, considering current marginal profit and projected accretions from long-term cooperation with promising customers. This approach makes it possible to address the key challenge of the customized production process – the efficient allocation of limited production resources among current orders, considering the strategic prospects for developing relationships with customers.
Modern industrial production processes rely on key parameters that ensure optimal company performance and production efficiency. Determining these parameters requires resource-intensive tools and extensive experience; otherwise, constant reworking and corrections are necessary. This is particularly true in the production of complex materials, such as textiles used in reinforced plastics. The increased interest in adaptive methods for organizing mass customization production facilitates the development of flexible technologies, such as additive manufacturing and modular production cells. However, these approaches require significant investments in digital infrastructure and highly qualified personnel, making them inaccessible to SMEs with limited resources [6, 7]. A critical disadvantage of existing approaches is their exclusive focus on technological modernization, ignoring the specifics of customer interaction in customized production.
Online production monitoring based on advanced analytics offers significant advantages, including a thorough evaluation of production processes. Monitoring controls all stages of production, thereby increasing productivity and optimizing resource consumption. Many small businesses track production volume and quality, cycle times, equipment downtime, and raw material inventories. This enables them to reduce resource consumption, lower costs, and swiftly adapt production to market conditions, thereby enhancing the enterprise's sustainability [8]. However, maintaining a monitoring system requires constant investment, especially when optimizing a production line. Effective tracking of production parameters requires a high monitoring resolution. If the resolution is inadequate, the data become inaccurate, making optimization difficult. A fundamental gap in modern monitoring systems is the lack of tools to assess the customers' long-term potential when prioritizing orders under limited production capacity.
SMEs use effective solutions, such as cyber-physical systems (CPS) based on Internet of Things (IoT) networks and cloud systems, to interact with physical systems, including robots, machines, and wireless sensors. CPS form a digital representation of production through intelligent networks to collect and manage information for informed decision-making, which increases efficiency and productivity [9]. CPS involve integrating various sensors, actuators, and machines into smart communities to collect information and perform physical actions. CPS can self-adapt, self-organize, and self-learn, ensuring autonomous operation in line with company objectives [10]. However, it is essential to note that CPS do not provide mechanisms for integrating customer marketing data into production planning, a key requirement for customized production. The main difficulties in implementing CPS in SMEs include cost, a shortage of qualified IT specialists, and the complexity of connecting and integrating with existing software [11, 12].
Recent reviews of traditional methods for customer segmentation reveal their limited effectiveness in modern research. For instance, RFM analysis, which categorizes customers based on the recency (how recently they purchased), frequency (how often they purchase), and monetary value (how much they spend), is not well-suited for analyzing SME data due to its complexity and the nonlinear nature of customer behavior [13]. Enterprise resource planning (ERP) systems are information systems for manufacturing companies that integrate and control business processes, thereby increasing efficiency and competitiveness [14, 15]. ERP systems are critical but costly corporate information technology implementations. The advantages of ERP 4.0 are realized in companies with a high level of automation, including SMART factories and digital twins. Implementing ERP requires a comprehensive review of business procedures and is resource-intensive. The implementation process is expensive and may be unsuccessful. While most methods are based on three phases (pre-implementation, implementation, and post-implementation) ERP systems are complex to implement, and the return on investment is sometimes minimal. Many enterprises require a systematic, simplified implementation algorithm [16-18].
Computer-aided process planning (CAPP) systems are computer programs that automatically generate production plans and work instructions. CAPP uses computer-aided design models to develop detailed technological plans for manufacturing goods, including tools, materials, and operations. To achieve acceptable results, it is necessary to select the valid technology, sequence of operations, cutting tools, and additional equipment, calculate the cutter movement, and estimate the costs and production duration [19]. Dynamic CAPP systems provide flexible process planning and expand the range of products. CAPP systems can help develop an energy-saving strategy during part design and process planning stages [20]. It is crucial that ERP and CAPP lack modules that forecast customer potential using publicly available data, because this could significantly improve planning efficiency in customized manufacturing.
In manufacturing, decision support systems (DSS) rely on methods that help decision-makers choose effective options, allocate resources, optimize processes, and increase productivity. These methods use data, models, and algorithms to generate conclusions and recommendations for informed decision-making. Manufacturing uses a variety of DSS to evaluate information, build models, and track and adjust processes online. DSS are used for workforce planning, management, recruiting, and optimization tasks [21]. Edge computing is a fundamental component of IoT systems that eliminates latency and overcomes the limitations of traditional cloud architectures by simplifying on-site information processing [22]. While decision support systems provide valuable analytical capabilities, they are limited to analyzing internal enterprise data. This limits their ability to assess the external customer base, creating a significant gap for SMEs operating in the field of customized manufacturing.
Nevertheless, implementing these innovations is not always feasible for small manufacturers who lack the financial resources and experience. Despite the aforementioned advantages of small manufacturing enterprises in economic development, they cannot always afford to modernize. Current monitoring systems lack mechanisms for incorporating customers' long-term potential into SME production planning. Therefore, this study provides a detailed description of the steps involved in creating a systematic method to improve the efficiency of production programs used by small and medium-sized machine-building enterprises with production plans focused on adapted production.
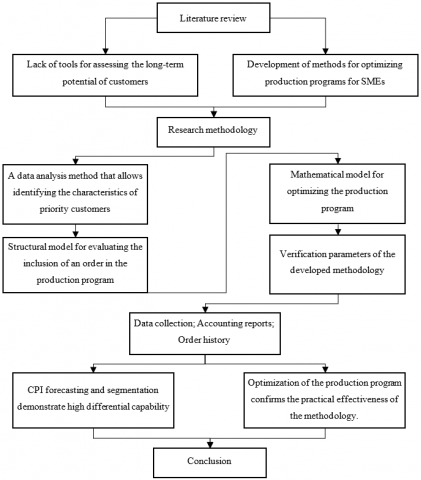
The design of the present study is summarized in Figure 1.
Figure 1. Study design flowchart
3.1 Data analysis method
Virtually all companies in the machine-building industry divide their customers into several classes. This classification usually considers sales experience to rank customers and focus on those who provide the highest profitability. The specifics of customized production must also account for the customer's consumer behavior. Such classifications are usually based on ABC analysis (evaluation of total profit from each customer), XYZ analysis (evaluation of stability and predictability), and RFM analysis (evaluation of order age, frequency, and amount) [23].
To develop the optimal method for forecasting the CPI, let us examine the consumer behavior of the priority customer. As mentioned above, we noted that each customer in this category is capable of placing repeat (subsequent) orders with a given enterprise. From the customers' point of view, it may not be a question of probability but mainly of the importance of having a particular volume of products (goods) required for normal production development. In general, potential customers who are interested in the products of certain enterprises are characterized by:
- The selection of appropriate suppliers of products with the required range and quality indicators;
- Sufficient finances to pay for goods of selected manufacturers;
- The stability of the current economic situation.
Therefore, any enterprise that can be classified as a priority customer will have clear differences from other enterprises that do not belong to this group.
The most commonly used method for analyzing the current state of economic entities is to evaluate the information reflected in financial statements. This information is publicly available for many operating companies and can be accessed using specialized internet resources. Therefore, let us analyze the publicly available information in the financial statements of a particular factory regarding its priority customers. This analysis can reveal the main differences between this enterprise and other production associations in terms of production indicators.
3.2 Structural model of the methodology under development
The CPI parameter is proposed as a tool for identifying priority customers and further integrating it into the model to structure the order prioritization process. This parameter is calculated from Eq. (1):
$C P I_{i j}=\frac{S_{i j}}{v_i}$ (1)
where, S is the number of sales, $v$ is the revenue from the reference order, i is the customer number, and j is the time for which the CPI parameter is calculated.
To forecast the CPI, the company's economic parameters are used in the resulting linear function, presented in Eq. (2).
$Z=b_1 x_1+b_2 x_2+\ldots b_{n-1} y_{n-1}+b_n u_n$ (2)
Table 1 shows the proposed model parameters.
Table 1. List of parameters for accounting in the CPI
|
x1 – Authorized Capital, Rubles; |
y1 – profitability x5/x4; |
|
x2 – Average Headcount, Persons; |
y2 – profitability x6/x4; |
|
x3 – Number of Full Years of the Company's Existence; |
y3 – average output x4/x2; |
|
x4 – Sales Revenue for the Current Year, Thousand Rubles; |
y4 – revenue growth rate x4/x7; |
|
x5 – Profit from Sales for the Current Year, Thousand Rubles; |
y5 – revenue accretion rate x4/(x2 – 1); |
|
x6 – Net Profit for the Current Year, Thousand Rubles; |
y6 – profit growth x5/x8; |
|
x7 – Sales Revenue for the Previous Year, Thousand Rubles; |
y7 – profit accretion x5/(x8 – 1); |
|
x8 – Profit from Sales for the Previous Year, Thousand Rubles; |
y8 – net profit growth x6/x9; |
|
x9 – Net Profit for the Previous Year, Thousand Rubles. |
y9 – net profit accretion x6/(x9 – 1). |
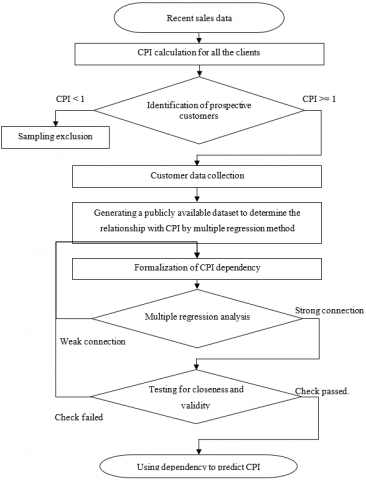
To apply the CPI forecasting method at other enterprises, it is necessary to go through all stages of customer interaction. Figure 2 shows the complete CPI forecasting methodology based on publicly available customer data.
Figure 2. Algorithm for forecasting the CPI
The method, which improves communication effectiveness with customers by considering key adaptive manufacturing features, is implemented in stages. First, initial information regarding random orders is analyzed. Several basic criteria are analyzed for this purpose, such as labor costs, direct costs, and profitability. At this stage, a small team is required, including a designer, technologist, and economist. These individuals must have the appropriate qualifications to evaluate the aforementioned parameters quickly. This requires data arrays that accurately reflect each previously completed order.
The second stage involves analyzing temporarily idle production capacity to determine if it can fulfill random orders within the current production program. This stage requires a team of operational production management specialists who monitor the production process daily and ensure that all orders are fulfilled, while accounting for the production workload. Fulfilling these conditions also requires an appropriate database in the manufacturing enterprise's information system.
If existing production capacities are insufficient, it is necessary to move on to stage 3. During stage 3, specialists responsible for operational production management work closely with the owner of a small factory to select work that can be temporarily suspended to start manufacturing random orders, thus minimizing the factory's reputational and financial losses. The nature of interaction with each customer who has placed an order within the scope of the current production program is considered during this stage. This data is usually confidential. Temporarily suspended orders, along with random orders, can also improve the efficiency of current production programs. To solve this problem successfully, a mathematical model must be developed that applies to the specifics of customized production.
3.3 Mathematical model for optimizing the production program
A list must be compiled of all limited resources necessary for each order fulfilling r1i,…,rei, where e is the current resource from the entire resource base E. Each resource has certain limitations R1,…,Re. All limited production resources, by type, necessary for manufacturing goods for all orders, without exception, for the developed or adjusted production program, must comply with the established restrictions.
$\left\{\begin{array}{l}\sum_{i=1}^{i+1} r_{1 i} \leq R_1 \\ \sum_{i=1}^{i+1} r_{e i} \leq R_e\end{array}\right.$ (3)
where, i is the order of all orders manufactured by the enterprise.
In our case, the decision to include an order in the production program structure is represented by a Boolean argument pi = {0,1}.
Based on the above parameters, it is possible to calculate a ratio that describes the current planned marginal income from orders included in the created or adjusted production program. Consequently:
$M P(p)=p_1 v_1 m_1+\ldots+p_i v_i m_i$ (4)
In addition to planned marginal profitability, the mathematical model considers projected increases in marginal profitability from manufactured and sold orders under the production program. To calculate this coefficient, let us use the following parameters: ki—projected CPI estimates for each customer, vs—the total revenue received from the manufacture of standard (reference) orders, and ms—the percentage of marginal profitability resulting from selling standard (reference) orders, in other words:
$M F(p)=\left(k_1 p_1+\ldots+k_i p_i\right) v_s m_s$ (5)
The mathematical model under consideration relies on the principle that including current orders in the developed or adjusted production program realizes the customer's projected potential.
In addition, the structure of the mathematical model assumes that when adjusting the existing program, a temporary refusal to fulfill any current order is likely to result in losses, expressed as X. Therefore, in addition to profitability, the mathematical model under consideration must cover various types of costs caused by suspending production excluded from the previously approved production plan. The presence or absence of an order in the current program is expressed by the Boolean argument Y, determined by Z. Therefore, the following relationship is correct:
$c_i=\left\{\begin{array}{l}1, p_i=0 \\ 0, p_i=1\end{array}\right.$ (6)
Accordingly, the current planned losses associated with suspending production of goods for individual orders can be expressed as a function of a Boolean argument.
$L(c)=c_1 l_1+\ldots+c_i l_i$ (7)
where, li are possible losses; L(c) are losses resulting from the suspension of work on a conditional order that has been removed from the production plan.
Each of the three basic parameters (two parameters representing revenue and one parameter reflecting costs) forms the basis of the target dependency:
$M T=M P(p)+M F(p)-L(c) \rightarrow \max$ (8)
The proposed mathematical model can optimize the production program with absolute accuracy when considering customized production specifics.
3.4 Experimental design and case data
The proposed mathematical model improves the planning efficiency for adaptive manufacturing. The basic optimizable arguments of the proposed model are pi. They may cover (value “one”) or not (value “zero”) the current order in the developed or adjusted production plan.
The optimizable criterion of the model under consideration consists of the expected profitability MP(p) of future revenue increases from customers, whose requirements can be met by the production capabilities of an adaptive plant (factory) and the expected costs MF(p), arising mainly from suspending work on a conditional order removed from the production plan L(c).
The proposed model is a multifunctional tool that enhances the efficiency of the production plan for adaptive manufacturing. Using the proposed mathematical model makes it possible to create a new production plan and make timely adjustments to the current production plan based on random customer requirements.
To select data for testing, criteria were chosen that determined whether the company belonged to an SME (revenue does not exceed 2 billion rubles), as well as whether the company had a sufficient number of customers (at least 10). A total of 1,033 sales to 33 customers were evaluated during testing. The calculation parameter was a reference order valued at 1.5 million rubles. The data will also be tested for correlation to confirm the relationship between the parameters that will be used in the formula for calculating the CPI.
ANOVA was used to test the hypothesis that the CPI value correlates with total marginal income for each of the involved companies. For this purpose, the customer data were divided into three groups, each containing an equal number of customers.
To verify the performance of the proposed mathematical model for CPI forecasting, an analysis of RMSE metrics was performed to assess the forecasting accuracy. Eqs. (9) and (10) for calculation are as follows:
$R M S E=\sqrt{\sum_{i=1}^n \frac{\left(\hat{z}_i-z_i\right)^2}{n}}$ (9)
$MAPE=\frac{1}{n} \sum_{i=1}^n\left|\frac{z_{\text {fact }}-z_{\text {pred }}}{z_{\text {fact }}}\right| * 100 \%$ (10)
The final stage of testing involved the methodological approach to optimize the production program using the CPI in a practical setting. In this stage, a real production situation was analyzed in which the company had to decide whether to postpone one of four orders to the following month owing to the limited production capacity.
4.1 Confirmation of the effectiveness of the proposed CPI
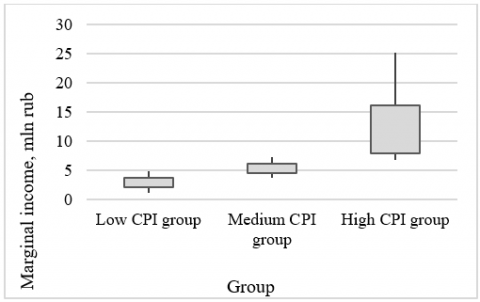
An analysis of data on 33 customers was a part of the study of available information on sold products. Analysis of variance (ANOVA) was used to test the hypothesis that the proposed CPI correlates with customers' marginal income. Figure 3 shows the results of this testing.
Figure 3. Results of ANOVA testing
The final ANOVA test values for the F-statistic were F(2, 32) = 17.17. These results clearly show that customers with high CPI generate more marginal revenue, thus confirming the hypothesis.
4.2 Forecasting the CPI
To calculate the CPI, let us use Eq. (1) and the flowchart in Figure 2. In the first stage of the regression analysis of the parameters in Table 1 and the resulting function, the four parameters that correlate most strongly were identified, as shown in Table 2.
Table 2. Most correlated financial parameters after the first stage
|
|
x1 |
x2 |
x4 |
x7 |
|
R2 |
0.5702 |
0.5208 |
0.5669 |
0.5928 |
The second stage involves compiling the final functional dependency to predict the customer potential coefficient. This coefficient includes the parameters most closely correlated with the final function. For this purpose, a consecutive combined regression analysis is performed on the parameters from Table 2 to determine their relationship with the resulting function. The following formula is the result of this analysis:
$z=0.86564 x_1+0.01792 x_7, R^2=0.6053$ (11)
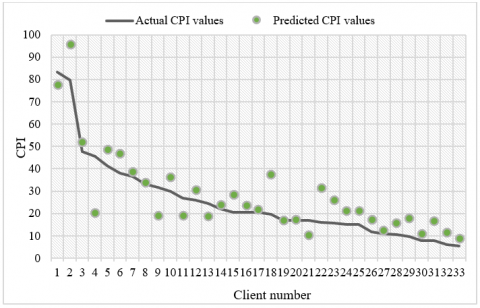
To evaluate the accuracy of the CPI calculation, let us use the RMSE parameter using Eq. (9). The RMSE parameter is non-negative. It has no upper limit and helps evaluate the accuracy of the developed model. The MAPE parameter analysis is also used to calculate the average absolute error between the actual and predicted values. Figure 4 shows a graph that illustrates the difference between the actual and predicted values.
Figure 4. Predictive and actual values of the CPIyear (RMSE=9.216, MAPE=37.35%)
The CPI shows customers with the maximum impact on marginal income growth. This index is also used in the model for optimizing the production program.
4.3 Optimizing the production program using the CPI
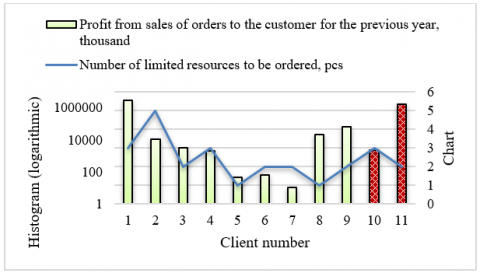
While reviewing the available information on sold products, a shift in the current order to the following month was identified. Here, the manufacturer was working on several orders that should ship to customers, also with a transfer to the first half of the following month. During this period, the company's management concluded that it would not be possible to manufacture all the ordered goods within a month, so they were shifted to the following month, which concerns products for Customers 10 and 11. The rationale behind this decision was the ratio of amounts reflecting the revenue generated by producing these orders. Figure 5 contains customer numbers whose orders were moved to the beginning of the following week.
Figure 5. Initial data on orders
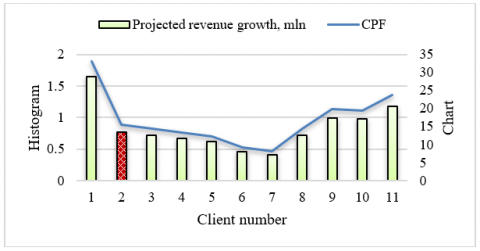
To optimize the production program under consideration using mathematical modeling, it is necessary to calculate several CPI forecast values for the specified customers. These calculations were based on the functional relationship defined earlier. We compiled a list of source data to calculate the CPI forecast values for all customers. The revenue received with this distribution of priorities amounted to 7.52 million rubles. Figure 6 shows the parameters for the calculated CPI and projected profit growth. Note that manufacturing products for Customer 2 requires the same resources as manufacturing products for Customers 10 and 11. Consequently, the released limited production resources could be used to manufacture products for orders postponed to the beginning of the following month.
Figure 6. Data after applying the proposed methodology
Testing the optimization methodology increased future order revenue from these customers by 1.386 million rubles through customer potential analysis, which increased the total revenue for all orders to 9.212 million rubles. Although losing a specific order may reduce current revenue by 13,000 rubles, its potential revenue was deferred in favor of Customers 10 and 11 based on an analysis of profits and the availability of resources to fulfill particular orders.
The results of this study on the development of the CPI for optimizing production programs in customized SME manufacturing demonstrate advantages over existing approaches presented in the current literature on production optimization and customer segmentation. The proposed development expands production planning capabilities in the SME customer base segmentation by applying an individual CPI to each customer. This approach enables optimal orders and may directly impact a company's revenue growth.
Recent research in multi-criteria decision support systems shows that sorting methods can be used to segment thousands of customers, creating more homogeneous and understandable segments for managers. However, these systems primarily target large companies with extensive customer databases. The CPI addresses the specific needs of customized SME manufacturing, where each customer may have unique requirements, and the customer base is relatively small. However, their potential is critical for production planning [24, 25].
Modern studies demonstrate the high effectiveness of two-stage approaches to business analytics for behavioral and geographic customer segmentation using e-commerce data. These approaches are helpful for personalized customer targeting. However, these methods require extensive customer behavior data and complex analytical platforms. The proposed CPI forecasting methodology uses only financial statements, making it universally applicable for analyzing potential customers without prior interaction with them [26].
In contrast to existing approaches to optimizing SME production processes, which focus on individual aspects of production such as quality, time, and costs, the developed mathematical model integrates planned marginal profitability, projected accretions in marginal profitability based on the CPI, and probable costs from order suspensions based on a broad set of indicators. This comprehensive approach differs from fragmented solutions and provides systematic optimization of the production program [27].
Practical testing has shown that using CPI for urgent order shifts releases limited resources and increases overall production capacity. This surpasses the capabilities of traditional ABC, XYZ, and RFM analysis methods, which ignore customized production specifics. The problem with data processing methods is that they do not provide results for each client. For example, the ABC analysis method uses an overly simple framework, making it difficult to understand the general structures. The XYZ and RFM methods require complex adaptation for dynamic analysis. The proposed method allows for effective results for each client, which is particularly useful for SME [13].
Forecasting CPI proves to be quite accurate. Modern methods that use AI technologies, machine learning, and deep learning can achieve a higher accuracy of similar indicators, such as a company's revenue [28]. However, many studies show that most SMEs cannot use such technologies due to various factors, including a shortage of AI specialists, operational and maintenance complexity, and limited resources, particularly among small businesses [29].
The obtained RMSE and MAPE values are within an acceptable range compared to other methods in the current literature in similar industrial sectors. For example, comparable ML-based solutions can achieve MAPE accuracy below 35%, which improves the results obtained in this study, but such methods. In addition, given that the MAPE criterion cannot be used in all cases, analyzing the RMSE parameter reveals that the proposed result is comparable to current research, although alternative models exhibit higher accuracy parameters. However, such methods are associated with significantly increased data volume and processing requirements, raising questions about their use in SMEs [30].
The proposed methodology enhances the quality of management decisions via three key mechanisms. The CPI enables a quantitative assessment of a customer's long-term value based on objective financial indicators. This eliminates the subjectivity of expert assessments when prioritizing orders. Integrating the CPI into a mathematical optimization model provides a balance between short-term profitability and strategic customer base development, which is critical for SMEs to achieve sustainable revenue growth. Using publicly available data enables assessing the potential of existing and potential customers before commercial interaction begins, expanding possibilities for strategic production planning.
The study results have important practical implications for SME management in the machine-building industry. Introducing the CPI enables managers to develop production programs based on intuition, experience, and quantitative forecasts of customer potential, making more informed decisions. Another significant advantage of implementing the proposed methodology is its simplicity compared to similar AI-based methodologies. This is particularly relevant for companies facing shortages of skilled personnel and high staff turnover.
The proposed method can be adapted to work in other sectors. It is easily adapted to several SME-sized businesses. However, it may encounter challenges when working with larger companies, where effective methods will deviate significantly from classical approaches. It is also worth noting that machine learning can be effectively integrated into the methods, as it can demonstrate higher accuracy rates than linear regression. However, this adds complexity to the method, making it difficult to implement in SMEs.
The first limitation of this study is that the proposed methodology was tested using relatively limited data. Therefore, future research should focus on large-scale testing of this development across a larger number of companies. The second limitation is that the mathematical model does not account for external macroeconomic factors and seasonal demand fluctuations, both of which can influence customer behavior and the effectiveness of production planning, particularly for short-term forecasts. In addition, although the model and observation take into account factors coming from each customer, with an existing company, but not doing so in real time, the dynamic change in consumer sentiment is not taken into account.
The promising area would be the inclusion of stochastic elements in the model to account for uncertainty in demand forecasts and customer behavior. The development of a multi-period optimization model will consider the dynamics of the production program over time and optimize the order portfolio for the current period and future opportunities.
This study aimed to develop a methodology based on an index that reflects customer potential utilizing publicly available operational and financial data. The proposed methodology enhances the effectiveness of the production plans for small and medium-sized adaptive machine-building plants and factories by considering customer prospects to increase revenue. This methodology uses a new CPI parameter that successfully identifies priority customers, reflecting customer potential based on financial statements. This study contributes to production planning by proposing a new mechanism for integrating external customer data into the proposed model.
The proposed CPI forecasting method demonstrated its efficiency and a sufficiently high level of convergence. The customer base was divided by the value of the proposed CPI, and the hypothesis that this coefficient directly increases SME revenue was proven. The CPI can be applied during the development stage to improve the efficiency of production programs. The optimization mathematical model focuses on expected profitability calculated using the CPI. Analyzing the accuracy of CPI forecasting confirmed its effectiveness with an MAPE of 37.35%. The CPI links customer analysis and production planning. The mathematical model combines marketing and production aspects into a single objective function. The methodology ensures continuous optimization of production programs while considering the dynamics of customer relationships. Practical testing showed that using this methodological approach to decide whether to include a random order in the current production program increased marginal revenue by 1.3 million rubles.
When implementing the proposed methodology, it is important to consider the need to create a database and system for obtaining data for CPI analysis, as well as train staff to work with this metric. During integration, it is important to understand that regular monitoring of metrics and their coordination across departments may be challenging.
Further work on this topic could focus on the following areas: refining and improving the CPI forecasting; identifying and defining discrete categories of priority customers active in a particular industry; and developing an approach to determine the optimal area for the successful development of customized production. The limitations of this study are the testing of the methodology on a limited number of cases; therefore, it requires broader verification on various types of SMEs in the machine-building industry.
The presented study was performed obtained within the work under the Additional Agreement dated 18 April 2024 No. 075-03-2024-278/1 to the Agreement dated 22 January 2024 No. 075-03-2024-278 between the Ministry of Science and Higher Education of the Russian Federation and IDTI RAS for the implementation of state assignments to create a new (youth) laboratory that will carry out research on the topic “Organization and management of hybrid multi-product engineering production”.
[1] Sahoo, S., Lo, C.Y. (2022). Smart manufacturing powered by recent technological advancements: A review. Journal of Manufacturing Systems, 64: 236-250. https://doi.org/10.1016/j.jmsy.2022.06.008
[2] Wang, L., Pan, Z., Wang, J. (2021). A review of reinforcement learning based intelligent optimization for manufacturing scheduling. Complex System Modeling and Simulation, 1(4): 257-270. https://doi.org/10.23919/csms.2021.0027
[3] Guo, F.F., Yang, Z.Y., Qin, W., Wang, Y.Y., Chen, S.Y. (2024). Optimising O2O supply chain strategies through cost-sharing contracts: Strategic analysis and empirical insights. Journal of Engineering Management and Systems Engineering, 3(4): 183-198. https://doi.org/10.56578/jemse030401
[4] Teerasoponpong, S., Sopadang, A. (2021). A simulation-optimization approach for adaptive manufacturing capacity planning in small and medium-sized enterprises. Expert Systems with Applications, 168: 114451. https://doi.org/10.1016/j.eswa.2020.114451
[5] Huang, Z., Jowers, C., Kent, D., Dehghan-Manshadi, A., Dargusch, M.S. (2022). The implementation of Industry 4.0 in manufacturing: From lean manufacturing to product design. The International Journal of Advanced Manufacturing Technology, 121(5-6): 3351-3367. https://doi.org/10.1007/s00170-022-09511-7
[6] Pech, M., Vrchota, J. (2022). The product customization process in relation to Industry 4.0 and digitalization. Processes, 10(3): 539. https://doi.org/10.3390/pr10030539
[7] Qi, Y., Mao, Z., Zhang, M., Guo, H. (2020). Manufacturing practices and servitization: The role of mass customization and product innovation capabilities. International Journal of Production Economics, 228: 107747. https://doi.org/10.1016/j.ijpe.2020.107747
[8] Alabdulwahab, S., Cheong, M., Seo, A., Kim, Y.T., Son, Y. (2025). Enhancing deep learning-based side-channel analysis using feature engineering in a fully simulated IoT system. Expert Systems with Applications, 266: 126079. https://doi.org/10.1016/j.eswa.2024.126079
[9] Tonelli, F., Demartini, M., Pacella, M., Lala, R. (2021). Cyber-physical systems (CPS) in supply chain management: From foundations to practical implementation. Procedia CIRP, 99: 598-603. https://doi.org/10.1016/j.procir.2021.03.080
[10] Singh, N., Panigrahi, P.K., Zhang, Z., Jasimuddin, S.M. (2024). Cyber-physical systems: A bibliometric analysis of literature. Journal of Intelligent Manufacturing, 36(4): 2335-2371. https://doi.org/10.1007/s10845-024-02380-9
[11] Najjari, H., Seitz, M., Trunzer, E., Vogel-Heuser, B. (2021). Cyber-physical production systems for SMEs—A generic multi-agent based architecture and case study. In 2021 4th IEEE International Conference on Industrial Cyber-Physical Systems (ICPS), Victoria, BC, Canada, pp. 625-630. https://doi.org/10.1109/ICPS49255.2021.9468232
[12] Saniuk, S., Grabowska, S. (2021). The concept of cyber-physical networks of small and medium enterprises under personalized manufacturing. Energies, 14(17): 5273. https://doi.org/10.3390/en14175273
[13] Kang, P.S., Wang, X., Son, J.Y., Jat, M. (2024). Analytics models for customer-centric service-based supply chains. In Service 4.0: Technology-Enabled Customer-Centric Supply Chains, pp. 35-55. https://doi.org/10.1007/978-3-031-63875-6_3
[14] Alaskari, O., Pinedo-Cuenca, R., Ahmad, M.M. (2021). Framework for implementation of enterprise resource planning (ERP) systems in small and medium enterprises (SMEs): A case study. Procedia Manufacturing, 55: 424-430. https://doi.org/10.1016/j.promfg.2021.10.058
[15] Seethamraju, R. (2014). Adoption of software as a service (SaaS) enterprise resource planning (ERP) systems in small and medium sized enterprises (SMEs). Information Systems Frontiers, 17(3): 475-492. https://doi.org/10.1007/s10796-014-9506-5
[16] Majstorovic, V., Stojadinovic, S., Lalic, B., Marjanovic, U. (2020). ERP in Industry 4.0 context. In IFIP International Conference on Advances in Production Management Systems. The Path to Digital Transformation and Innovation of Production Management Systems (APMS 2020), Novi Sad, Serbia, pp. 287-294. https://doi.org/10.1007/978-3-030-57993-7_33
[17] Jagoda, K., Samaranayake, P. (2017). An integrated framework for ERP system implementation. International Journal of Accounting & Information Management, 25(1): 91-109. https://doi.org/10.1108/IJAIM-04-2016-0038
[18] Prakash, V., Savaglio, C., Garg, L., Bawa, S., Spezzano, G. (2022). Cloud- and edge-based ERP systems for Industrial Internet of Things and Smart Factory. Procedia Computer Science, 200: 537-545. https://doi.org/10.1016/j.procs.2022.01.251
[19] Zhou, L., Jiang, Z., Geng, N., Niu, Y., Cui, F., Liu, K., Qi, N. (2021). Production and operations management for intelligent manufacturing: A systematic literature review. International Journal of Production Research, 60(2): 808-846. https://doi.org/10.1080/00207543.2021.2017055
[20] Soori, M., Arezoo, B., Dastres, R. (2023). Machine learning and artificial intelligence in CNC machine tools — A review. Sustainable Manufacturing and Service Economics, 2: 100009. https://doi.org/10.1016/j.smse.2023.100009
[21] Alexandrov, I.A., Kuklin, V.Z., Muranov, A.N., Tatarkanov, A.A. (2022). Theoretical foundations of an algorithm of visualization of a set of points of a multidimensional space for use in anthropotechnical decision support systems. Proceedings of the Institute for System Programming of the RAS, 34(4): 201-210. https://doi.org/10.15514/ispras-2022-34(4)-14
[22] Tatarkanov, A.A., Alexandrov, I.A., Chervjakov, L.M., Karlova, T.V. (2022). A fuzzy approach to the synthesis of cognitive maps for modeling decision making in complex systems. Emerging Science Journal, 6(2): 368-381. https://doi.org/10.28991/esj-2022-06-02-012
[23] Anitha, P., Patil, M.M. (2022). RFM model for customer purchase behavior using K-means algorithm. Journal of King Saud University – Computer and Information Sciences, 34(5): 1785-1792. https://doi.org/10.1016/j.jksuci.2019.12.011
[24] Hadad, Y., Keren, B. (2022). A decision-making support system module for customer segmentation and ranking. Expert Systems, 40(2): e13169. https://doi.org/10.1111/exsy.13169
[25] Kiselyov, I. (2025). Strategies to enhance customer experience in logistics through operational optimization. Zhurnal Prikladnych Issledovaniy. Journal of Applied Research, 3: 151-159. https://doi.org/10.47576/2949-1878.2025.3.3.021
[26] Penchev, P., Vitliemov, P., Georgiev, I. (2023). Optimization model for production scheduling taking into account preventive maintenance in an uncertainty-based production system. Heliyon, 9(7): e17485. https://doi.org/10.1016/j.heliyon.2023.e17485
[27] Zanella, F., Vaz, C.B. (2023). Sustainable short-term production planning optimization. SN Computer Science, 4(6): 824. https://doi.org/10.1007/s42979-023-02261-7
[28] Makhazhanova, U., Kerimkhulle, S., Mukhanova, A., Bayegizova, A., Aitkozha, Z., Mukhiyadin, A., Tassuov, B., Saliyeva, A., Taberkhan, R., Azieva, G. (2022). The evaluation of creditworthiness of trade and enterprises of service using the method based on fuzzy logic. Applied Sciences, 12(22): 11515. https://doi.org/10.3390/app122211515
[29] Muminova, E., Ashurov, M., Akhunova, S., Turgunov, M. (2024). AI in small and medium enterprises: Assessing the barriers, benefits, and socioeconomic impacts. In International Conference on Knowledge Engineering and Communication Systems (ICKECS), Chikkaballapur, India, pp. 1-6. https://doi.org/10.1109/ICKECS61492.2024.10616816
[30] Wong, A., Garcia, A.V., Lim, Y.W. (2025). A data-driven approach to customer lifetime value prediction using probability and machine learning models. Decision Analytics Journal, 16: 100601. https://doi.org/10.1016/j.dajour.2025.100