Athoillah Azadi*![]() | Tineke Mandang | Wawan Hermawan
| Tineke Mandang | Wawan Hermawan![]() | Mardison Suhil
| Mardison Suhil![]()
© 2025 The authors. This article is published by IIETA and is licensed under the CC BY 4.0 license (http://creativecommons.org/licenses/by/4.0/).
OPEN ACCESS
Excessive vibration in agricultural machinery, such as rice transplanters, not only degrades planting precision but also accelerates structural fatigue, leading to premature mechanical failure. This study presents a dynamic analysis and deformation prediction of the transmission neck in a modular Jajar Legowo rice transplanter. A computationally efficient predictive framework was developed by integrating Finite Element Analysis (FEA) with the Effective Independence (EI) method. In this study, the EI method is specifically employed to determine the optimal sensor locations and construct a reduced-order model that preserves the key dynamic characteristics of the structure. Unlike traditional modal testing techniques, which require dense and uniformly distributed measurement points, the EI-based approach minimizes the number of sensors while maintaining modal accuracy. A combined numerical–experimental approach was employed, where FEA was used to simulate the natural frequencies and mode shapes, and the results were validated through experimental modal testing using an Electro-Dynamic Shaker and a multi-channel data acquisition system. The findings revealed that the fully assembled modular system exhibited a first natural frequency of 51.69 Hz, which lies within the engine’s operational excitation range of 28.0–95.0 Hz, indicating a significant risk of resonance during field operation. Additionally, the EI method effectively identified a minimal set of optimal measurement points capable of accurately reconstructing the component’s deformation field, forming the basis for a reduced-order predictive model. Overall, this study provides a validated framework for applying the EI method to modular agricultural machinery, offering a practical approach for design optimization, vibration mitigation, and the development of future structural health monitoring systems.
modal analysis, natural frequency, rice transplanter, transmission neck, vibration
The rice transplanter is an agricultural machine developed to enhance the effectiveness and efficiency of rice cultivation by enabling faster and more uniform planting operations. The utilization of rice transplanters has been shown to reduce labor and planting costs, improve irrigation efficiency, and increase productivity due to consistent spacing and planting depth [1]. Among various planting techniques, the Jajar Legowo system is recognized for its capacity to increase rice yield by up to 16% compared with conventional methods [2]. This planting configuration achieves an optimal plant population density of up to 150,000 rice hills per hectare through the insertion of an empty row after every two to four planting rows [3-5]. The arrangement facilitates improved sunlight penetration and air circulation to the border plants, resulting in superior grain quality and enhanced physiological development [2, 3].
Despite its agronomic advantages, intensive operation of rice transplanters exposes structural components to cyclic and impact loads that may degrade mechanical integrity and service life [6, 7]. The principal sources of vibration include the power unit, the main transmission, the feeding transmission, and the oscillatory motion of the planting arms. The transmission neck, which serves as the structural link between the main and feeding transmissions, is particularly susceptible to dynamic stresses. Vibrations transmitted through this component can induce fatigue, deformation, and eventual misalignment of the feeding mechanism [8]. The mechanical reliability of this component, therefore, has a direct influence on planting precision and machine durability [6].
During field operation, the rice transplanter is subjected to external excitation from the engine, drivetrain, and uneven terrain. When the excitation frequency approaches the natural frequency of structural members, resonance may occur [6, 9]. Such resonance amplifies dynamic stresses and accelerates material fatigue, leading to fracture, performance deterioration, and shortened service life of the machinery [10, 11]. Consequently, the identification and mitigation of resonance phenomena are critical for maintaining structural integrity and operational stability.
While several studies have analyzed modal characteristics of agricultural machines [6, 7], limited work has addressed modular structural configurations, where joint flexibility and detachable connections substantially influence vibration response [12, 13]. To address this gap, the present study integrates numerical and experimental modal analysis with the Effective Independence (EI) method to identify and mitigate potential resonance phenomena in modular transmission structures. The research focuses on the vibrational behavior of the transmission neck in a walk-behind, four-row modular Jajar Legowo rice transplanter. The excitation frequencies generated by the main engine are evaluated and compared against the natural frequencies of the transmission neck using finite element modal analysis for simulation and experimental modal testing for validation [14]. In the modular rice transplanter system, the transmission neck was considered a vital structural and functional component. Serving as a load-bearing frame, it supported the main chassis and preserved the geometric alignment between the engine, drivetrain, and planting units. It also transmitted power from the primary transmission to the feeding transmission, which drives the seedling pick-up mechanism. Therefore, any degradation or failure of this component was expected to affect the planting process and reduce operational reliability. To clarify its mechanical and functional role, a schematic illustration has been added (Figure 1) [15].
Figure 1. Main components schematic of Jajar Legowo 2:1 rice transplanter
In cases where resonance frequencies coincide with operational excitation frequencies, optimization strategies are proposed, including geometric modification, material substitution, and the implementation of vibration-damping elements [16]. The outcomes of this study contribute to a deeper understanding of deformation characteristics, resonance traceability, and structural optimization in modular transmission systems. Furthermore, the proposed methodology provides a validated framework for vibration analysis and dynamic design of modular agricultural machinery.
The methodology employed in this research was an experimental approach involving vibration testing and data collection on rice transplanter components subjected to excitation. The objective of the test was to determine the dynamic characteristics of the components, including their natural frequencies and structural homogeneity. The natural frequencies of the components must exceed the excitation frequency range applied during testing. The type of vibration test conducted was a sine sweep test. The excitation frequency range of 5-2000 Hz was selected based on three technical considerations. First, it corresponds to the operational capability and recommended safe working range of the Electro-Dynamic Shaker M124M and the HE600SQA-240 head expander used in this study, which are designed for broadband modal excitation within this interval. Second, previous studies on agricultural machinery frames and modular structures report that fundamental and higher-order natural frequencies generally lie within low-to-medium bandwidths below 2000 Hz, making this range sufficient for capturing both global and localized modes. Third, although the actual engine-induced excitation spectrum falls within approximately 28-95 Hz, testing over a wider bandwidth ensures that higher-order resonances and anti-resonance behaviors can be detected for structural reliability evaluation and future redesign considerations.
The excitation was applied within a frequency range of 5 Hz to 2000 Hz, in accordance with the manufacturer's specifications for the head expander, using a constant amplitude of 1G. The sweep rate used in the test was 1 octave per minute. During the tests, the vibration response of each rice transplanter component was measured using four accelerometers, each placed at the end of the component. One accelerometer served as the control sensor, while the remaining three functioned as response sensors. The position of the control sensor was varied in four different configurations to evaluate the homogeneity of each component. A component was considered homogeneous if the measured natural frequency remained within a consistent range across different control sensor positions or exhibited only minimal variation.
The study was conducted on a four-row, walk-behind Jajar Legowo 2:1 rice transplanter, which operates with alternating paired planting rows and empty spaces to optimize crop arrangement and reduce labor dependency (Figure 2). The transplanter unit consists of a drive system, main and feeding transmissions, planting arms, and a modular transmission neck. The main vibration sources were the engine, the main transmission, and the rotating planting arms. Vibration frequency from the engine was measured using a Benetech GM63A vibration meter. To measure structural vibration, four SENZ SZ3055B2 accelerometers were used, each placed on key machine components. These single-axis sensors had sensitivities of 98.39 mV/g, 97.67 mV/g, 98.74 mV/g, and 97.14 mV/g, respectively.
Figure 2. Four-row walk-behind Jajar Legowo 2:1 rice transplanter
The transmission neck, which connects the drive unit to the planting mechanism, was identified as a critical structural component due to its exposure to cyclic loading during operation. The tested components included:
(1) Three transmission neck models, namely:
(2) All transmission necks were equipped with aluminum mounting frames.
(3) Feeding transmission unit with attached planting arms, also mounted on an aluminum frame.
The component under analysis was mounted on a U-shaped aluminum bracket with 15 mm thickness, placed on a head expander (HE) for vibration testing. The head expander model HE600SQA-240, made of aluminum and measuring 600 × 600 mm, was used to hold the transmission components during testing. The frequency capacity of the HE ranged from 5 to 2000 Hz.
The vibration source was an Electro-Dynamic Shaker model M124M. The shaker was driven by a compatible amplifier, specifically an ETS Solutions (Beijing) Ltd. MPA403 unit, featuring three submodules with a rated power output of 13 kVA, voltage output of 120 Vrms, and current output of 108 Arms. The amplifier weighed 420 kg and measured 500 × 800 × 1850 mm.
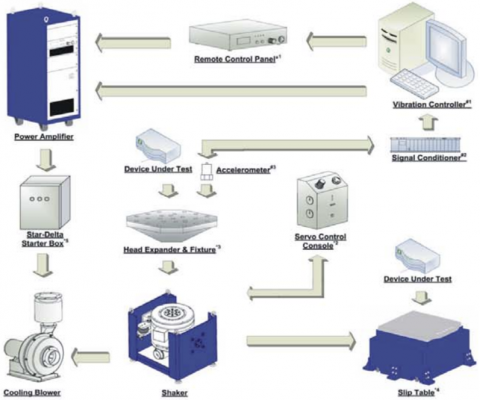
Figure 3. Vibration frequency testing diagram
Vibration data were acquired using a Medallion II VR9500 vibration controller and data acquisition system. This system operated on four channels: one for control and three for response input, allowing real-time monitoring and visualization of frequency spectra on a connected computer as shown on Figure 3. The EI method was applied during sensor placement optimization to ensure linear independence of selected modes, improving modal parameter accuracy, and reducing experimental error during vibration testing [6]. Frequency analysis was conducted using the SolidWorks Frequency Simulation module. To clearly demonstrate how the EI method was applied in selecting the optimal sensor positions, an algorithmic representation is provided below. This pseudocode outlines the iterative selection procedure based on the EI weighting vector.
Input: Modal matrix Φ (size: candidate_points × modes)
Output: Optimized sensor location set S
Initialize S = {all candidate measurement points}
Compute Q = Φᵀ Φ
Calculate EI weighting vector w = diag(Φ Q⁻¹ Φᵀ)
while |S| > required_sensor_count do
Find index k = argmin(w) // least informative location
Remove location k from S
Remove row k from Φ
Recompute Q and w
end while
Return final optimized sensor set S
This stepwise algorithm ensures that only measurement points with the highest contribution to modal orthogonality are retained, resulting in minimized sensor count without compromising modal observability.
The head expander was bolted onto the shaker armature and subjected to vertical excitation at a constant amplitude of 1G, as shown in Figure 4. The connection between the armature and head expander, as well as between the head expander and the test components, was assumed to be rigid. This allowed simplification of the system into a single degree-of-freedom (SDOF) vibration model with a fixed boundary condition at the base, as illustrated in Figure 3. In this model, M denotes the mass, K the stiffness modulus, C the damping coefficient, F the force, and y the displacement along the vertical (y) axis.
Figure 4. Experimental setup and simplified SDOF vibration model using Electro-Dynamic Shaker
The system was assumed to behave as an SDOF vibration model with a fixed boundary condition at the base (Figure 3), based on the rigid connections between the shaker armature, head expander, and test components. In the simplified model, M represents mass, K stiffness, C damping coefficient, F external force, and y the vertical displacement (y-axis).
The equation of motion for the system Eq. (1) is:
$M \ddot{y}+C \ddot{y}+K y=F(T)$ (1)
The shaker applies a harmonic excitation with amplitude FA and angular frequency Ω, expressed as Eq. (2).
$F(t)=F_A \sin \Omega t$ (2)
Substituting Eq. (2) into Eq. (1) yields as Eq. (3).
$M \ddot{y}+C \ddot{y}+K y=F_A \sin \Omega t$ (3)
The general solution of the differential equation is given by Eq. (4).
$y=B \sin \Omega t+C \sin \Omega t$ (4)
Solving for coefficients B and C, the following expressions are obtained (Eq. (5) and Eq. (6)).
$B=\frac{\left(\omega^2-\Omega^2\right)\left(F_A / m\right)}{\left(\omega^2-\Omega^2\right)^2+4 \omega^2 \Omega^2 \zeta^2}$ (5)
$C=\frac{-2 \omega \Omega \zeta(F A / m)}{\left(\omega^2-\Omega^2\right)^2+4 \omega^2 \Omega^2 \zeta^2}$ (6)
3.1 Natural frequency of the drive engine measurement
The primary source of vibration in the rice transplanter originates from the gasoline-powered drive engine with a power output of 5.5 HP. During rice planting operations in the field, the engine shaft typically operates at a rotational speed between 2750–3200 rpm. This indicates that the machine is subjected to continuous and high-intensity mechanical vibrations throughout operation. If the vibration frequency generated by the drive engine matches the natural frequency of other machine components—such as the transmission neck or planting arm—resonance may occur, causing these components to vibrate continuously. This can result in deformation, loosening of bolt fasteners, and other types of mechanical damage.
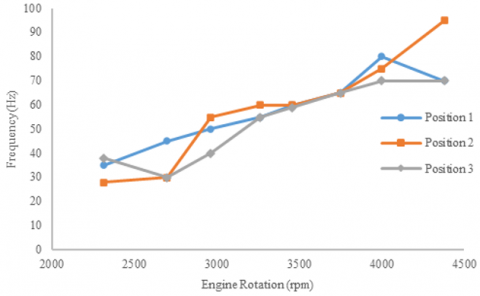
Therefore, prior to conducting natural frequency testing on the machine structure, it is necessary to measure the vibration frequency of the engine independently, starting from low to high engine speeds. Vibration frequency measurements were taken at three locations: the top plate of the engine (position 1), the front plate of the engine (position 2), and the front balancer frame of the drive engine (position 3) as seen on Figure 5.
Measurement positions 1 and 2 capture the vibration frequencies occurring in the main frame of the drive engine, while position 3 reflects the vibration frequency at the closest part to the drive engine. This can serve as a reference to indicate that frequency propagation at certain engine shaft speeds causes changes in the frequency of the nearby frame structure.
Measurements at three locations on the engine assembly (top plate, front plate, and front balancer) across shaft speeds of 2300–4379 rpm yielded dominant excitation frequencies in the range ~28–95 Hz (Figure 6). A low speed of 2300 rpm was set to represent the engine during startup and idle conditions. Additionally, low engine speeds are used when testing machine functions such as planting, seedling tray shifting, and seedling dropping mechanisms. Peak vibration amplitudes (acceleration and velocity) increased with engine speed and exhibited location-dependent magnitudes consistent with non-uniform structural coupling around the crank/balancer region (Table 1).
Vibration frequency measurements of the drive engine were conducted at engine shaft speeds ranging from 2300 rpm to 4300 rpm. Based on the measurements, three unit models were obtained, namely y displacement (mm), v velocity (mm/s) and an acceleration (mm/s2).
Position 1: on top of the engine, Position 2: on the front plate of the engine, and Position 3: on top of the engine balancer
Figure 5. Vibration frequency measurement position of the rice transplanter’s main drive engine
Figure 6. Vibration frequency data at three positions of the engine drive
Table 1. Frequency data based on vibration meter instrument
|
Engine Shaft Speed (rpm) |
Position 1 |
Position 2 |
Position 3 |
||||||
|
α (mm/s²) |
v (mm/s) |
y (mm) |
α (mm/s²) |
v (mm/s) |
y (mm) |
α (mm/s²) |
v (mm/s) |
y (mm) |
|
|
2313 |
22.93 |
62.07 |
0.88 |
16.93 |
44.47 |
0.64 |
11.77 |
34.63 |
0.61 |
|
2699 |
29.33 |
77.57 |
0.95 |
18.63 |
61.40 |
0.72 |
13.00 |
42.93 |
0.68 |
|
2963 |
39.50 |
78.87 |
1.04 |
27.70 |
58.23 |
0.88 |
15.47 |
39.70 |
0.62 |
|
3262 |
51.90 |
102.33 |
0.95 |
30.77 |
52.47 |
0.82 |
13.80 |
25.03 |
0.58 |
|
3458 |
62.00 |
115.00 |
1.08 |
35.50 |
66.27 |
0.64 |
13.63 |
39.13 |
0.58 |
|
3750 |
51.13 |
83.23 |
0.68 |
30.63 |
53.30 |
0.60 |
12.07 |
30.50 |
0.48 |
|
3999 |
53.73 |
72.10 |
0.54 |
28.30 |
38.17 |
0.28 |
15.70 |
25.33 |
0.35 |
|
4379 |
57.43 |
86.17 |
0.53 |
42.20 |
47.23 |
0.37 |
23.27 |
32.30 |
0.10 |
These measured excitation frequencies form the reference band for resonance assessment: any structural mode of the transmission neck that falls within or near this band is at risk of resonant amplification under normal operating conditions. The approach of first quantifying the excitation spectrum prior to modal testing follows recommended practice in modal validation studies for agricultural and vehicular systems [7, 17].
3.2 Comparison between numerical predictions and experimental modal results
3.2.1 Finite element results
The simulation was performed on two main objects: the original (unmodified) transmission neck and the frame transmission neck, which was the result of a modification into a separate (modular) system. The simulation aimed to predict the shape and material of this transmission neck that would provide a natural frequency distinct from the vibration frequency of the main engine. Two possible options were considered for optimization during the design phase: modifying the shape of the transmission neck casing structure or changing the material used for production.
The simulation was conducted using the frequency analysis feature in SolidWorks software. This simulation application allows for the prediction of the natural frequency of a specific design by inputting the desired material parameters. The material used in the simulation was ASTM A36, equivalent to SS400 or JIS G3101 steel plates. This structural steel is commonly used in the construction industry for plates, beams, and other structural profiles. ASTM A36 steel has a minimum tensile strength of approximately 400 MPa and a modulus of elasticity of around 200 GPa.
The initial stage of the simulation preparation involved creating the design drawings for both the original transmission neck and the assembly transmission neck, followed by assigning ASTM A36 as the selected material. The frequency analysis was then conducted through the simulation software. Prior to running the simulation, meshing was performed on the entire surface of the model. The results of the frequency simulation provided the natural frequency values, displacement (deformation) results, and the corresponding Factor of Safety (FoS).
Significant Differences Between the assembly and Original Transmission Neck Designs. This transmission neck design features several additional components that serve specific functional purposes, distinguishing it from the original form. These additional components include:
(1) A bevel gear and sprocket shaft transmission system that replaces the previous sprocket-chain mechanism, allowing for easier knock-down assembly and disassembly.
(2) A toggle clamp, which functions as a locking mechanism at the module interface.
(3) A handle lever to facilitate easier installation and removal of the unit.
(4) A pillow block bearing that supports the sprocket-gear shaft inside the structure.
Based on the results of the frequency simulation on the original transmission neck frame, four natural frequency modes were identified. Mode frequencies represent the distinct natural frequencies at which a component can enter resonance when subjected to corresponding excitation. At each of these modes, resonance can lead to deformation and potential structural damage.
Based on the simulation, four natural frequency modes were identified in the original transmission neck frame, as shown in Figure 7, with the corresponding natural frequencies and displacement values listed in Table 2. The data show that the first natural frequency of the original transmission neck frame occurs at 344.17 Hz, with the highest displacement of 0.602 mm occurring along the Z-axis (vertical direction). The greatest deformation, 0.6 mm along the Y-axis, appears at the second natural frequency mode (429.28 Hz). This deformation is visually evident in the simulation results of the second mode, where the red-highlighted region at the edge of the connection plate between the transmission neck and the feeding transmission indicates significant twisting. This visual cue suggests that the area experiences the most deformation when resonance occurs.
The second simulation was performed on the frame transmission neck design, as shown in Figure 8. This design utilizes a locking system with three toggle clamps, supported by locking plates on both the right and left sides of the interface, ensuring that the two sections cannot move either vertically or horizontally. Additionally, handles are installed on the top parts of each module to assist the operator in gripping the ends of the modules during disassembly and reassembly.
The simulation was conducted by excluding the toggle clamp components due to errors encountered during the meshing process. This issue arose from the detailed geometry in that area, such as bolts, pin holes, pivot grooves, and toggle clamp cavities, which could not be resolved by the meshing algorithm.
Based on the simulation results for the modular unit, four natural frequency modes were identified. The first mode occurred at a frequency of 281.39 Hz, with the maximum displacement observed along the X-axis at 0.28 mm. Similar to the original transmission neck frame, the highest deformation occurred during the second mode of resonance at 285.91 Hz, with a displacement along the Y-axis of 0.59 mm.
Table 2. Four-mode natural frequency data obtained the simulation of the original transmission neck frame
|
Mode |
Frequency |
Displacement |
|||
|
(Rad/sec) |
(Hz) |
X (mm) |
Y (mm) |
Z (mm) |
|
|
1 |
2,162.50 |
344.17 |
5.0014×10⁻¹¹ |
3.1425×10⁻⁹ |
0.60161 |
|
2 |
2,697.30 |
429.28 |
1.4579×10⁻⁷ |
0.59873 |
6.088×10⁻¹⁰ |
|
3 |
4,266.30 |
679 |
1.805×10⁻⁶ |
0.00038159 |
2.4511×10⁻⁷ |
|
4 |
4,835.40 |
769.58 |
4.7176×10⁻⁹ |
2.2993×10⁻⁸ |
0.0063142 |
Table 3. Four-mode natural frequency data obtained the simulation of the modular transmission neck frame
|
Mode |
Frequency |
Displacement |
|||
|
(Rad/sec) |
(Hz) |
X (mm) |
Y (mm) |
Z (mm) |
|
|
1 |
1,768.00 |
281.39 |
0.27665 |
1.5248×10⁻⁵ |
1.5008×10⁻⁷ |
|
2 |
1,796.40 |
285.91 |
4.966×10⁻⁶ |
0.58803 |
0.003986 |
|
3 |
2,260.00 |
359.7 |
0.30769 |
2.7446×10⁻⁷ |
1.5384×10⁻⁹ |
|
4 |
3,991.90 |
635.33 |
0.030238 |
2.0107×10⁻⁷ |
9.2301×10⁻⁸ |
Figure 7. Natural frequency simulation results of the original transmission neck frame
Figure 8. Natural frequency simulation results of the modular transmission neck frame
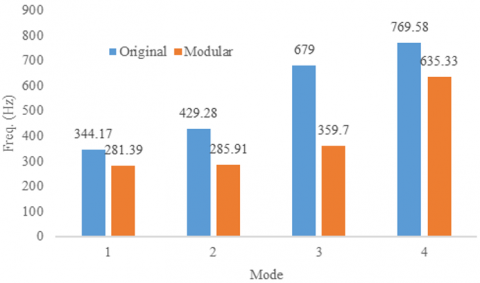
The simulation results demonstrate that the modification of the original transmission neck into a modular system alters its natural frequency. Table 3, which presents a comparison of natural frequency simulation results between the original and modular transmission neck frames, shows that the modification leads to a reduction in natural frequency values across all four modes. A decrease of 18.24% was observed in the first mode compared to the natural frequency of the original frame. The second, third, and fourth modes also showed reductions of 33.4%, 47.03%, and 17.44%, respectively. The largest reduction occurred in the third mode, where the natural frequency dropped from 679 Hz (original frame) to 369.7 Hz (modular frame), representing a 47.03% decrease. This significant change is clearly illustrated in Figure 9, which presents a comparative graph of the natural frequencies between the original and modular transmission neck frames. The simulated trend—modularity reducing global stiffness and down-shifting modal frequencies—is consistent with the broader literature on modular and jointed structures, where increased interface compliance and localization of deformation lower the global natural frequencies [12].
Figure 9. Graphical comparison of natural frequencies between the original and modular transmission neck
3.2.2 Experimental testing results
The natural frequency of the transmission neck prototype can be determined through experimental testing using the Electro-Dynamic Shaker M124M instrument. The shaker (M124M) features multiple bolt holes that are used to attach the aluminum mounting frame, on which the test specimen is placed. Aluminum is used as the material for the mounting frame because it has a significantly higher natural frequency compared to the tested material, thus avoiding resonance with the specimen. The position of the test object, aluminum mounting frame, accelerometer sensors, and shaker setup is illustrated in Figure 10.
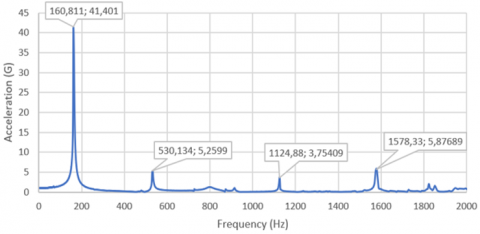
The sine sweep vibration was transmitted from the amplifier to the shaker, starting from a frequency of 5 Hz up to 2000 Hz with a constant amplitude of 1G. The sweep rate applied was 1 octave/minute. The graph of the natural frequency reading results can be observed on the Medallion II type VR9500 data acquisition system, comparing the frequency data (X-axis) and acceleration (Y-axis),
The frequency data obtained from the testing was subsequently processed using Microsoft Excel, and a series of natural frequency values were identified, indicated by the peak points in the graph. Based on the results of three repeated tests, the frequency response graphs and corresponding data are presented in Figure 11.
Figure 10. Natural frequency testing position of the original transmission neck frame, showing: accelerometer sensor (a); transmission neck test object (b); aluminum mounting frame (c); and shaker (d)
Figure 11. Results of natural frequency testing of the original transmission neck
Based on the test results, four modes of natural frequency were identified, with the most significant influence observed at the first mode, which occurred at 160.33 Hz. This indicates that if the vibration from the main engine matches or closely approaches this frequency, resonance may occur. Such resonance can be visually perceived through increased vibrations in the transmission neck, potentially leading to operator discomfort and accelerated wear or damage to the machine.
The testing was continued using the same method on the modular transmission neck prototype. This prototype is a modified version of the original transmission neck, allowing it to be separated into two parts and easily assembled for use in hard-to-reach agricultural areas, thereby improving the mobility of the rice transplanter. The construction of the modular transmission neck consists of an interface section, an interface locking system using toggle clamps, and handle bars to facilitate the assembly and disassembly process. The position of the test object, aluminum mounting frame, accelerometer sensors, and shaker setup is illustrated in Figure 12.
As in the natural frequency testing of the original transmission neck, this test also used sine sweep vibration delivered through an amplifier to the shaker, starting from a frequency of 5 Hz to 2000 Hz with a constant amplitude of 1G. The sweep rate applied was 1 octave/minute. The resulting frequency response graph can be observed on the Medallion II VR9500 data acquisition system, which displays a comparison between frequency data (X-axis) and acceleration (Y-axis), as shown in Figure 13.
Figure 12. Natural frequency testing on the modular transmission neck frame, showing: accelerometer sensor (a); transmission neck test object (b); aluminum mounting frame (c); and shaker (d)
Figure 13. Natural frequency test results of the modular transmission neck
Based on the test results, the average across the three replications shows five natural frequency modes. The first mode occurred at a frequency of 131.19 Hz, while the second through fifth natural frequencies were 752.83 Hz, 816.28 Hz, 991.86 Hz, and 1935.17 Hz, respectively. The first-mode frequency range (131–160 Hz) observed in this study is consistent with the findings of Chen et al. [17], who reported dominant modal frequencies between 120–180 Hz in similar transplanter chassis structures. However, the 18.24% decrease observed in the modular frame aligns with the stiffness reduction reported by Farajian et al. [13] in modular steel assemblies.
In general, the natural frequency most likely to experience resonance during rice transplanter operation is at the first mode frequency. When comparing the test results between the original and modular transmission necks (Figure 14), it was found that the modification into a modular system significantly affected the natural frequency values for each mode.
(1) In the first mode, the modular transmission neck showed a decrease of 18.18%.
(2) In the second mode, it exhibited an increase of 42.87%.
(3) The third mode experienced a decrease of 27.43%.
(4) And in the fourth mode, a decrease of 37.10% was observed.
These variations indicate that the modular design has a considerable influence on the dynamic characteristics of the component.
The natural frequencies of both the original and modular transmission neck frames—based on both simulation and prototype testing—are shown in Figure 15. According to the chart, a decrease in the natural frequency value from the experimental test compared to the simulation is observed in Mode 1. However, in Modes 2, 3, and 4, the natural frequencies obtained from the experimental tests are higher than those from the simulation. This discrepancy may be attributed to simplifications in the simulation model. During the meshing process, simulation preparation failed when encountering detailed and complex geometries such as toggle clamp holes, bolt and nut designs, and other small components. Differences between the detailed CAD model and the actual test prototype significantly affect the measured natural frequency during experimental testing.
Further insight into the dynamic behavior can be obtained by examining the deformation characteristics associated with the second mode. The second mode demonstrated a significant frequency shift in the modular configuration compared with the original design, indicating a change in the deformation energy distribution and stiffness characteristics near the interlocking region. Unlike the first mode, which typically represents global bending or rigid-body-like behavior, the second mode in this study exhibits a combined bending–torsional motion centered around the transmission neck interface. This coupled motion is highly sensitive to joint flexibility, contact stiffness, and geometric discontinuities introduced by the modular locking mechanism.
Changes in the second mode frequency are critical because this mode operates within a deformation pattern that governs dynamic load transfer between the main transmission and planting mechanism [18]. A reduction in this frequency increases modal participation near the machine’s operational vibration band, potentially enlarging vibration amplitude due to resonance proximity and increasing energy transmissibility toward downstream components. Consequently, the second mode plays a decisive role in operational stability, driver comfort, and long-term fatigue resistance, especially in modular systems with jointed or detachable interfaces.
In addition to visual comparison, a quantitative deviation evaluation was calculated to measure the magnitude of discrepancy between FEA predictions and experimental modal results, as presented in Table 4.
Figure 14. Comparison chart of natural frequencies between the original and modular transmission neck across four frequency modes
Figure 15. Comparison graph of natural frequencies based on simulation and prototype testing for the original and modular transmission neck
Table 4. Quantitative deviation analysis between simulation and experimental natural frequencies
|
Mode |
Δ Original (Hz) |
% Deviation (Original) |
Δ Modular (Hz) |
% Deviation (Modular) |
|
1 |
183.84 |
53.40% |
150.2 |
53.36% |
|
2 |
206.05 |
48.01% |
244.75 |
85.59% |
|
3 |
445.88 |
65.65% |
1,217.05 |
338.51% |
|
4 |
46.7 |
6.07% |
356.53 |
56.13% |
Interpretation of simulation–experiment discrepancies. The systematic downward shift of experimental modal frequencies relative to the idealized FEA model is attributable to several well-documented factors:
(1) Model simplifications: critical small geometry (bolt clearances, pin holes, toggle clamp cavities, gasket/clearance effects) were omitted or smoothed in the CAD model to ensure meshability; these omissions reduce modeled compliance contrast and alter local stiffness distribution, a cause of modal mismatch reported in other FEA–test comparisons [17].
(2) Boundary-condition differences: the assumption of perfectly rigid fixation at the bracket base in FEA contrasts with real experimental interfaces that exhibit finite stiffness and micro-movements (shims, fasteners, adhesive mounting of accelerometers). Interface compliance typically reduces measured natural frequencies [19].
(3) Added mass and damping from instrumentation: accelerometer mass, adhesive, and wiring, plus the aluminum mounting frame and any auxiliary fixtures, can alter modal mass and damping, shifting eigenfrequencies — an effect prominent when component masses are small relative to sensor mass. Several modal validation studies for agricultural components have reported similar trends [17].
Because the directional agreement (modularity lowers first-mode frequency) holds between FEA and experiment, confidence in the qualitative conclusions is justified; the quantitative gap suggests that refined modeling (including bolted joint stiffness models, contact elements, or submodeling of the clamp regions) would be required to close the discrepancy—an approach used in vehicle/gearbox studies to improve correlation [20].
Both simulation and experiments show modularization produces lower first-mode frequencies and altered higher-order modes. The largest modal reduction (≈47% in the simulation’s third mode) underlines how local interface flexibility can dominate vibrational behavior; in practice this means the modular neck is more susceptible to lower-frequency excitation than the original design. Comparable outcomes have been observed in modular building and machine studies where disassembly joints or connectors reduced global stiffness and moved resonances to lower frequency bands [13].
The presence of higher-order local modes (e.g., the experimentally observed ≈752–992 Hz cluster) suggests that while the global stiffness is reduced, localized stiffness near clamp regions can create high-frequency modes; this modal separation (low global modes + high local modes) is typical of segmented structures and has implications for sensor design and fatigue assessment [20].
3.3 Natural frequency analysis of full assembly transmission neck
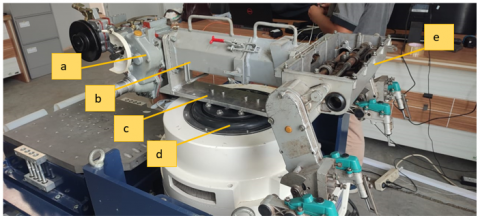
In actual field conditions, the transmission neck frame is integrated with the main transmission at the front and the feeding transmission along with the planting arms at the rear. To evaluate the natural frequency characteristics of the modular transmission neck when fully assembled with both transmission components, a test was conducted on the complete structure, as illustrated in Figure 16. The test involved a sine sweep vibration excitation ranging from 5 to 200 Hz with a constant amplitude of 1G. The sweep rate was set at 1 octave per minute. During the test, the vibration levels experienced by the transmission neck frame were measured using four accelerometer sensors.
The recorded natural frequency data from three trials, obtained using the Medallion II VR9500 controller and data acquisition system, are shown in Figure 17. The test results indicate a significant decrease in natural frequency across all modes. This phenomenon is attributed to the addition of structural elements, including the main gearbox and the feeding gearbox, which are connected into a single assembly. Furthermore, the assembly incorporates various structural materials, such as aluminium, alloy steel, and structural steel, contributing to this reduction.
Based on the complete assembly test, it was observed that Mode 1 exhibited a natural frequency of 51.69 Hz, while the operating frequency range of the rice transplanter's engine lies between 28.0 and 95.0 Hz. This suggests a high probability that the assembly may experience resonance during field operation, as its natural frequency lies within the excitation frequency range of the engine. Due to the limited mounting space available on the test instrument’s shaker table, a full machine assembly test could not be conducted.
Figure 16. Complete test structure of the modular transmission neck. Main transmission (a), transmission neck frame (b), mounting stand (c), head expander (d), and feeding transmission (e)
Figure 17. Natural frequency testing process of the transmission neck in full assembly configuration
A modular transmission neck system for a rice transplanter machine has been successfully designed, optimized, and experimentally validated. The design optimization, carried out through finite element–based natural frequency analysis and prototype vibration testing, demonstrated strong consistency between numerical predictions and experimental trends.
In the first vibration mode, both the original and modular transmission necks exhibited a reduction in natural frequency compared with the finite element simulation. The original transmission neck showed a decrease of 53.42% from its simulated value of 344.17 Hz, while the modular version exhibited a similar reduction of 53.38%. These reductions are primarily attributed to assembly flexibility and boundary condition variations that are difficult to fully replicate in numerical modeling. In contrast, modes 2, 3, and 4 demonstrated notable frequency increases for both designs, with the modular transmission neck showing the highest deviations-163.31%, 126.93%, and 56.12%, respectively-indicating an enhancement in local stiffness at higher-order modes due to modular structural modifications.
Overall, both simulation and experimental results confirmed that the modular transmission neck frame operates safely outside the dominant excitation frequency range of the transplanter’s main engine. However, during full system assembly testing, the first natural frequency of the modular structure was measured at 51.69 Hz, which falls within the engine vibration band of 28.0–95.0 Hz. This overlap suggests a potential resonance risk under operational conditions.
This study demonstrates that modularity significantly alters the dynamic characteristics of structural components, underscoring the importance of accurate joint stiffness modeling in finite element simulations of agricultural machinery. The developed framework can be generalized for dynamic optimization and vibration mitigation in other modular transmission systems, improving reliability and maintainability in agricultural mechanization.
Further refinement is recommended, including localized reinforcement at connection points, damping layer integration, or alternative joint configurations to minimize resonance effects and extend structural lifespan. Future work should incorporate joint stiffness characterization, fatigue life assessment under cyclic loading, and real-time vibration monitoring using wireless MEMS sensors to support predictive maintenance and enhance the long-term performance of modular agricultural machinery.
From an engineering perspective, the findings underline the importance of considering joint-induced compliance, modular interface stiffness, and vibration mode shifting when developing detachable or reconfigurable agricultural machinery. The integrated FEA–EI approach demonstrated in this study provides a transferable framework for early-stage dynamic design evaluation, particularly for equipment with extended structural linkages or oscillating mechanisms. This methodology can be directly adapted for vibration-sensitive components in seeders, fertilizer spreaders, reconfigurable tillage implements, and other modular machinery platforms to minimize resonance-driven fatigue, improve durability, and support predictive maintenance strategies in mechanized farming systems.
This work was supported by the Ministry of Agriculture of the Republic of Indonesia through the Agricultural Engineering Polytechnic (PEPI). The authors would like to thank the Department of Mechanical and Biosystem Engineering, IPB University, for the academic supervision and technical advice provided throughout the study.
The authors are also grateful to the laboratory staff at PEPI for their assistance in conducting the vibration testing using the Electro-Dynamic Shaker M124M system. Special appreciation is extended to the students and collaborators who supported the experimental setup, data acquisition, and prototype development. Their contribution was essential to the successful completion of this research.
[1] Chaitanya, D.N.V., Arunkumar, S., Akhilesh, G.B., Babu, K.A. (2018). Design of rice transplanter. In IOP Conference Series: Materials Science and Engineering, Sikkim, India, p. 012037. https://doi.org/10.1088/1757-899X/377/1/012037
[2] Prasetyo, O.R., Kadir, K. (2019). Teknik penanaman jajar legowo untuk peningkatan produktivitas padi sawah di jawa tengah. Jurnal Litbang Sukowati: Media Penelitian dan Pengembangan, 3(1): 13-13. https://doi.org/10.32630/sukowati.v3i1.88
[3] Erythrina, Z.Z., Zaini, Z. (2014). Budidaya padi sawah sistem tanam jajar legowo: Tinjauan metodologi untuk mendapatkan hasil optimal. Jurnal Litbang Pertanian, 33(2): 79-86.
[4] Permata, A.L., Widjaya, S., Soelaiman, A. (2017). Analisis perbandingan usahatani padi sistem tanam jajar legowo dengan sistem tegel di Kecamatan Seputih Mataram Kabupaten Lampung Tengah. Jurnal Ilmu Ilmu Agribisnis: Journal of Agribusiness Science, 5(1). https://doi.org/10.23960/jiia.v5i1.1669
[5] Rebekka, L., Ginting, J. (2018). Pengaruh sistem tanam jajar legowo terhadap pertumbuhan dan produksi beberapa varietas padi sawah (Oryza sativa L.): The effect of jajar legowo planting system on growth and production of some varieties paddy (Oryza sativa L.). Jurnal Agroteknologi, 6(3): 576-581. https://doi.org/10.32734/ja.v6i3.2404
[6] Jiangtao, J., Kaikang, C., Xin, J., Zhaoyang, W., Baoqiong, D., Jingyuan, F., Xiaojun, L. (2020). High-efficiency modal analysis and deformation prediction of rice transplanter based on effective independent method. Computers and Electronics in Agriculture, 168: 105126. https://doi.org/10.1016/j.compag.2019.105126
[7] Wang, J., Xu, C., Xu, Y., Wang, J., Zhou, W., Wang, Q., Tang, H. (2021). Resonance analysis and vibration reduction optimization of agricultural machinery frame—Taking vegetable precision seeder as an example. Processes, 9(11): 1979. https://doi.org/10.3390/pr9111979
[8] Krishnasamy, J., Jakiela, M.J. (2000). Resonance-induced failure of entrapment: Application to industrial parts feeding. The International Journal of Robotics Research, 19(5): 448-466. https://doi.org/10.1177/02783640022066969
[9] Chowdhury, M., Reza, M.N., Ali, M., Kabir, M.S.N., et al. (2023). Vibration assessment of a 12-kw self-propelled riding-type automatic onion transplanter for transplanting performance and operator comfort. Applied Sciences, 13(3): 1927. https://doi.org/10.3390/app13031927
[10] Han, X., Palazzolo, A.B. (2013). VFD machinery vibration fatigue life and multilevel inverter effect. IEEE Transactions on Industry Applications, 49(6): 2562-2575. https://doi.org/10.1109/TIA.2013.2265871
[11] Liu, K., Yan, C. (2019). Investigation of the influence of splitter blades on the resonance conditions of impellers. Applied Sciences, 9(10): 2051. https://doi.org/10.3390/app9102051
[12] Ashwear, N., Tamadapu, G., Eriksson, A. (2016). Optimization of modular tensegrity structures for high stiffness and frequency separation requirements. International Journal of Solids and Structures, 80: 297-309. https://doi.org/10.1016/j.ijsolstr.2015.11.017
[13] Farajian, M., Sharafi, P., Bigdeli, A., Eslamnia, H., Rahnamayiezekavat, P. (2022). Experimental study on the natural dynamic characteristics of steel-framed modular structures. Buildings, 12(5): 587. https://doi.org/10.3390/buildings12050587
[14] Nadkarni, I., Bhardwaj, R., Ninan, S., Chippa, S.P. (2021). Experimental modal parameter identification and validation of cantilever beam. Materials Today: Proceedings, 38: 319-324. https://doi.org/10.1016/j.matpr.2020.07.396
[15] Azadi, A., Mandang, T., Hermawan, W., Mardison, M. (2025). Modular system design of jajar legowo rice transplanter machine. Jurnal Teknik Pertanian Lampung (Journal of Agricultural Engineering), 14(4): 1176-1188. https://doi.org/10.23960/jtep-l.v14i4.1176-1188
[16] Silva, O.M., Neves, M.M. (2020). A strategy based on the strain‐to‐kinetic energy ratio to ensure stability and convergence in topology optimization of globally resonating one‐material structures. International Journal for Numerical Methods in Engineering, 121(16): 3636-3659. https://doi.org/10.1002/nme.6374
[17] Chen, K., Yuan, Y., Zhao, B., Jin, X., Lin, Y., Zheng, Y. (2022). Finite element modal analysis and experiment of rice transplanter chassis. International Journal of Agricultural and Biological Engineering, 15(5): 91-100. https://doi.org/10.25165/j.ijabe.20221505.6230
[18] Ouyang, H. (2011). Moving-load dynamic problems: A tutorial (with a brief overview). Mechanical Systems and Signal Processing, 25(6): 2039-2060. https://doi.org/10.1016/j.ymssp.2010.12.010.
[19] Mao, K., Li, B., Wu, J., Shao, X. (2010). Stiffness influential factors-based dynamic modeling and its parameter identification method of fixed joints in machine tools. International Journal of Machine Tools and Manufacture, 50(2): 156-164. https://doi.org/10.1016/j.ijmachtools.2009.10.017
[20] Kim, B.S., Han, H.W., Chung, W.J., Park, Y.J. (2024). Optimization of gearbox housing shape for agricultural UTV using structural–acoustic coupled analysis. Scientific Reports, 14(1): 4145. https://doi.org/10.1038/s41598-024-54606-8