Bernard Bali Tamegue![]() | Daniel Romeo Kamta Legue*
| Daniel Romeo Kamta Legue*![]() | Donatien Njomo
| Donatien Njomo![]()
© 2025 The authors. This article is published by IIETA and is licensed under the CC BY 4.0 license (http://creativecommons.org/licenses/by/4.0/).
OPEN ACCESS
This study presents a comprehensive technical, economic and environmental assessment of a hybrid system combining photovoltaic (PV), wind power, diesel generators and battery storage, applied to the Sahelian town of Mongo (Chad). The objective is to identify the most robust configuration in terms of cost and resource variations, based on simulations carried out using Hybrid Optimisation of Multiple Energy Resources (HOMER). The indicators used are net present cost (NPC), cost of energy (COE) and renewable fraction and greenhouse gas (GHG) emissions. The main results reveal that the PV solution coupled with batteries gives the lowest COE (\$0.185/kWh) and minimum NPV (\$9,839), with a renewable fraction of 99.7% and zero CO₂ emissions. In comparison, the PV/Wind/Diesel/Batteries configuration has an LCOE of £0.451/kWh, an NPV of £23,993 and estimated annual emissions of 285 kg of CO₂, mainly due to the high costs of batteries and fuel. The sensitivity analysis shows that variations in the price of diesel and the cost of components (batteries, wind turbines) have a significant impact on the ranking of the configurations. These results suggest that the integration of appropriate hybrid systems can significantly improve access to electricity in rural areas of the Sahel, while limiting the environmental impact and cost for local households.
hybrid system, sensitivity, renewable fraction, net present value, rural electrification
Access to energy for the population has remained one of the main challenges facing Chad for several decades. The rate of access to electricity among the Chadian population is very low, at around 5%. It varies from 14% in the city of N'Djamena to 1% in provincial areas [1]. The production capacity of the national electricity company (NEC), the main operator in the sector, is around 53 MW, mainly produced by diesel-fired power stations: the N'Djamena power station with 22 MW, the Sarh power station with 6.2 MW, the Moundou power station with 1.7 MW and the Abéché power station with 0.9 MW; to which should be added the 20 MW supplied to the SNE by the N'Djamena refinery located 50 km from N'Djamena. The largest electricity production unit in Chad is a 120 MW thermal power plant located at the Komé oil terminal and owned by the multinational ESSO; unfortunately, it is not connected to the public electricity grid. However, Chad is a country with high levels of solar radiation. According to official data, from south to north of this Sahelian country, the sun shines between 2,750 and 3,250 hours per year, with an average radiation of 4 to 6 kWh/m²/day [2, 3]. The highly sunny Sahelian regions of Africa and Chad are ideal for the construction of high-power solar photovoltaic power plants. In some regions, such as Mongo, there can be up to eight months of strong sunshine per year. Several regions of Chad, including Mongo, are also very windy, with wind speeds sometimes exceeding 10 m/s [4]. Figure 1 shows the location of Chad and its different climate zones.

Figure 1. Division of Chad into three types of climate zones [4]
In Chad, fossil fuels are the main sources of energy. The energy crisis, constantly rising oil prices, climate change caused by greenhouse gases, and environmental constraints such as the Paris Agreement and, more recently, the Dubai agreement on greenhouse gas emissions have drawn communities' attention to renewable energy systems that are effective, efficient, sustainable, and virtually pollution-free [3]. Although renewable energies are new, they are stochastic in nature. Their availability is sporadic and must be supplemented by other energy sources such as batteries in most cases. Due to the intermittent nature of renewable energy resources, a system using a single renewable energy source results in oversized components and unnecessary operating and life cycle costs. Two or more forms of energy resources can be combined to form a hybrid energy system that complements the disadvantages of each individual energy resource. Therefore, the design objectives of a hybrid energy system are to minimise the cost of energy production, minimise the purchase of energy from the grid (if connected to the grid), reduce greenhouse gas emissions, reduce the total life-cycle cost, and increase the reliability of the system's energy production [2].
A hybrid energy system consists of various renewable energy conversion components, such as wind turbines, photovoltaic panels and hydraulic turbines, as well as conventional non-renewable generators, such as diesel generators, microturbines and storage devices, such as batteries. A hybrid energy system may include all or some of these components. Access to energy is now an essential and indispensable condition for development. In addition to this limited access to energy services, rural communities in the Sahel region of Chad are characterised by low incomes, generally less than $1.5 per day, increased vulnerability to climate change, villages that are generally far from major urban centres (covering an area of 1,284,000 km²), and a relatively dispersed population [2-4].
It is also noteworthy that access to subsidies is increasingly rare, while the banking system in these regions does not favour the granting of investment loans. As a result, rural communities in Chad are struggling to find both technical and financial solutions capable of quickly addressing their limited access to energy. Harnessing the potential of renewable energy in each locality would, as presented by Abdelhamid et al. [5], be an ideal solution for the electrification of localities in Chad. The author shows that Chad's solar potential alone would be capable of meeting the country's energy demand. And they demonstrated that promoting renewable energies is a sustainable response to the energy problems faced by rural households in Chad. Babikir et al. [1] also demonstrated this by evaluating the direct incident radiation in the locality of N'Djamena using the Capderou method. As the country is dominated by the Sahelian zone, wind speeds are relatively very good for wind power exploitation, particularly in the Mongo areas. Indeed, studies [2-5] have shown that converting wind potential into electricity production would make a considerable contribution. Our work focuses on providing sustainable energy to rural populations living in the Sahel region of Chad, with a view to optimising energy production systems in order to reduce their investment, operating and maintenance costs. On a global scale, recent decades have seen the small-scale development of solar, wind, micro-hydraulic and geothermal systems, which are conducive to rural electrification. Furthermore, advances in rural electrification now offer a choice of multiple decentralised electricity generation systems integrating different renewable and non-renewable energy sources. Hybrid solar PV/Wind/Diesel systems appear to be suitable for rural areas in sub-Saharan Africa in regions with high levels of sunshine and wind, such as the Sahelian regions of Chad [3-7]. According to several authors, combining these energy sources would optimise their use. This is why hybrid energy systems are becoming increasingly common in energy production and conversion around the world. Bouharchouche et al. [7] worked on a hybrid wind-photovoltaic system to predict the system's energy flow dynamics using the Loss of Power Supply Probability (LPSP) method, providing a technical and economic approach based on the probability of non-satisfaction of the selected load. The availability of abundant renewable energy sources in Chad has highlighted the possibility of exploiting these sources as alternatives to electricity generation in rural communities. Solar, wind and other renewable energy sources remain the only solution for supplying electricity to these communities. Various studies have suggested the deployment of solar PV, wind turbines and other renewable energy sources for electricity generation in Chad [6-9]. While many studies have used a single renewable energy source for electricity generation, others have considered the use of hybrid systems combining renewable and non-renewable energies or, in some cases, diesel generators are used as backup power for greater efficiency and reliability [10]. Hybrid renewable energy sources are preferable because total dependence on a single energy source can lead to oversizing of the system, which can ultimately increase the investment cost of the system. There is also the effect of weather conditions due to fluctuations in wind speed and solar radiation. In Nigeria, studies have been conducted in various regions on stand-alone systems using HOMER software [11-17]. The objective is to assess the technical, economic and environmental feasibility of integrating these energy sources (solar and wind) to supply electricity to the village of Mongo and to propose an autonomous system for the community by selecting the optimal configuration based on the lowest net present cost (NPC) and cost of energy (COE). A sensitivity analysis is carried out by varying the cost of batteries, the cost of wind turbines and the cost of diesel. This will serve as a case study for considering rural electrification in various regions of Chad using available renewable energy sources.
The methodology adopted combines analysis of local resources (meteorological data), the load profile of the village studied, and sizing and optimisation simulations carried out using HOMER software. The main steps are: (i) collection and synthesis of local solar and wind data, (ii) construction of an hourly and monthly consumption profile for the village of Mongo, (iii) definition of candidate components (PV, wind turbines, batteries, diesel generator, converter), (iv) multi-scenario simulation and optimisation with sensitivity analyses on critical economic parameters. The simulations allow for the comparison of several architectures: PV/Batteries, Wind/Batteries, PV/Wind /Batteries and PV/Wind/Diesel/Batteries. The selection criteria are based mainly on NPC (Net Present Cost), COE, renewable fraction and GHG emissions. Meteorological data were extracted from climate reanalyses (NASA/alt sources) and validated by published local studies.
2.1 Study area
Mongo is a town located in the Sahelian zone of Chad (latitude: 12.18° N, longitude: 13.85° E, altitude ~424 m). The site has high annual sunshine and favourable wind periods, characteristics that motivate the study of a hybrid solution. The local population depends mainly on agriculture and energy infrastructure is limited; access to electricity is rare, and firewood is widely used for domestic needs. Figure 2 shows the Mongo study area.

Figure 2. Map of the town of Mongo [4]
2.2 Load profile
The consumption profile used for modelling is based on the average domestic usage of a group of 85 households, as well as the needs of a primary school and a health centre. Loads were estimated through local surveys and distributed on an hourly basis to obtain a typical daily profile. The village's total consumption is presented in the form of a daily and monthly profile, with an estimated peak load of 64.02 kW and an overall average daily consumption of approximately 460.80 kWh/day for the village (aggregate values and details provided in the tables and figures in the document). Figure 3 illustrates the daily load profile and Figure 4 presents the hourly and monthly load profiles.

Figure 3. Daily load profile

Figure 4. Hourly and monthly load profile
2.3 Wind potential
Wind data (20-year monthly averages from reanalyses) indicate average speeds at 10 m of between 3.65 and 6.52 m/s depending on the month, with a peak in February (~6.52 m/s). These conditions are compatible with the use of small wind turbines to contribute to the local energy mix. The usual parameters of a wind turbine (start-up speed, rated speed, cut-off speed) were taken into account to estimate the potential annual production. Figure 5 presents the average monthly wind data for the study area.

Figure 5. Average monthly wind data for the study area
2.4 Solar potential
The average daily radiation calculated for the Mongo area is around 5.91 kWh/m²/day, with monthly variations between ~5.28 and ~6.75 kWh/m²/day. These values confirm the potential of a photovoltaic field to meet a significant portion of local electricity demand. The measured clearness index varies between 0.508 and 0.667 depending on the month, indicating that solar energy can be exploited in all seasons. Figure 6 provides the monthly solar data for the study area.

Figure 6. Monthly solar data for the study area
2.5 Diesel price
Fuel cost is a key economic parameter in off-grid scenarios. For this study, the reference price used is approximately £1.20/L in urban areas, with local variations that can bring this cost up to £1.25/L depending on transport and delivery costs. Sensitivity analyses were conducted by varying this price over a representative range to assess its impact on the NPC and COE.
2.6 HOMER software
HOMER was used to simulate and optimise the proposed configurations. HOMER calculates the life cycle cost, LCOE and COE and allows sensitivity analyses to be performed by modifying input parameters (component costs, fuel prices, resources). The main outputs also include annual production by source, surplus energy, diesel generator use and the renewable fraction.
The proposed system comprises photovoltaic panels, one or more small wind turbines, a set of batteries, a converter and a diesel generator serving as a backup. Each component has been defined by technical and economic characteristics taken from generic commercial databases and configured in HOMER. In the HOMER software, Figure 7 illustrates the architecture of the implemented system under study.

Figure 7. Architecture of the system under study [18]
3.1 Solar PV
The PV field considered is based on standard modules (flat panels) with a range of sizes explored between 0 and 160 kW. The costs taken into account are: initial investment (~\$2,500/kW), replacement cost (~\$2,000/kW) and negligible O&M costs. The nominal lifespan has been set at 25 years for the panels.
3.2 Wind turbine
A generic 10 kW wind turbine has been included as an option in the simulations. Investment and replacement costs have been estimated at approximately £4,000/kW, with annual operating and maintenance costs of around £100/year. Production depends heavily on the local wind profile and the characteristics of the machine (power curve).
3.3 Converter
A variable capacity central inverter (0–80 kW) was modelled with a nominal efficiency of 95%. The costs considered are in the order of £200/kW for investment and replacement.
3.4 Diesel generator
The diesel generator studied is a generic 50 kW model, with an estimated investment and replacement cost of $20,000. Maintenance and fuel costs were included in the simulation (consumption and hourly costs). A minimum load constraint (10%) was applied for mechanical performance and operational stability [15-20]. Figure 8 presents the generator efficiency curve.
3.5 Battery
Batteries are used for storage to absorb excess renewable production and provide backup when intermittent sources are insufficient. The unit capacity selected is 6.91 kWh (nominal voltage 6 V) with a round-trip efficiency of 80% and an estimated lifespan of 12 years. In the sizing, the quantity of batteries ranges from 0 to 400 units.

Figure 8. Generator efficiency curve
The main economic indicators calculated by HOMER and used to rank the solutions are: net present cost (NPC), cost of energy (COE) and investment/replacement/operating costs. The NPV represents the discounted sum of all project lifetime costs, including initial investment, replacement, fuel, O&M and other expenses.
4.1 Net present value (NPV)
NPC is assessed by HOMER as the present value of all costs incurred over the lifetime of the project. The calculation involves the capital recovery factor (CRF), the nominal interest rate and the duration of the project. This criterion allows for the comparison of architectures with different financing horizons and expenditure profiles [20-23].
$N P C=\frac{C_T}{C_{R F}\left(i, R_{\text {Proi }}\right)}$ (1)
where,
CT (Annual total cost): the annualised total cost;
CRF (Capital Recovery Factor): the capital recovery factor;
i: the interest rate;
RProj: project duration (D).
The CRF (ratio used to calculate the present value of an annuity) is given by [21]:
$C_{R F}(i, D)=\frac{i(1+i)^D}{(1+i)^D-1}$ (2)
$i=\frac{i_0-f}{1+f}$ (3)
where,
D: the system's lifespan in years;
i0: the nominal interest rate;
f: the annual inflation rate.
4.2 Cost of energy (COE)
The COE represents the unit cost ($/kWh) of useful electricity delivered by the system. It is obtained by dividing the total annual cost by the amount of useful annual energy (net consumption). The COE is an essential metric for comparing the economic competitiveness of different off-grid configurations.
$C O E=\frac{C_T}{E_{\text {prim. } A C}+E_{\text {prim. } D C}+E_{\text {grid.sales}}}$ (4)
where,
$C_{\text {ann.tot }}$: total annualised cost;
$E_{\text {prim.AC }}$: primary AC charge;
$E_{\text {prim.DC }}$: primary DC charge;
$E_{\text {grid.sales }}$: total grid price.
4.3 Renewable fraction (RF)
The renewable fraction is defined as the share of energy supplied by renewable sources (PV and wind) relative to the system's total energy production. A high RF reflects lower dependence on fossil fuels and a reduced environmental impact.
$R F(\%)=\left(1-\frac{\sum P_{diesel}}{\sum P_{renouvelable}}\right) * 100$ (5)
where,
$P_{\text {diesel }}$ is the output power of the diesel generator and $P_{\text {renouvelable }}$ is the output power of renewable sources (solar and wind).
Two energy management modes were considered: load following (LF) and cycle charging (CC). In LF mode, renewable sources primarily supply the load; the surplus is used to charge the batteries, and the diesel generator only intervenes when the minimum SOC is reached. In CC mode, the diesel generator can operate to simultaneously satisfy the load and recharge the batteries. For this study, the control logic favours LF mode in order to minimise fuel consumption and reduce overall NPC. A minimum SOC threshold of 40% was selected to trigger the automatic start-up of the diesel generator.
Simulations carried out using HOMER enabled several thousand combinations (parametric scale) to be explored in order to identify technically feasible and economically attractive solutions. The results presented below summarise annual production by source, consumption, surplus energy, and economic and environmental indicators for the configurations compared. Table 1 presents the various configurations of our system.
Table 1. Analysis of off-grid systems for average household consumption with initially estimated costs.
|
Les Configurations |
NPC ($) |
COE ($/kW) |
|
PV/Batteries |
9,839 |
0,185 |
|
Wind turbine/Batteries |
10,447 |
0,197 |
|
PV/Wind turbine/Batteries |
12,326 |
0,232 |
|
PV/W/Diesel/Batteries |
23,993 |
0,451 |
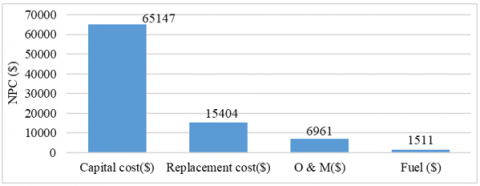
Figure 9. Configuration of the hybrid system in the HOMER software
As shown in Figure 9, the capital cost represents the main expenditure of the system, primarily consisting of the batteries and the photovoltaic components, followed by the replacement and fuel costs.
6.1 System optimisation
Among the configurations tested, the optimised solution selected by HOMER includes: 160 kW of PV, a 50 kW diesel generator, 320 battery units and an approximately 80 kW converter. For this configuration, the NPC is \$9,839 and the COE is \$0.185/kWh. The estimated total annual production is approximately 342,258 kWh/year, divided between PV (~244,448 kWh/year, or ~71%), wind (~97,629 kWh/year, or ~28.5%) and diesel (~181 kWh/year, ~0.5%). Annual surplus energy is approximately 24,743 kWh (Figure 10).

Figure 10. Average monthly electricity production of the optimal configuration
6.2 Sensitivity analysis
The sensitivity analysis is presented through Figures 11-15 and Table 2. Sensitivity analyses were performed by varying: (i) the cost of batteries (±25% / +15%), (ii) the cost of wind turbines (±25% / +15%) and (iii) the price of diesel (1.2 \$/L base, tests at 1.6, 1.8 and 2.0 \$/L). These variations affect the NPC and COE and, in some scenarios, change the ranking of configurations. For example, a significant drop in battery prices makes PV/battery systems even more competitive; conversely, a sharp rise in fuel prices favours architectures that integrate more renewables. Figure 11 presents a sensitivity analysis with battery purchase costs 25% lower and 15% higher, while maintaining the cost of other fixed equipment.
Compared to the initial situation, the 15% increase in battery costs does not affect the ranking of the different systems, whereas when these costs are reduced by 25%, the PV/battery system, the hybrid PV/Wind/Diesel/Battery systems and the PV/diesel systems retain their positions, but the others change positions. In short, the variation in battery costs in this case has little influence on the ranking of systems and therefore on which systems to prioritise. Figure 12 shows a similar analysis based on variations in the cost of wind turbines.

15% increase in initial battery cost

25% less than the initial cost of batteries
Figure 11. Change in battery costs and costs of other fixed equipment

15% increase in the initial cost of wind turbines
Figure 12. Change in the cost of wind turbines and other fixed equipment
Compared to the initial situation, the 15% increase in the cost of wind turbines does not affect the ranking. A 25% decrease in wind turbines does not affect the ranking of the top three and bottom three systems, while the median positions are changed. Among these median positions, systems with photovoltaics have fallen by one to two positions. Systems 4 to 7 changed positions. The Wind/Diesel/Battery system occupied the 4th position, the PV/Diesel/Battery system gained 5 positions and finally, the PV/ Wind / Diesel / Battery system fell back to 6th position. In summary, when varying the cost of wind turbines, the top three systems to prioritise remain the same, as does the last system. The systems to avoid remain the photovoltaic/diesel system and the wind/diesel system.
Another sensitivity analysis was performed for the cost of diesel in Figure 13. The estimated starting cost is £1.2/L. The other costs analysed are 1.6$/L, 1.8$/L and 2$/L.

1.6$/L

1.8$/L

2$/L
Figure 13. Change in diesel costs and costs of other fixed equipment
For diesel costs of £1.6/L and £1.8/L, only the 4th and 5th systems underwent a change. The first system to favour is therefore the hybrid PV/wind/diesel/battery system. The photovoltaic system with batteries still ranks first.
At £2/L, systems 1, 2, 3 and the last three systems have not changed position. The PV / Wind / Battery system has moved up one place, the PV / Wind / Battery system has moved from 6th to 4th and the PV/wind/diesel/battery system has moved down one place. These analyses of diesel costs show that as soon as there is an increase in diesel costs, the hybrid PV/wind/diesel/battery system is preferable, while the photovoltaic system with batteries is always to be avoided. All of these analyses show that the photovoltaic system with batteries should always be avoided for the situation studied, whereas the wind-diesel system with batteries is preferable even with a variation in the cost of batteries and wind turbines and an increase in the cost of panels. On the other hand, the hybrid PV / Wind / Diesel system with batteries is preferable if the cost of panels decreases by 50% or if the cost of diesel increases. Overall, the systems to consider are the hybrid PV/wind/diesel system with batteries in the near future (given that the cost of panels is falling and the cost of diesel is rising) and the PV system with batteries is a choice for today's systems, but it will not be the long-term solution.
In general, considering the village's total consumption, various off-grid hybrid systems comprising solar panels, wind turbines, batteries and diesel generators were analysed. Figure 11 shows the systems in order from most economical to least economical according to the NPC [6, 23].
It can therefore be seen that the best system would be PV/batteries and the second best would be wind/battery. The two worst systems are PV/diesel and wind/diesel. Over the years, diesel alone has not been the most economical solution. The PV/wind/diesel/battery system comes after the PV/wind/battery systems. To enhance the interpretation of the sensitivity analysis, future visualizations could include heatmaps to display the combined impact of component costs and fuel prices on COE and NPC, as well as radar charts to compare multiple scenarios across technical, economic, and environmental indicators. These graphical representations would allow for a clearer identification of the most robust configurations.
6.3 Environmental impact
The calculated annual GHG emissions show that certain architectures (PV alone + batteries, PV/wind + batteries) can reduce direct CO₂ emissions to virtually zero, while configurations involving significant use of diesel have non-zero emissions (e.g. ~285 kg CO₂ / year for PV/wind/diesel/batteries in the baseline scenario). The optimal choice in terms of NPC/COE nevertheless represents a compromise between cost and environmental impact, with a high renewable fraction (~98–99% for the preferred configurations) (Table 2).
Table 2. Comparison of the environmental impact
|
Configuration |
GHG Emission (kg/year) |
|
Wind/diesel/battery |
5,755 |
|
PV/wind/diesel/battery |
285 |
|
PV/wind/battery |
0 |
|
PV/battery |
0 |
6.4 Economic and energy assessment
The economic analysis shows that, despite higher initial costs for batteries and PV panels, the PV/Battery solution may prove to be the most cost-effective over the considered lifetime, particularly if battery costs decrease. Table 3 and Figure 14 highlight the sensitivity of these indicators to fuel cost and price assumptions.

Figure 14. Comparison of economic evaluation
Table 3. Comparison of energy parameter assessments
|
Configurations |
Energy Production (kWh/year) |
Energy Consumption (kWh/year) |
Surplus Energy (kWh/year) |
|
PV/Wind/Battery |
341,568 |
60,357 |
274,270 |
|
PV/Wind/Diesel/Battery |
342,258 |
60,386 |
274,968 |
|
PV/Wind/Battery |
356,460 |
60,386 |
275,651 |
|
PV/Battery |
536,652 |
60,340 |
724,728 |
6.5 Operational performance
Simulated profiles indicate that battery state of charge generally remains between 40% and 100% over a typical year, in line with the adopted management strategy (Figure 15). The energy stored and used annually is consistent with demand, leaving a surplus that could potentially be used for additional purposes or sold if a local market exists.

Figure 15. Energy balance for a typical year with the optimal configuration
This study provides an in-depth assessment of a hybrid PV/wind/diesel/battery system for the town of Mongo (Chad). Simulations show that an architecture heavily focused on photovoltaics combined with storage offers the lowest LCOE and a very high renewable fraction, while the integration of a diesel generator remains useful to ensure reliability in the event of a prolonged shortage of renewable resources. Sensitivity analyses confirm that battery costs and diesel prices are major levers influencing the competitiveness of solutions. Consequently, public policies promoting lower storage costs and access to financing can accelerate the energy transition in rural Sahelian areas.
Future work could further the assessment by incorporating innovative financing scenarios, advanced management strategies (optimal control, demand-side management) and a more comprehensive analysis of the life cycle of components to refine the environmental footprint.
This work was carried out within the framework of academic research at NASA (MERRA-2) Version 2. The authors would like to express their gratitude to the institution for providing the computational facilities and technical support necessary for this study.
|
kWh/m².d |
kilowatt hour per square metre per day |
|
W/m² |
watt per square metre |
|
CRF |
capital recovery factor |
|
NPC |
net present cost |
|
COE |
cost of energy |
|
PV |
photovoltaic |
|
HOMER |
Hybrid Optimisation of Multiple Energy Resources |
|
GHG |
greenhouse gas |
|
SOC |
state of charge |
[1] Babikir, M.H., Njomo, D., Barka, M., Khayal, M.Y., et al. (2020). Modeling the incident solar radiation of the city of N’Djamena (Chad) by the Capderou method. International Journal of Photoenergy, 2020(1): 6292147. https://doi.org/10.1155/2020/6292147
[2] Soulouknga, M.H., Doka, S., Kofane, T.C. (2020). Techno-economic assessment of wind energy conversion systems for power generation for the city of N'Djamena in Chad. Rеvuе des Energies Renouvelables, 23(2): 318-330.
[3] Bernard, B.T., Chara-Dackou, V.S., Goron, D., Babikir, M.H., Njomo, D. (2022). Empirical relationships between global and diffuse radiation and sunshine duration in Chad: Polynomial regression approach. International Journal of Heat and Technology, 40(1): 121-129. https://doi.org/10.18280/ijht.400114
[4] Programme du Système d’Information pour le Développement Rural et l’Aménagement (P-SIDRAT). ATLAS du TCHAD (Une carte extraite du site PVGIS).
[5] Abdelhamid, I.H., Hauglustaine, J.M., Abakar, M.T. (2016). La promotion des énergies renouvelables: Un réponse durable à la problématique énergétique des ménages ruraux au Tchad. Revue des Énergies Renouvelables, 19(1): 137-146.
[6] Mouangue, R.M., Kazet, M.Y., Kuitche, A., Ndjaka, J.M. (2014). Influence of the determination methods of K and C parameters on the ability of Weibull distribution to suitably estimate wind potential and electric energy. International Journal of Renewable Energy Development, 3(2): 145-154. https://doi.org/10.14710/ijred.3.2.145-154
[7] Bouharchouche, A., Bouabdallah, A., Berkouk, E.M., Diaf, S., Belmili, H. (2014). Conception et réalisation d’un logiciel de dimensionnement d’un système d’énergie hybride éolien-photovoltaïque. Rеvuе des Energies Renouvelables, 17(3): 359-376.
[8] Salisu, S., Mustafa, M.W., Olatomiwa, L., Mohammed, O.O. (2019). Assessment of technical and economic feasibility for a hybrid PV-wind-diesel-battery energy system in a remote community of north central Nigeria. Alexandria Engineering Journal, 58(4): 1103-1118. https://doi.org/10.1016/j.aej.2019.09.013
[9] Babikir, M.H., Njomo, D., Barka, M., Chara-Dackou, V.S., Kondji, Y.S., Khayal, M.Y. (2021). Thermal modeling of a parabolic trough collector in a quasi-steady state regime. Journal of Renewable and Sustainable Energy, 13(1): 013703. https://doi.org/10.1063/1.5145272
[10] Babikir, M.H., Chara-Dackou, V.S., Njomo, D., Barka, M., Khayal, M.Y., Legue, D.R.K., Gram-Shou, J.P. (2020). Simplified modeling and simulation of electricity production from a dish/Stirling system. International Journal of Photoenergy, 2020(1): 7398496. https://doi.org/10.1155/2020/7398496
[11] Dhakal, R., Yadav, B.K., Koirala, N., Kumal, B.B., Moussa, H. (2020). Feasibility study of distributed wind energy generation in Jumla Nepal. International Journal of Renewable Energy Research, 10(3): 1501-1513 https://doi.org/10.31224/osf.io/gfkd6
[12] El Khchine, Y., Sriti, M., Elyamani, N.E.E.K. (2019). Evaluation of wind energy potential and trends in Morocco. Heliyon, 5(6): e01830. https://doi.org/10.1016/j.heliyon.2019.e01830
[13] Ayik, A., Ijumba, N., Kabiri, C., Goffin, P. (2021). Preliminary wind resource assessment in South Sudan using reanalysis data and statistical methods. Renewable and Sustainable Energy Reviews, 138: 110621. https://doi.org/10.1016/j.rser.2020.110621
[14] Alphonse, S., Bikai, J., Fokone, A.T., Cesar, K. (2020). Potentiel énergétique éolien et profil de consommation d’énergie dans le village Wouro Kessoum Ngaoundéré Cameroun. Journal of Renewable Energies, 23(1): 72-85. https://doi.org/10.54966/jreen.v23i1.34
[15] Gul, M., Tai, N., Huang, W., Nadeem, M.H., Yu, M. (2020). Evaluation of wind energy potential using an optimum approach based on maximum distance metric. Sustainability, 12(5): 1999. https://doi.org/10.3390/su12051999
[16] Jiang, P., Liu, Z., Niu, X., Zhang, L. (2021). A combined forecasting system based on statistical method, artificial neural networks, and deep learning methods for short-term wind speed forecasting. Energy, 217: 119361. https://doi.org/10.1016/j.energy.2020.119361
[17] Hermann, D.T., Donatien, N., Armel, T.K.F., René, T. (2022). Techno-economic and environmental feasibility study with demand-side management of photovoltaic/wind/hydroelectricity/battery/diesel: A case study in Sub-Saharan Africa. Energy Conversion and Management, 258: 115494. https://doi.org/10.1016/j.enconman.2022.115494
[18] Stoyanov, L. (2011). Etude de différentes structures de systèmes hybrides à sources d'énergie renouvelables. Doctoral dissertation, Université Pascal Paoli.
[19] Enríquez-Velásquez, E.A., Benitez, V.H., Obukhov, S.G., Félix-Herrán, L.C., Lozoya-Santos, J.D.J. (2020). Estimation of solar resource based on meteorological and geographical data: Sonora state in northwestern territory of Mexico as case study. Energies, 13(24): 6501. https://doi.org/10.3390/en13246501
[20] Akpo, A.B., Damada, J.C.T., Donnou, H.E.V., Kounouhewa, B.B., Awanou, C.N. (2015). Evaluation de la production énergétique d’un aérogénérateur sur un site isolé dans la région côtière du Bénin. Journal of Renewable Energies, 18(3): 457-468. https://doi.org/10.54966/jreen.v18i3.520
[21] Ouedraogo, S., Lolo, K., Attipou, K., Senah, A., Ajavon, A., Tiem, S. (2020). Assessment of wind potential in the perspective of water pumping in sahelian area of Burkina Faso. International Journal of Engineering Research & Technology, 9(3): 231-243.
[22] Abbes, D., Martinez, A., Champenois, G., Gaubert, J.P. (2012). Etude d’un système hybride éolien photovoltaïque avec stockage: Dimensionnement et analyse du cycle de vie. European Journal of Electrical Engineering, 15(5): 479-497.
[23] Fleck, B., Huot, M. (2009). Comparative life-cycle assessment of a small wind turbine for residential off-grid use. Renewable Energy, 34(12): 2688-2696. https://doi.org/10.1016/j.renene.2009.06.016