Mohammed Riyadh Y. Al-Fakhar![]() | Ahmed Nasser B. Alsammak*
| Ahmed Nasser B. Alsammak*![]()
© 2025 The authors. This article is published by IIETA and is licensed under the CC BY 4.0 license (http://creativecommons.org/licenses/by/4.0/).
OPEN ACCESS
Protection mechanisms are essential to prevent catastrophic failures and ensure power network stability. However, accurately identifying and characterising power flows remains challenging, especially when fault resistance and location change. Incorrect fault identification may cause overall system instability and loss of synchronisation. This work presents a novel protection method to improve fault detection and reduce power swings by integrating a fuzzy inference system (FIS) with distance relays and a specialized proposed stability boundary curve. This method effectively differentiates between stable, critical, and unstable power swings, using fuzzy logic to enhance the sensitivity and accuracy of fault and power swing diagnosis. The proposed system allows intelligent load-shedding strategies to restore system stability when needed and can adapt to various fault resistances and locations. The protection system combines the distance relay, the stability boundary curve, and a Sugeno-type FIS. The technique was validated through MATLAB/Simulink simulations on a power system consisting of three buses and two generators. Simulations on a 700 km transmission line demonstrated the system’s efficiency in both fast fault detection (T2) and precise stability evaluation (T4-T2). Load-shedding strategies were applied, which contributed to system recovery, demonstrating the reliability and strength of the proposed system in avoiding major outages.
fault resistance, transient stability, impedance distance relay, transmission lines, protection system, power swing, impedance trajectory, fuzzy logic
In power systems, distance relays are key protection devices due to their simplicity and ability to locate faults using local voltage and current measurements, but they may fail during power swings, making power swing blocking (PSB) vital for proper operation [1]. A number of techniques have been put forth by researchers to identify power swing (PS) and initiate PSB function. The most popular way to do this is to use the rate at which impedance varies in a certain location [2, 3]. Accordingly, monitoring the temporal variation of this rate enables a detector to separate PSs from faults. Shift periods in each zone are at least as long as the nominal frequency, and impedance shifts occur exceedingly slowly for slow PSs (1 Hz) [4]. This method works well to detect a slow PS and turn the relay off. However, it is unable to detect faults that occur during a PS or quick PSs (5 Hz) [5, 6]. A “double-blinder” arrangement was proposed to address the shortcomings of simple impedance-rate detectors. Despite some downsides, it often achieves the desired outcome. It requires in-depth offline analysis to determine the right PSB values, and fails to distinguish between faults and quick power swings, as well as handle obstructions during faults [7]. Distance relays are crucial for protection, particularly in scenarios involving "under-reach" and "over-reach", as they rely on impedance measurements between the relay fault location [8, 9]. Impedance fluctuations may be a dependable predictor of fault occurrence because distant relay impedance changes during power system disturbances but stays constant during faults [10]. Among FACTS technologies, the Static Synchronous Compensator (STATCOM) is widely used; however, its presence poses additional difficulties for distance relays, affecting response accuracy and complicating discrimination between faults and power swings [11, 12]. Relay settings have been adjusted to mitigate these effects, as devices such as the Unified Power Flow Controller (UPFC) also affect the impedance, causing problems for impedance-based protection units in differentiating between power swings and faults [13]. The importance of PS detection is highlighted using a combination of concentric impedance characteristics and continuous apparent impedance monitoring due to impedance change throughout the transient period [14]. The reduced-resistance technique is capable of distinguishing power swings from faults without requiring detailed network analysis, and it can also identify faults that occur during swings. Nevertheless, its performance declines when a three-phase fault happens simultaneously with a delayed swing [15]. A detection method is proposed that utilizes trajectory monitoring to identify the separation point between stable and unstable PSs, improving the ability to block the relay at the correct moment [16]. Faults during power swings were detected using a fast Fourier transform (FFT) of the DC component of the current. A proposed FFT-based method was developed for fault detection, but its ability to detect faults relies on specific values without a straightforward procedure [17]. To overcome FFT limitations, wavelet analysis was employed [18]. Relay logic then processed data acquired from numerical relays at a 40.96 kHz sampling rate (fs) [19]. The detection of symmetric faults has been addressed by a high-speed method as given in [20]. A method is proposed that applies the wavelet transform (WT) to incorporate impedance measurement and detect changes caused by swings and faults [21]. Wavelet transform (WT) has been used to analyze current changes in order to detect faults with various resistances during power swings (PSs) [22]. For power system protection, one study proposed a technique grounded in Prony analysis [23]. An analysis of several states revealed that the Prony method performs better than FFT-based methods [24]. Additionally, an algorithm has been proposed to detect three-phase faults during PSs by using the current waveform, with this method of operation relying on the reverse decline in the DC current rate [25]. Hybrid renewable energy systems, including solar and wind, aid in reducing power swings in times of emergency, enhance system stability, and reduce losses [26, 27]. Using steam turbines with several masses during major transitions improves system stability by preventing synchronisation loss [28]. It has been confirmed that changes in system characteristics do not alter the effectiveness of artificial intelligence-based methods for system security in studies [29-31]. Several PS detection methods have been developed and are based on the adaptive neuro-fuzzy inference system (ANFIS). In addition to being unaffected by variables like system characteristics and fault location, these methods distinguish PSs from faults with exceptional speed and precision [32-34]. A new relay configuration employing fuzzy logic has been introduced to lessen the impact of UPFC and to improve both the speed and accuracy of fault detection [35]. Transient stability in a two-machine, three-bus system was improved using a fuzzy logic–controlled Static Var Compensator (SVC), reducing rotor angle overshoot by 11.94%, improving settling time by 4.7%, and compensating about 16.2% of the system’s equivalent kinetic energy [36]. Phasor quantities and network admittance have been employed to discriminate between power swings and coincident faults. The analysis indicates that fundamental-frequency voltage and current phasors exhibit discriminative features that are especially useful for protective decision-making when symmetrical three-phase faults occur during scheme operation [37]. A detection method based on moving window averaging was proposed. A low-pass filter is applied to the distance relay using the moving window averaging approach. One of the major problems with this method is its inability to detect multi-mode PSs. Additionally, PSs that arise in a single phase cannot be detected by this method [38]. The proposed detection method is based on the rate of change in the root-mean-square value of the current. When PS happens in a single phase, this method wrongly kills the line, but it can detect multi-mode PSs and other kinds of high-resistance faults during PSs [39]. PSs and faults have been distinguished using the instantaneous power frequency. Unstable and stable PSs, as well as simultaneous single-phase high-resistance faults, may be accurately detected using this method; however, three-phase high-resistance faults prevent the relay from being stopped [40]. A detection method based on the rate of change of the average apparent power has been proposed. PSs that arise in a single phase cannot be detected by this method [41]. For determining the rate of faults that occur during PSs, the proposed method takes advantage of changes in the negative component of apparent power. Multi-mode PSs cannot be detected by this method, which has a somewhat slow response time in detection [42]. Deep learning models like Convolutional Neural Networks (CNN) and Long Short-Term Memory (LSTM) networks have demonstrated strong potential in power system protection by enhancing fault detection, differential protection, and anomaly identification with faster and more accurate responses [43]. Hybrid CNN-LSTM frameworks, optimized with genetic algorithms, can also detect false data injection attacks by capturing spatial and temporal patterns, achieving higher precision than conventional methods [44]. The impact of fault resistance and line length on protection mechanism effectiveness was analyzed. Results showed significant effects on relay performance and system stability. These findings align with the current study's assumptions, reinforcing the chosen approach's reliability and the importance of considering these factors for protection improvements [45].
All the previous studies have not included and collected the intelligent fuzzy distance relay that distinguishes faults and power swings of various types and performs load shedding based on the stability detection curve. The goal of this paper is to design two fuzzy systems: one to improve fault detection through a fuzzy impedance distance protection system, and another to prevent critical power swings by shedding load and restoring system stability. It also aims to activate the main protection in case load shedding is insufficient or faults occur, ensuring continued system reliability.
A MATLAB/Simulink environment was employed to analyze how power swings influence the stability of the electrical grid. Power swings arise when abrupt disturbances such as faults or sudden changes in load demand cause fluctuations in the power exchanged between generators and loads. These swings have a direct impact on generator rotor angle, voltage profiles, and system frequency, potentially challenging the performance of control elements like power system stabilizers (PSS) and automatic voltage regulators (AVR), which are intended to lessen such adverse impacts. The test system under simulation comprises 2 synchronous generators linked through three buses, incorporating 2 power transformers with voltage ratings of 13.8 / 500 kV and 500 / 13.8 kV. The configuration also features a 700 km, 500 kV transmission line, which forms a crucial component of the simulated network. Both PSS and AVR devices are included for each generator unit. The stabilizers are capable of being set to different operational modes—namely, disabled, multiband, or generic. In this particular analysis, the generic mode was selected, as it provided the most satisfactory enhancement of rotor angle stability based on comparative results. A purely resistive load with a total demand of 5000 MW is connected to the system, a choice made to maximize the effect on the network since active power is directly sourced from the generators. For monitoring, a dedicated measurement unit is set up at Bus 3 to record voltage and current values, from which the system's impedance—both resistance (R) and reactance (X)—is computed for relay performance evaluation. Figure 1 depicts the experimental system's MATLAB/Simulink model.
The simulated network assumes two generation sources: a near M2 with 5000 MVA rating and a remote M1 of 1000 MVA. Together, they supply the 5000 MW resistive demand at the load center. In steady-state operation, M1 contributes about 950 MW, while M2 delivers roughly 4046 MW. The transmission line carries around 944 MW of real power, which is near the Surge Impedance Loading (SIL) limit of 977 MW. This arrangement ensures efficient active power delivery while limiting the need for reactive power adjustment, supporting both stability and optimal power flow. In the event of a pronounced power swing, a load-shedding protocol is initiated via circuit breaker no. 1 to alleviate stress on the network. If this measure does not suffice and system instability persists, additional disconnection is executed through circuit breakers no. 2 and 3 to safeguard the grid from widespread disturbances. The simulated system integrates all essential components at their rated specifications to ensure prompt detection, isolation of faults, and preservation of system stability during transient events.
Figure 1. MATLAB/Simulink model for the tested power system
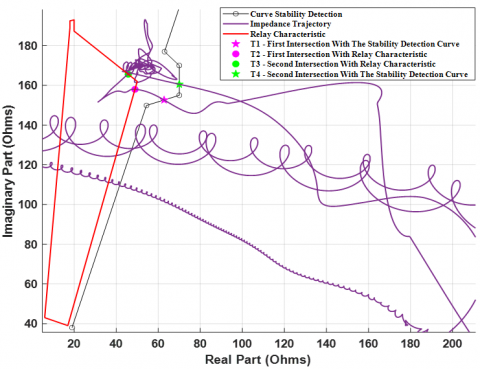
In the event of a load loss or a malfunction in the protection scheme, remedial actions—such as disconnecting the line or isolating the faulted section are applied. Figure 2 shows, in red, the time-domain characteristic of the planned impedance element for a 700 km transmission line. This characteristic extends over 20%-80% of the line length and is represented by a quadrilateral zone. The inclined black boundary indicates the suggested stability limit and offers an early signal of whether the system, immediately after a fault, is moving toward a stable or unstable power swing. During the fault, the observed impedance trajectory (violet) is taken as the reference signal in the proposed approach, allowing both fault identification and assessment of whether the path tends toward a stable or unstable region. Although not central to this work, the purple star designates the first intersection (T1) with the stability margin. It also marks the entrance instant (T2) into the distance-relay zone, while the green marker corresponds to the exit instant (T3). The time span between T2 and T3 reflects the relay’s fault sensitivity. The green star then highlights the second crossing with the suggested stability–swing boundary, denoted T4, and the interval ΔT = T4 − T2 is applied to evaluate the power-swing status of the system, indicating if it is moving toward stability or instability.
Figure 2. Impedance trajectory and distance relay characteristic with stability limitation
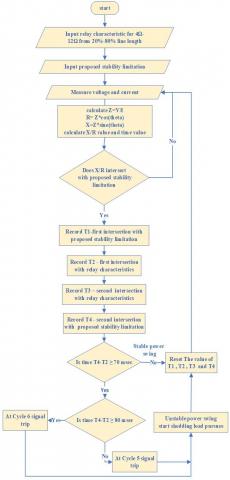
The present study proposes a line or curve for the stability constraints that indicate the occurrence of a malfunction. The approach proposed here begins by first locking the relay characteristic and the stability limits. When a severe disturbance or fault occurs, the X/R ratio surpasses the stability threshold, and the first intersection with the stability boundary labelled as T1 is recorded. Afterwards, the X/R trajectory keeps shifting until it enters the relay zone, where the initial crossing (T2) is logged as the fault-detection instant. The X/R value continues to change until it goes beyond the relay-zone limits, at which moment the second crossing of the relay characteristic is registered as T3. Relay fault-detection sensitivity is assessed using the interval T3–T2. A larger T3–T2 implies higher relay sensitivity. Until it crosses the stability limits once again, the value of X/R keeps changing automatically; at that time, the second intersection denoted T4 is recorded. Then compute ΔT = T4 − T2. If ΔT lies in 70–80 ms and T4 is in 80–90 ms, it indicates that the critical swing occurs in the fifth cycle, which is the proposed stability threshold at which the isolation signal will be sent. If instead ΔT is 80–90 ms and T4 exceeds 100 ms, it indicates that the critical swing occurs in the sixth cycle. The proposed stability threshold will shift to the sixth cycle instead of the fifth. Subsequently, the regulated load isolation procedures will begin to avoid losing synchronisation. The system will then be monitored to see if the isolation procedures have led to system stability. If the answer is yes, the load will be returned to the system after it stabilizes. In case of failure, a command will be given to disconnect the lines to avoid damage caused by losing synchronisation. If ΔT < 70 ms, the timestamps are cleared and the evaluation is repeated until the criterion is satisfied. Figure 3 illustrates these operations in the form of a flowchart.
Figure 3. Overall flow chart for the proposed procedure
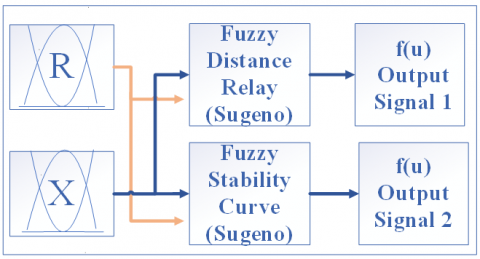
Fuzzy logic has been used extensively in FACTS devices to solve challenging real-world industrial challenges [46]. It may be used to create rules of control. The formalization of uncertainty arising from a global, complete knowledge of a complex nonlinear system is made possible by fuzzy logic. Three basic processes comprise this technique: defuzzification, expansion of the inference rules, and fuzzification [35]. The two types of fuzzy inference systems (FIS) are Mamdani and Takagi-Sugeno (TSK); the former is used in engineering systems the most and is best suited for hardware implementation [47]. A Sugeno (TSK) fuzzy inference system was adopted to meet real-time protection requirements. Unlike Mamdani—whose fuzzy consequents and centroid defuzzification incur higher computational costs—numeric (constant/linear) consequents are produced by TSK and aggregated by a weighted average, which reduces inference time and facilitates data-driven tuning (e.g., ANFIS). Although stronger linguistic interpretability is offered by Mamdani, it was found that a better trade-off among accuracy, latency, and tunability is provided by TSK under the constraints of the proposed application. In practice, TSK is preferred when low execution time and automatically tunable numeric outputs are priorities, whereas Mamdani is more suitable when interpretability takes precedence over timing constraints [48]. This study uses the Sugeno type with the primary goal of improving fault detection and power swings by replacing the traditional distance stage with the fuzzy distance stage, as the Sugeno method provides higher accuracy in the mathematical calculations required for fault scenarios and the analysis of complex power swings, as seen in Figure 4. Furthermore, a fuzzy unit is used instead of the stability detection curve in order to use fuzzy logic to determine the kind of swing. It is also decided whether to shed specific loads or to disconnect if shedding fails. Figures 5 and 6 show the schematic diagram of the proposed fuzzy distance relay and stability-limited curve.
Figure 4. Fuzzy logic architecture for distance relay and stability limitation curve
Figure 5. Logic diagram of the proposed distance relay
Figure 6. Logic diagram for the proposed stability limitation curve
Fuzzification is the input step that makes it possible to convert variables from the actual domain into the fuzzy domain [49]. The membership function in the controller transforms the input variable into linguistic variables [50]. In the present research, the stability detection curve and the distance stage based on a fuzzy inference system (FIS) depend on one output and two inputs. The fuzzy distance stage's output signal was T2, the fuzzy stability detection curve's output signal was T4, and the readings of R and X values were used as inputs to the FIS. These variables (inputs/outputs) are fuzzified by dividing the discourse universe into intervals for each linguistic variable. Each variable's fuzzy sets and membership functions may be found using the discretization method [51].
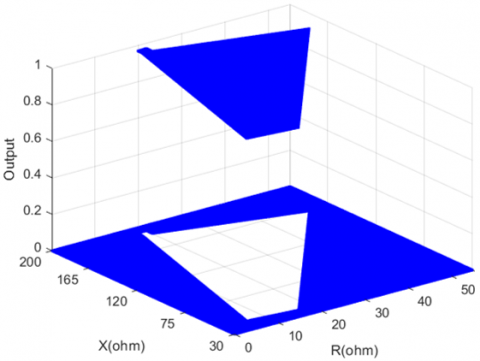
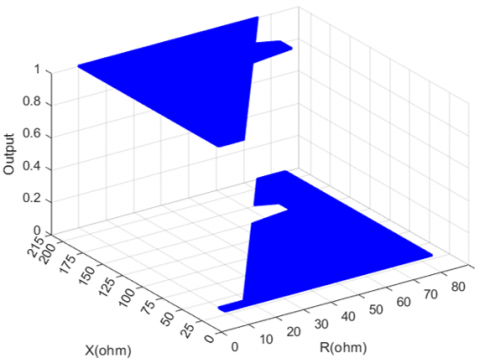
Through simulation and practical experience, fuzzy rules were designed to improve the system's performance. The Sugeno fuzzy inference method was chosen for the stability detection curve, using 625 rules and 25 membership functions, and for the distance phase with 1225 rules and 35 membership functions. Based on the number of membership functions utilized in the modeling, the number of rules was established. To achieve the lowest error rate during the training process, the number of membership functions was manually entered and tested using the "Neuro Fuzzy Designer" tool. The number of rules was determined by multiplying the number of membership functions, where 25 × 25 membership functions result in 625 rules, and for 35 membership functions, 35 × 35 results in 1225 rules. In a fuzzy inference system (FIS), the process of transforming fuzzy output into precise output is referred to as defuzzification. Within the framework of the defuzzification technique, the output of fuzzy rules is converted into a numerical output that is not fuzzy. This particular stage is incredibly significant as it is responsible for generating the final, accurate output of the fuzzy logic controller, which is achieved through the adept utilization of fuzzy inputs that have been carefully processed. Figures 7 and 8 serve to illustrate the three-dimensional output surface of the fuzzy inference system, which is specifically employed for the purposes of analyzing the stability detection curve and assessing the distance stage, thereby providing valuable insights into the system's operational dynamics and performance characteristics.
Figure 7. 3D input-output dataset mapping for the proposed fuzzy distance relay
Figure 8. 3D input-output dataset mapping for the proposed fuzzy stability limitation curve
Figure 1 presents the results of the suggested protection strategy on a three-bus, two-generator test network. Faults were simulated at several points on the transmission line connecting Bus-1 and Bus-2. The relay was configured to operate with fault resistances (RF) ranging between 4 and 12 Ω. The worst-case condition of a three-phase short-circuit was modeled using MATLAB/Simulink. In the first scenario, four fault locations were considered, with line lengths varying between 20% and 80% and fault durations lasting from three to seven cycles. Under the same operating conditions, the second and third scenarios used RF equal to 8 and 12 Ω, respectively. Table 1 reports the outcomes for PS states, load shedding, and trip signals corresponding to different values of resistance, line length, and fault duration. The dynamic response of the system is illustrated in graphs, updated every 0.5 s. Furthermore, the study examined in detail how different scenarios and fault resistance (RF) affect overall system responses. The location of the fault and its resistance significantly influence the acquired fault entry time, as demonstrated by measuring the moment of entry of the path within the relay characteristics. The goal was to provide a comprehensive understanding of the system's behavior under various fault conditions. Table 1 summarizes the system's response times during fault occurrences, showing quick responses across all cases, with fault detection time (T2) recorded based on the entry moments in the relay characteristics. Additionally, it was observed that the stability detection factor (T4) time varied with each cycle, increasing as the fault duration increased. This allowed for the prediction of the type of mechanical power swing, whether it was unstable, critical, or stable, providing important information about how the system performed under various circumstances. Following is a summary of the proposed fault management options: For RF = 4 at 20%, 40%, and 60% fault sites, and for RF = 8 at a 60% fault sites, shedding procedures are implemented during the fifth cycle's critical electrical power swing. During the crucial electrical power swing in the sixth cycle, shedding actions are applied to the remaining values and other fault sites of the defined resistance. Suppose the fault exceeds the above cycle numbers. In that case, the system is programmed to perform shedding actions during the fifth or sixth cycle without waiting for the signal from the stability detection sensor, depending on the approaching condition. The 12.5% load-shedding threshold was determined through extensive time-domain simulations that systematically varied both fault location and fault resistance. Results showed that 12.5% is the smallest shedding block that restores system stability across all tested scenarios. Lower values (e.g., 10%) satisfied the requirement in certain cases but failed when the fault location or resistance changed, whereas higher shedding levels reduce system reliability by lowering the system’s ability to supply the maximum possible load regardless of operating conditions. Accordingly, 12.5% was adopted as the minimum, general, and reliable threshold and remains shed until the difference between theta1 - theta2 is less than or equal to 40 degrees before being returned to the system, proving successful in avoiding loss of synchronisation and restoring stability. Shedding operations will occur in a different shedding situation, but the system will not stabilize if the shed load is reduced to 5%. Therefore, if the system remains in this condition, circuit breakers 2&3 will activate protection, shutting off the sources to avoid catastrophic damage.
Table 1. Investigation of suggested timing and trip signals
|
RF and Location |
Fault Duration in Cycle |
T4-T2 Msec |
T2 Msec |
T4 Msec |
Power Swing |
Trip Shed |
Trip Cycle |
|
4 Ω, 20% |
3 |
41.9 |
11.7 |
53.6 |
stable |
0 |
- |
|
4 |
58.4 |
70.1 |
stable |
0 |
- |
||
|
5 |
75 |
86.7 |
critical |
1 |
5 |
||
|
6 |
91.6 |
103.3 |
unstable |
1 |
5 |
||
|
4 Ω, 40% |
3 |
42.2 |
12.2 |
54.4 |
stable |
0 |
- |
|
4 |
59 |
71.2 |
stable |
0 |
- |
||
|
5 |
75.6 |
87.8 |
critical |
1 |
5 |
||
|
6 |
92.2 |
104.4 |
unstable |
1 |
5 |
||
|
4 Ω, 60% |
3 |
42 |
13.1 |
55.1 |
stable |
0 |
- |
|
4 |
58.7 |
71.8 |
stable |
0 |
- |
||
|
5 |
75.4 |
88.5 |
critical |
1 |
5 |
||
|
6 |
92 |
105.1 |
unstable |
1 |
5 |
||
|
4 Ω, 80% |
3 |
20.3 |
17.1 |
55.4 |
stable |
0 |
- |
|
4 |
37 |
72.1 |
stable |
0 |
- |
||
|
5 |
53.6 |
88.7 |
stable |
0 |
- |
||
|
6 |
70.3 |
105.4 |
critical |
1 |
6 |
||
|
7 |
86.9 |
122 |
unstable |
1 |
6 |
||
|
8 Ω, 20% |
3 |
40 |
13 |
53 |
stable |
0 |
- |
|
4 |
56.5 |
69.5 |
stable |
0 |
- |
||
|
5 |
73.1 |
86.1 |
stable |
0 |
- |
||
|
6 |
89.7 |
102.7 |
critical |
1 |
6 |
||
|
7 |
106.3 |
119.3 |
unstable |
1 |
6 |
||
|
8 Ω, 40% |
3 |
40.1 |
13.9 |
54 |
stable |
0 |
- |
|
4 |
56.9 |
70.8 |
stable |
0 |
- |
||
|
5 |
73.4 |
87.3 |
stable |
0 |
- |
||
|
6 |
90.1 |
104 |
critical |
1 |
6 |
||
|
7 |
106.8 |
120.7 |
unstable |
1 |
6 |
||
|
8 Ω, 60% |
3 |
41.1 |
13.7 |
54.8 |
stable |
0 |
- |
|
4 |
57.7 |
71.4 |
stable |
0 |
- |
||
|
5 |
74.4 |
88.1 |
critical |
1 |
5 |
||
|
6 |
91.1 |
104.8 |
unstable |
1 |
5 |
||
|
8 Ω, 80% |
3 |
38.1 |
16.8 |
54.9 |
stable |
0 |
- |
|
4 |
54.8 |
71.6 |
stable |
0 |
- |
||
|
5 |
71.5 |
88.3 |
stable |
0 |
- |
||
|
6 |
88.1 |
104.9 |
critical |
1 |
6 |
||
|
7 |
104.8 |
121.6 |
unstable |
1 |
6 |
||
|
12 Ω, 20% |
3 |
37.3 |
14.8 |
52.1 |
stable |
0 |
- |
|
4 |
53.9 |
68.7 |
stable |
0 |
- |
||
|
5 |
70.6 |
85.4 |
stable |
0 |
- |
||
|
6 |
87.2 |
102 |
critical |
1 |
6 |
||
|
7 |
103.8 |
118.6 |
unstable |
1 |
6 |
||
|
12 Ω, 40% |
3 |
38.7 |
14.9 |
53.6 |
stable |
0 |
- |
|
4 |
55.3 |
70.2 |
stable |
0 |
- |
||
|
5 |
71.9 |
86.8 |
stable |
0 |
- |
||
|
6 |
88.6 |
103.5 |
critical |
1 |
6 |
||
|
7 |
105.3 |
120.2 |
unstable |
1 |
6 |
||
|
12 Ω, 60% |
3 |
38.9 |
15.4 |
54.3 |
stable |
0 |
- |
|
4 |
55.5 |
70.9 |
stable |
0 |
- |
||
|
5 |
72.2 |
87.6 |
stable |
0 |
- |
||
|
6 |
89 |
104.4 |
critical |
1 |
6 |
||
|
7 |
105.7 |
121.1 |
unstable |
1 |
6 |
||
|
12 Ω, 80% |
3 |
38.7 |
17 |
54.6 |
stable |
0 |
- |
|
4 |
55.5 |
71.3 |
stable |
0 |
- |
||
|
5 |
72.2 |
88 |
stable |
0 |
- |
||
|
6 |
88.9 |
104.8 |
critical |
1 |
6 |
||
|
7 |
105.7 |
121.5 |
unstable |
1 |
6 |
The effectiveness of the shedding strategy and the robustness of the basic protection mechanism in protecting the system against potential failures are validated by establishing a correlation between the fault detection time (T2) and the stability rate factor (T4), allowing for the prediction of whether the swing will be stable, critical, or unstable. This ensures a thorough understanding of the system's fault-handling capabilities while highlighting the significance of both shedding strategies and backup protection mechanisms.
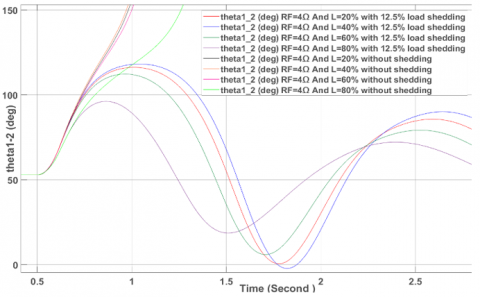
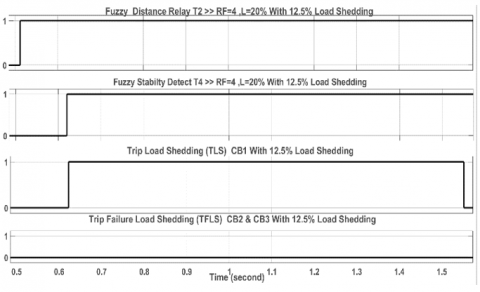
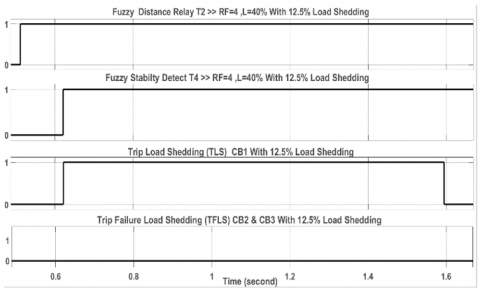
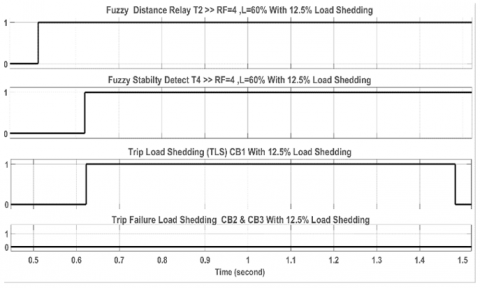
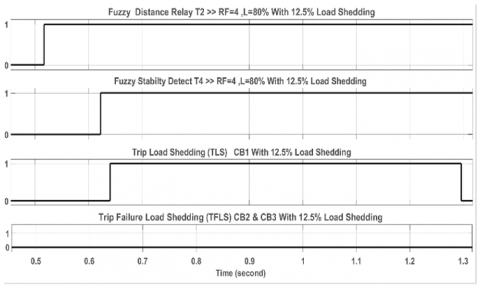
Figure 9 shows the difference between the power angle of the two machines (theta1 - theta2) in the fault resistance scenario of 4 ohms and fault locations ranging from 20% to 80% of the line length, with the fault lasting for seven cycles. The results are presented in two cases: the first using the proposed protection method for shedding loads by 12.5% of the total load, and the second in the absence of shedding. The effectiveness of the proposed shedding method, using fuzzy logic, in reducing the resulting power swing was proven, while the system loses synchronisation in the absence of shedding. It was also observed that as the fault location moves farther from generator 1, the power swing decreases due to the increased line resistance, except for the case at the 40% fault location, where the effect of the distant generator is clearly noticeable. Figures 10 to 13 show the signals associated with the scenario involving fault resistance of 4 ohms and fault locations from 20% to 80%. These include signals for T2, T4, trip load shedding (TLS), and trip failure load shedding (TFLS). These signals confirm the strategy's success in avoiding power swings by noting the absence of the failure trip signal.
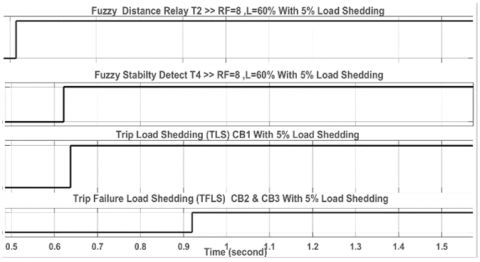
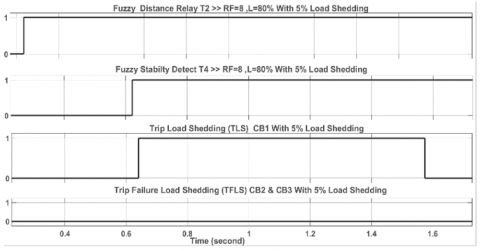
The effectiveness of the proposed protection system was evaluated through an additional scenario, where Figure 14 shows the difference between the power angles of the two machines (Theta1 - Theta2) at a fault resistance of 8 ohms, with fault locations varying between 20% and 80% of the line length, and the fault lasting for 7 cycles. The results were presented in two cases: the first using the proposed protection method to shed loads by 5% of the total load, and the second in the absence of any load shedding. The shedding percentage was deliberately reduced in this scenario to test the system's ability to handle cases where the shedding strategy fails to mitigate power swings. The results showed that the primary protection successfully isolated the main lines within fault locations ranging from 20% to 60% of the line length, thereby avoiding catastrophic damage caused by loss of synchronisation when the shedding strategy failed to mitigate power swings. However, it was observed that the shedding strategy mitigated power swings at a fault location of 80% of the line length. This success is attributed to the additional line impedance resulting from the increased distance of the fault location, reducing power swings' impact. Moreover, the time required for opening the circuit breakers was considered, with a delay of 30 milliseconds added to ensure compatibility with the practical requirements of protection systems.
Figure 9. Power angle (θ1 - θ2) for RF = 4 Ω at LF locations (20%-80%) with 12.5% load shedding during the 7th cycle
Figure 10. Trip signals (T2, T4, TLS and TFLS) for 7 cycles, RF = 4 Ω and L = 20%
Figure 11. Trip signals (T2, T4, TLS and TFLS) for 7 cycles, RF = 4 Ω and L = 40%
Figure 12. Trip signals (T2, T4, TLS and TFLS) for 7 cycles, RF = 4 Ω and L = 60%
Figure 13. Trip signals (T2, T4, TLS and TFLS) for 7 cycles, RF = 4 Ω and L = 80%
Figure 14. Power angle (θ1 - θ2) for RF = 4 Ω at LF locations (20%-80%) with 5% load shedding during the 7th cycle
Figure 15. Trip signals (T2, T4, TLS and TFLS) for 7 cycles, RF = 8 Ω and L = 20%
Figure 16. Trip signals (T2, T4, TLS and TFLS) for 7 cycles, RF = 8 Ω and L = 40%
Figure 17. Trip signals (T2, T4, TLS and TFLS) for 7 cycles, RF = 8 Ω and L = 60%
Figure 18. Trip signals (T2, T4, TLS and TFLS) for 7 cycles, RF = 8 Ω and L = 80%
Figures 15 to 18 present the signals associated with the scenario as mentioned above, confirming the success of the primary protection in isolating the main lines within fault locations ranging from 20% to 60% of the line length when the shedding percentage was intentionally reduced to 5%. On the other hand, at a fault location of 80% of the line length, the shedding method effectively controlled power swings since the increased resistance lessened the intensity of the swings, negating the need to activate the main protection.
This study introduced a combined protection system for a power network with three buses and two generators, looking at how three-phase faults affect the system's transient stability. Detailed analysis indicated that fault resistance and its location play a decisive role in the timing of stability loss, where the loss of synchronization differs between the sixth and seventh cycles based on fault resistance values and their location.
A sophisticated relay and an adaptive stability detection curve predicated on fuzzy logic were formulated, facilitating rapid and precise identification of faults alongside various manifestations of power swings. The investigation encountered obstacles in the categorization of power fluctuations owing to the analogous nature of resistance (R) and reactance (X) values during the fault interval, thereby complicating the differentiation between stable and unstable fluctuations; however, enhancements were made to the stability detection thresholds in targeted regions to augment detection precision.
The proposed protection system depends on precise timing measurements (T2 and T4) and monitoring of phase angles (θ1 and θ2) to improve the timing of breaker-tripping and load-shedding procedures, which support system stability under different fault conditions. Simulation results confirmed the proposed strategy's effectiveness in detecting faults early and determining whether power swings lead to stability or loss of synchronization after fault clearance. If the difference time value (T4-T2) indicates that the load-shedding procedures are insufficient, a signal to disconnect the line should be issued to prevent damage caused by losing synchronization.
The study showed that the proposed system can adapt to different fault resistances and their locations. The system implements advanced protection procedures that help improve the electrical network's reliability and stability. The study opened the door to developing more advanced protection systems in the future. These new systems can rely on artificial intelligence and fuzzy logic to ensure effective responses in future power networks. It is important to note that these results indicate the possibility of significantly improving the performance of electrical networks.
As future work, the performance of the proposed scheme can be applied to a large power system for enhancing overall transient stability, and also can be implemented on a scaled-down real-world prototype, with an analysis of clock cycles and hardware feasibility. Furthermore, systematic comparisons can be conducted with conventional protection methods, such as impedance relays and neural network–based approaches, to enhance the reliability of the results and assess the practical applicability of the proposed method.
The authors express their heartfelt gratitude to the College of Engineering, Department of Electrical Engineering, at the University of Mosul for their substantial assistance during this work.
[1] Taheri, B., Hosseini, S.A., Askarian-Abyaneh, H., Razavi, F. (2019). A new method for remote testing distance relay using internet protocol version 4. In 2019 International Conference on Protection and Automation of Power System (IPAPS), Iran, pp. 31-37. https://doi.org/10.1109/IPAPS.2019.8641918
[2] Patel, U.J., Chothani, N.G., Bhatt, P.J. (2016). Distance relaying with power swing detection based on voltage and reactive power sensitivity. International Journal of Emerging Electric Power Systems, 17(1): 27-38. https://doi.org/10.1515/ijeeps-2015-0109
[3] Koteswara Rao, A.V., Ahmad, A. (2017). Power swing blocking (PSB) function for distance relay using prediction technique. International Journal of System Assurance Engineering and Management, 8: 301-307. https://doi.org/10.1007/s13198-016-0434-2
[4] Corsi, S., Sabelli, C. (2004). General blackout in Italy Sunday September 28, 2003, h. 03:28:00. In IEEE Power Engineering Society General Meeting, pp. 1691-1702. https://doi.org/10.1109/PES.2004.1373162
[5] Khorashadi-Zadeh, H. (2005). Evaluation and performance comparison of power swing detection algorithms. In IEEE Power Engineering Society General Meeting, San Francisco, CA, USA, pp. 976-982. https://doi.org/10.1109/PES.2005.1489280
[6] Lin, X.N., Li, Z.T., Ke, S.H., Gao, Y. (2010). Theoretical fundamentals and implementation of novel self-adaptive distance protection resistant to power swings. IEEE Transactions on Power Delivery, 25(3): 1372-1383. https://doi.org/10.1109/TPWRD.2010.2043450
[7] Khorashadi Zadeh, H., Li, Z. (2008). Artificial neural network based load blinder for distance protection. In 2008 IEEE Power and Energy Society General Meeting - Conversion and Delivery of Electrical Energy in the 21st Century, Pittsburgh, PA, USA, pp. 1-6. https://doi.org/10.1109/PES.2008.4596056
[8] Alsammak, A.N., Janderma, S.A. (2019). Enhancement effects of the STATCOM on the distance relay protection. International Journal of Computer Applications, 182(40): 10-14. https://doi.org/10.5120/ijca2019918461
[9] Alnaib, I.I., Alsammak, A.N. (2025). Optimization of fractional PI controller parameters for enhanced induction motor speed control via indirect field-oriented control. Electrical Engineering & Electromechanics, (1): 3-7. https://doi.org/10.20998/2074-272X.2025.1.01
[10] Martuscello, L., Krizauskas, E., Holbach, J., Lu, Y.C. (2009). Tests of distance relay performance on stable and unstable power swings reported using simulated data of the August 14th 2003 system disturbance. In 2009 Power Systems Conference, Clemson, SC, USA, pp. 1-21. https://doi.org/10.1109/PSAMP.2009.5262383
[11] Mohammed, H.A., Alsammak, A.N.B. (2023). An intelligent hybrid control system using ANFIS-optimization for scalar control of an induction motor. Journal Européen des Systèmes Automatisés, 56(5): 857-862. https://doi.org/10.18280/jesa.560516
[12] Sajan, C., Satish Kumar, P., Virtic, P. (2024). Enhancing grid stability and low voltage ride through capability using type 2 fuzzy controlled dynamic voltage restorer. Electrical Engineering & Electromechanics, (4): 31-41. https://doi.org/10.20998/2074-272X.2024.4.04
[13] Al-Kaoaz, H.N.A., Alsammak, A.N.B. (2023). Performance enhancement of distance relay in presence of unified power flow controller. International Journal of Power Electronics and Drive Systems, 14(3): 1577-1588. https://doi.org/10.11591/ijpeds.v14.i3.pp1577-1588
[14] Mahamedi, B. (2010). A very fast unblocking scheme for distance protection to detect symmetrical faults during power swings. In 2010 Conference Proceedings IPEC, Singapore, pp. 378-383. https://doi.org/10.1109/IPECON.2010.5697162
[15] Nayak, P.K., Rao, J.G., Kundu, P., Pradhan, A.K., Bajpai, P. (2010). A comparative assessment of power swing detection techniques. In 2010 Joint International Conference on Power Electronics, Drives and Energy Systems & 2010 Power India, New Delhi, India, pp. 1-4. https://doi.org/10.1109/PEDES.2010.5712568
[16] Mooney, P.E., Fischer, N. (2006). Application guidelines for power swing detection on transmission systems. In 2006 Power Systems Conference: Advanced Metering, Protection, Control, Communication, and Distributed Resources, Clemson, SC, USA, pp. 159-168. https://doi.org/10.1109/PSAMP.2006.285385
[17] Karegar, H.K., Mohamedi, B. (2009). A new method for fault detection during power swing in distance protection. In 2009 6th International Conference on Electrical Engineering/Electronics, Computer, Telecommunications and Information Technology, Chonburi, Thailand, pp. 230-233. https://doi.org/10.1109/ECTICON.2009.5136999
[18] Brahma, S.M. (2006). Use of wavelets for out of step blocking function of distance relays. In 2006 IEEE Power Engineering Society General Meeting, Montreal, QC, Canada p. 5. https://doi.org/10.1109/PES.2006.1709171
[19] Brahma, S.M. (2007). Distance relay with out-of-step blocking function using wavelet transform. IEEE Transactions on Power Delivery, 22(3): 1360-1366. https://doi.org/10.1109/TPWRD.2006.886773
[20] Pang, C., Kezunovic, M. (2010). Fast distance relay scheme for detecting symmetrical fault during power swing. IEEE Transactions on Power Delivery, 25(4): 2205-2212. https://doi.org/10.1109/TPWRD.2010.2050341
[21] Mahamedi, B. (2011). A new power swing blocking function based on wavelet transform. In 2011 2nd International Conference on Electric Power and Energy Conversion Systems (EPECS), Sharjah, United Arab Emirates, pp. 1-6. https://doi.org/10.1109/EPECS.2011.6126843
[22] Dubey, R., Samantaray, S.R., Tripathy, A., Babu, B.C., Ehtesham, M. (2012). Wavelet based energy function for symmetrical fault detection during power swing. In 2012 Students Conference on Engineering and Systems, Allahabad, India, pp. 1-6. https://doi.org/10.1109/SCES.2012.6199019
[23] Thakallapelli, A., Mehra, R., Mangalvedekar, H.A. (2013). Differentiation of faults from power swings and detection of high impedance faults by distance relays. In 2013 IEEE 1st International Conference on Condition Assessment Techniques in Electrical Systems (CATCON), Kolkata, India, pp. 374-377. https://doi.org/10.1109/CATCON.2013.6737530
[24] Trujillo G, L.A., Conde E, A., Leonowicz, Z. (2013). Application of the Prony method for compensation of errors in distance relays. In 2013 12th International Conference on Environment and Electrical Engineering, Wroclaw, Poland, pp. 568-572. https://doi.org/10.1109/EEEIC.2013.6549580
[25] Lotfifard, S., Faiz, J., Kezunovic, M. (2010). Detection of symmetrical faults by distance relays during power swings. IEEE Transactions on Power Delivery, 25(1): 81-87. https://doi.org/10.1109/TPWRD.2009.2035224
[26] Al-Kaoaz, H.N.A., Alsammak, A.N.B. (2024). The impact of hybrid power generations on a power system’s voltage stability. Journal Européen des Systèmes Automatisés, 57(2): 541-549. https://doi.org/10.18280/jesa.570223
[27] Al-Kaoaz, H.N.A., Alsammak, A.N.B. (2023). Utilizing hybrid renewable energy systems for enhancing transient stability in power grids: A comprehensive review. Journal Européen des Systèmes Automatisés, 56(4): 687-696. https://doi.org/10.18280/jesa.560418
[28] Hamid, S.F., Alsammak, A.N.B. (2023). The influence of using multi-mass steam turbines on the frequency stability in IEEE 9-bus system. American Institute of Physics Conference Series, 2834(1): 060007. https://doi.org/10.1063/5.0165912
[29] Cho, K.R., Kang, Y.C., Kim, S.S., Park, J.K., Kang, S.H., Kim, K.H. (1999). An ANN based approach to improve the speed of a differential equation based distance relaying algorithm. IEEE Transactions on Power Delivery, 14(2): 349-357. https://doi.org/10.1109/61.754073
[30] Biswas, D., Adhikari, P.M., De, A. (2014). An artificial neural network based power swing classification technique. In 2014 Annual IEEE India Conference (INDICON), Pune, India, pp. 1-5. https://doi.org/10.1109/INDICON.2014.7030468
[31] Abidin, A.F., Mohamed, A., Shareef, H. (2011). Intelligent detection of unstable power swing for correct distance relay operation using S-transform and neural networks. Expert Systems with Applications, 38(12): 14969-14975. https://doi.org/10.1016/j.eswa.2011.05.050
[32] Zadeh, H.K., Li, Z.Y. (2008). A novel power swing blocking scheme using adaptive neuro-fuzzy inference system. Electric Power Systems Research, 78(7): 1138-1146. https://doi.org/10.1016/j.epsr.2007.09.007
[33] Esmaeilian, A., Astinfeshan, S. (2011). A novel power swing detection algorithm using adaptive neuro fuzzy technique. In Proceedings of the 2011 International Conference on Electrical Engineering and Informatics, Bandung, Indonesia, pp. 1-6. https://doi.org/10.1109/ICEEI.2011.6021820
[34] Shweta, R., Sivagnanam, S., Kumar, K.A. (2022). Fault detection and monitoring of solar photovoltaic panels using internet of things technology with fuzzy logic controller. Electrical Engineering & Electromechanics, 6: 67-74. https://doi.org/10.20998/2074-272X.2022.6.10
[35] Alsammak, A.N.B., Al-Kaoaz, H.N.A. (2023). Design of a fuzzy distance relay taking into consideration the impact of using a unified power flow controller. Eastern-European Journal of Enterprise Technologies, 2(5): 6-19. https://doi.org/10.15587/1729-4061.2023.277343
[36] Salleh, Z.M.T., Alsammak, A.N.B., Mohammed, H.A. (2024). Enhancing power system transient stability using static var compensator based on a fuzzy logic controller. Journal Européen des Systèmes Automatisés, 57(6): 1565-1572. https://doi.org/10.18280/jesa.570603
[37] Hashemi, S.M., Sanaye-Pasand, M., Shahidehpour, M. (2019). Fault detection during power swings using the properties of fundamental frequency phasors. IEEE Transactions on Smart Grid, 10(2): 1385-1394. https://doi.org/10.1109/TSG.2017.2765200
[38] Rao, J.G., Pradhan, A.K. (2015). Power-swing detection using moving window averaging of current signals. IEEE Transactions on Power Delivery, 30(1): 368-376. https://doi.org/10.1109/TPWRD.2014.2342536
[39] Behrooz, T., Farzad, R. (2018). Power swing detection using rms current measurements. Journal of Electrical Engineering & Technology, 13(5): 1831-1840. https://doi.org/10.5370/JEET.2018.13.5.1831
[40] Taheri, B., Salehimehr, S., Razavi, F., Parpaei, M. (2020). Detection of power swing and fault occurring simultaneously with power swing using instantaneous frequency. Energy Systems, 11: 491-514. https://doi.org/10.1007/s12667-018-00320-0
[41] Taheri, B., Razavi, F., Salehimehr, S. (2019). Power swing detection using the variation rates of the average value of apparent power. In 2019 International Conference on Protection and Automation of Power System (IPAPS), Iran, pp. 38-43. https://doi.org/10.1109/IPAPS.2019.8642060
[42] Kumar, J., Jena, P. (2017). Detection of fault during power swing using superimposed negative sequence apparent power based scheme. In 2017 6th International Conference on Computer Applications In Electrical Engineering-Recent Advances (CERA), Roorkee, India, pp. 57-62. https://doi.org/10.1109/CERA.2017.8343301
[43] Mishra, M., Singh, J.G. (2025). A comprehensive review on deep learning techniques in power system protection: Trends, challenges, applications and future directions. Results in Engineering, 25: 103884. https://doi.org/10.1016/j.rineng.2024.103884
[44] Li, Z., Xie, Y.B., Ma, R.K., Wei, Z.H. (2024). Optimizing CNN-LSTM for the localization of false data injection attacks in power systems. Applied Sciences, 14(16): 6865. https://doi.org/10.3390/app14166865
[45] Al-Fakhar, M.R.Y., Alsammak, A.N.B. (2025). A new strategy for detecting unstable power swing using fault impedance trajectory and its impacts on performance of the impedance distance relay. Journal Européen des Systèmes Automatisés, 58(4): 727-735. https://doi.org/10.18280/jesa.580406
[46] Hemeida, M.G., Hussien, H.R., Wahab, M.A.A. (2015). Stabilization of a wind farm using static VAR compensators (SVC) based fuzzy logic controller. Advances in Energy and Power, 3(2): 61-74. https://doi.org/10.13189/aep.2015.030204
[47] Tarbosh, Q.A., Aydoğdu, Ö., Farah, N., Talib, M.H.N., Salh, A., Çankaya, N. (2020). Review and investigation of simplified rules fuzzy logic speed controller of high performance induction motor drives. IEEE Access, 8: 49377-49394. https://doi.org/10.1109/ACCESS.2020.2977115
[48] Jang, J.S.R. (1993). ANFIS: Adaptive-network-based fuzzy inference system. IEEE Transactions on Systems, Man, and Cybernetics, 23(3): 665-685. https://doi.org/10.1109/21.256541
[49] Lilly, J.H. (2010). Fuzzy Control and Identification. Wiley. https://doi.org/10.1002/9780470874240
[50] Rezaie, H., Kazemi-Rahbar, M.H. (2019). Enhancing voltage stability and LVRT capability of a wind-integrated power system using a fuzzy-based SVC. Engineering Science and Technology, an International Journal, 22(3): 827-839. https://doi.org/10.1016/j.jestch.2018.12.018
[51] Saleem, B., Badar, R., Judge, M.A., Manzoor, A., ul Islam, S., Rodrigues, J.J.P.C. (2021). Adaptive recurrent NeuroFuzzy control for power system stability in smart cities. Sustainable Energy Technologies and Assessments, 45: 101089. https://doi.org/10.1016/j.seta.2021.101089