Alaa Fadhil І Idan![]() | Duaa Abbas Falih
| Duaa Abbas Falih![]() | Mohammed Sabeeh Mohammed*
| Mohammed Sabeeh Mohammed*![]() | Ahmed Hashim Kareem
| Ahmed Hashim Kareem![]() | Hasan Shakir Majdi
| Hasan Shakir Majdi![]()
© 2025 The authors. This article is published by IIETA and is licensed under the CC BY 4.0 license (http://creativecommons.org/licenses/by/4.0/).
OPEN ACCESS
Investigators examined microstructural changes together with strength and corrosion resistance properties in alloy steel joints created by Gas Metal Arc Welding (GMAW) and Shielded Metal Arc Welding (SMAW). The research analyzed the effects of welding heat input on microstructure development and its effect on the corrosion performance. The research examined ASTM A516 Grade 70 steel welds' corrosion behavior welded using GMAW and SMAW after immersing them in ferric chloride solution for 81 hours. The GMAW welding process generated a narrower Heat Affected Zone (HAZ), resulting in an average corrosion rate of 8.31 mm/year at 81 hours; SMAW produced a slightly elevated final corrosion rate of 8.73 mm/year. GMAW fusion zone displayed fine dendritic features, different from the SMAW fusion zone, which contained coarser grain patterns. SMAW heat-affected zone exceeded GMAW's zone by 5 mm, reaching up to 19 mm, which led SMAW joints to increased corrosion vulnerability. GMAW joints' mechanical properties yielded 588 MPa tensile strength measurement, which corresponded to 5.1% reduction from the base metal, slightly higher than SMAW joints at 578 MPa and 5.2% reduction from base metal strength values. Toughness measured using Charpy tests on GMAW samples showed higher results at 72 J compared to 65 J obtained from SMAW. The weight loss analysis showed GMAW initial corrosion speed 60.12 mg decline at 5 hours before achieving 3.53 g stability at 81 hours. SMAW corrosion development was slower since the material lost 30.19 mg after the initial 5 hours before reaching 3.99 g after 81 hours. Results show GMAW produces better general corrosion resistance and mechanical properties than SMAW joints.
corrosion resistance, alloy steel joints, microstructure analysis, corrosion rate, weight loss analysis
Alloy steels need excellent corrosion resistance to function well in demanding conditions that mainly affect sectors including oil and gas production and marine engineering, together with chemical processing. The microstructure, together with the mechanical properties of alloy steels, changes significantly during welding, which affects how they resist corrosion. This analysis evaluates how welding input heat affects corrosion resistance in alloy steels through studying how heat alteration changes microstructure, thus modifying corrosion behavior [1]. A review examines the welding heat input mechanisms that change microstructure and their influence on corrosion resistance through recent study findings to identify optimal A516 grade Gwelding practices. Welding heat input influences the grain structure, precipitate formation, and phase transformations in alloy steels, affecting corrosion resistance. Lu et al. [2] investigated the effects of different heat inputs on carbon steel welds and found that excessive heat led to grain coarsening, reducing corrosion resistance due to lower boundary density. Similarly, Mohammed et al. [3] studied austenitic and duplex stainless steels, concluding that high heat input promoted ferrite formation, which significantly reduced pitting resistance. Yousefien et al. [4] investigated pulsed current GTAW welding and found that low heat input improved corrosion resistance in duplex stainless steel due to the formation of a finer grain structure. Nowacki et al. [5] examined submerged arc welding (SAW) of duplex steel and identified the optimal welding heat input range that preserves corrosion resistance before microstructural degradation occurs. The Heat Affected Zone (HAZ) plays a major role in corrosion resistance. Zhang et al. [6] analyzed the corrosion behavior of the HAZ in 304 stainless steel welded joints. They found that while the top areas of the HAZ exhibited good corrosion resistance, the root areas were more susceptible to localized corrosion.
Wang [7] studied cooling rates and their impact on pitting corrosion resistance in super duplex stainless steel. The findings indicated that slower cooling rates associated with high heat input resulted in intermetallic phase precipitation, degrading corrosion resistance. Verma and Taiwade [8] reviewed the effects of welding parameters on duplex stainless steel weldments, emphasizing that excessive heat input led to sigma phase formation, a known cause of corrosion susceptibility. Different welding techniques introduce varying degrees of heat input, impacting corrosion behavior. Unnikrishnan et al. [9] investigated TIG welding and found that higher heat input resulted in increased residual stresses, negatively impacting corrosion performance. Yan et al. [10] examined X80 pipeline steel and found that laser welding minimized heat input, which improved corrosion resistance compared to conventional arc welding. Wang et al. [11] studied underwater wet welding and observed that higher heat input accelerated the formation of corrosive phases in E40 steel joints, leading to increased corrosion rates. Saha et al. [12] studied flux-cored arc welding (FCAW) and noted that excessive heat input led to a higher dilution rate, reducing the corrosion resistance of duplex stainless-steel cladding.
Drosos and Kotsakis [13] investigated the influence of welding parameters on weld quality using metal-cored wires and pulsed welding. Their research highlighted that plate position significantly affects weld geometry, suggesting that optimal parameter selection is crucial for achieving desired weld characteristics. Ebrahimi et al. [14] conducted numerical simulations to understand the effect of groove shape on molten metal flow behavior in GMAW. Their findings provided insights into optimizing weld pool dynamics to achieve defect-free joints. The formation of composite-like structures within the fusion zone during dissimilar fusion welding has been observed to improve mechanical properties [15]. This phenomenon results from the dispersion of harder material particles within a softer matrix, leading to an inhomogeneous hardness distribution but enhanced overall joint strength. Welding heat input influences corrosion resistance in ways that vary according to the particular alloy material system. High welding heat inputs cause carbide precipitate formation at grain boundaries in austenitic stainless steels, which depletes chromium from surrounding areas, thus creating regions prone to IGC [16]. The formation of martensite occurs rapidly in alloy steels when cooling rates are high, but reduces both their corrosion resistance and their toughness, together with increased hardness [17]. New research on duplex stainless steels explains how proper heat input controls phase distribution to reduce pitting and crevice corrosion risk [18]. Various experimental studies have delivered critical findings about how welding heat affects materials' resistance to corrosion. Research by Liu et al. [19] on 2205 duplex stainless steel demonstrated that the optimal corrosion resistance in chloride environments occurred when using heat input at 0.8-1.2 kJ/mm, which maintained a well-balanced ferrite-austenite composition. Muthupandi et al [20] showed through their study on super duplex stainless steels how excessive heat input degrades pitting resistance equivalent number (PREN), which signifies corrosion resistance.
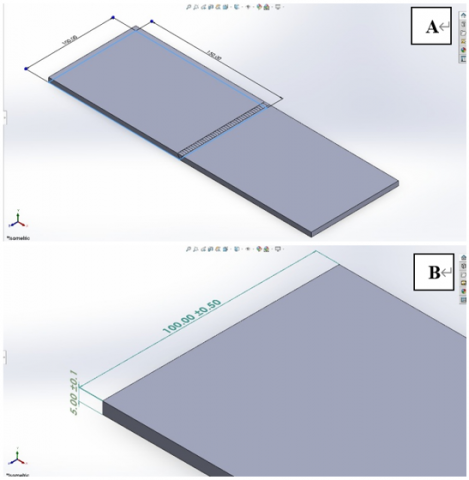
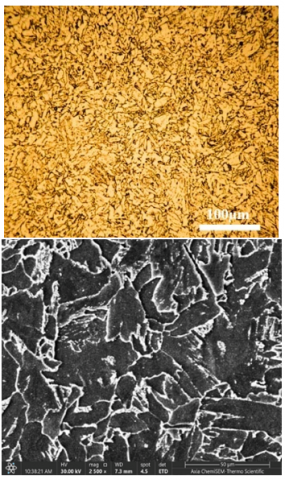
Joint configurations were prepared by abrasive cutting HSLA steel plates with 5 mm thickness to specified dimensions (100 mm × 150 mm), as seen in Figure 1(a) and (b). Figure 2 shows the parent metal microstructure, which consists of ferrite and pearlite minor amount. ESAB Electrodes, Ltd. offered GMAW process filler wire and SMAW electrode. The electrodes utilized in this experiment were E8018 for Shielded Metal Arc Welding (SMAW) and ER70S-6, MIG electrodes designed to weld alloy steels using metal inert gas (MIG) welding technology. The chemical composition of the welding electrodes and the parent metal is shown in Tables 1 and 2.
Figure 1. Welding joint configuration and dimensions (a) Width and length and (b) Width and thickness
Table 1. A516 grade G chemical composition wt. %
|
0.09 |
C |
|
0.25 |
Si |
|
1.55 |
Mn |
|
0.033 |
Nb |
|
0.032 |
Ti |
|
0.014 |
Mo |
|
0.043 |
V |
|
0.003 |
S |
|
0.008 |
P |
|
Balance |
Fe |
Table 2. ESAB E8018 SMAW electrode and ER70S-6 MIG electrode rode chemical composition wt. %
|
E8018 |
ER70S-6 |
wt. % |
|
0.045 |
0.08 |
C |
|
1.08 |
0.94 |
Mn |
|
0.31 |
0.63 |
Si |
|
0.01 |
0.012 |
S |
|
0.01 |
0.013 |
P |
|
0.91 |
---- |
Ni |
|
0.06 |
---- |
Cr |
|
0.12 |
---- |
Mo |
|
0.139 |
0.07 |
Cu |
|
0.003 |
---- |
Nb |
All the welding parameters and conditions that went into making the joints are shown in Table 3. Tensile test specimens were produced in accordance with ASTM E8M-04 standards. Electromechanical controlled universal testing equipment (UNITEK-94100) made by FIE Bluestar in India, with 100 kN tensile strength employed for this purpose.
The authors averaged the results from two specimens tested for each condition. Charpy impact specimens are used to assess weld metal impact toughness, and as a result, they are machined with a notch in the middle. Due to the plate's thinness, sub-size specimens were made. The impact tests were carried out at room temperature using a pendulum-type impact testing machine from Enkay, India. The absorbed energy quantity in the test was documented. The impact material toughness is defined as the absorbed energy. The hardness distribution across the welded joint and mid-thickness region was measured with Vickers' microhardness tester (Make: Shimadzu, Japan, Model: HMV-2T) under a 0.5 N force. Using emery papers of varying grades, the specimen was sectioned to the necessary size from the joint, which contained the weld metal, the HAZ, and the base metal areas, in preparation for metallographic analysis. Last but not least, a disc polishing machine was used to apply diamond compound with a 1 mm particle size. In order to expose the joints' microstructural characteristics, the specimens were etched using 2% Nital solution. An optical microscope (Make: MEJI, Japan; Model: MIL-7100) equipped with an imaging reagent used for microstructural analysis.
Figure 2. Parent metal microstructure, optical micrographs, and SEM
Table 3. SMAW and GMAW parameters
|
E8018 |
ER70S-6 |
Electrode Type |
|
3.2 |
1.2 |
Dia. (mm) |
|
125 |
240 |
Current (A) |
|
25 |
30 |
Voltage (V) |
|
140 |
270 |
Speed (mm/min) |
|
---- |
12 (CO2) |
Gas Flow Rate (L/min) |
|
17.86 |
22.67 |
Heat Input (kJ/mm) |
The welding parameters chosen in the paper, from current and voltage to travel speed, electrode type, and heat input, were selected for easy and controlled comparison between Shielded Metal Arc Welding (SMAW) using E8018 electrodes, and Gas Metal Arc Welding (GMAW) using ER70S-6 wire, for making Grade 70 (ASTM A516) steel. Nevertheless, these conditions do not have a huge justification, as admitted by the authors, and require more elaborate interpretation to explain the rationale behind them and the implications for the comparative results. The process parameters are chosen carefully to provide a desired compromise among heat input, cooling rate, and metallurgical transformations. In comparison, a travel speed of 140 mm/min and a current of 125 A in the SMAW mode yield an input heat of 17.86 kJ/mm-1, which will speed up slower cooling and coarse-grained microstructure formation. This simulates the thermal conditions of manual welding, where much less control can be exerted over the heat source. The low hydrogen content of E8018 electrodes reduces hydrogen-induced cracking, which is a problem with pressure vessel steels such as A516. Conversely, the GMAW process uses a higher current value of 240 A at a voltage of 30 V and a faster traveling speed (270 mm/min) and a CO2 shielding gas, which results in a nominal heat input of 22.67 kJ/mm3 with better heat concentration and control. Continuous wire feeding utilizing ER70S-6 wire promotes penetration depth, minimizes droplet transfer, and creates a better microstructure. This can be attributed to the faster self-quenching effect of a more efficient gaseous shielding. Thus, parameter selection was not random, but, on the contrary, it was chosen to have a representative of the typical operative envelopes for each process, and keep the joint geometry equal. The forced conditions have a strong impact on the fusion zone (FZ) and HAZ in both modalities. The combination of higher arc energy and comparatively poor heat control in SMAW results in a broader HAZ of about 19mm and a course, marginally grained structure of ferrite and upper bainite, and martensite. These structures present a stress-hardened microstructure (hardness values of the order of 520HV at the weld center), which is related to the loss of toughness and corrosion resistance due to the presence of residual stresses and precipitation of carbides in such zones. In the GMAW configuration, the controlled arc and shielding gas show a narrower HAZ of about 14 mm and fine bainitic/martensitic microstructures. This results in reduced cooling time and oxygen pick-up, smaller dendrites, and an improved bead profile, which increases mechanical homogeneity and corrosion behavior.
Ultimately, results obtained from the experimental setup highlight process-driven heat flow and metallurgical transformations as the main source of the differences in performance. Thus, they confirm the correctness of the selected parameters that dictate the cooling behavior and the subsequent structure-property relationships in welded A516 Grade 70 joints.
Changes in properties, complex metallurgy, deformation, thermal stresses, and an increase in corrosion rate are all outcomes of the fast thermal cycles experienced by the metals in the weld metal HAZ and the weld metal itself during welding. The recrystallization that occurs during welding alters the corrosion properties and strength of the material, making the joined or welded plates more prone to corrosion. Deterioration, deterioration, or destruction of a substance due to environmental and surrounding factors is known as corrosion. The corrosion rate is a measure of the factors used to assess the degree of corrosion in a material. The material's original weight and its weight after corrosion testing are measured for the measurement. The corrosion testing is conducted according to ASTM standards, with a ferric chloride (FeCl3) solution being used as the corrosion-producing medium. Another name for this procedure is the Ferric chloride pitting test (Method A). The testing procedure for this method includes a 1000 ml measuring glass filled with 600 ml of ferric chloride liquid, and then the material is immersed in the solution for 81 hours. After this specimen is taken out of its container and washed in an aqueduct, to ensure the eliminate of corrosion products from the specimen's surface, dip it into acetone for 5 minutes. The weight loss method for calculating corrosion rates is done by following the formula [21]:
$m m p y=\frac{(K . W)}{(D . A . T)}$ (1)
where, mmpy = millimeter per year, K = constant (3.45 × 10⁶), W = mass reduction due to corrosion (mg), D = density of material (gram/cm3), A = area of corroded specimen (sq.in), T = duration (hour). The corrosion rate calculation above has been modified using the following equation to calculate the pitting corrosion rate.
$p=\frac{W}{(A . T)}$ (2)
where, W = weight loss (gm), A = exposure area (m2), T = duration (hour).
4.1 Macrostructure observation
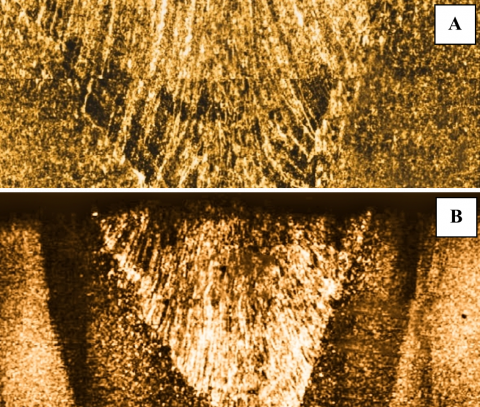
The weld center line (WCL), coarse-grain heat-affected zone (CGHAZ), and fine-grain heat-affected zone (FGHAZ) can be seen in the macrograph of SMAW and GMAW joints separately. Because of the high heat input and subsequent delayed cooling rate in the SMAW process, the resulting bead structure was coarser. Another factor contributing to this expansive FZ is the broader arc column (Figure 3(a)). In comparison to the SMAW method, the energy density of the GMAW process is much higher. This process's strong self-quenching rates unquestionably contribute to the rapid cooling rates. Figure 3(b) shows that this could be because of the small FZ. The manual control of arc and electrode in SMAW results in increased heat input that creates substantial HAZ modifications. GMAW maintains specific heat control throughout the weld process, which generates uniform microstructural distribution across the entire weld area.
Figure 3. SMAW and GMAW weld cross-section macrographs
The continuous feeding mechanism of GMAW, together with shielding gas, produces smoother and more uniform beads than SMAW welds. Due to its ability to regulate the weld pool, GMAW produces higher-quality welds with uniform results than SMAW welds do because of their irregular bead shapes. The amount of spatter and porosity produced in SMAW welds through electrode flux exceeds that of GMAW, making it an advantageous option for precise welding requirements [22].
4.2 Optical microstructure observation
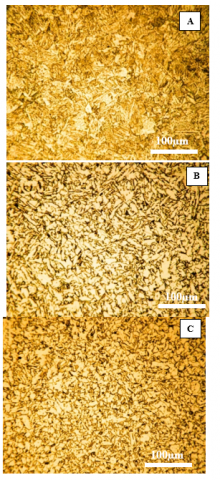
The steel alloy joint's welded region develops Fusion Zone (FZ), Heat Affected Zone (HAZ), and Base Metal (BM) microstructures when using the provided parameters. Multiple textural phases will form in each area due to the weld-specific thermal treatment of these regions. Figure 4(a), (b), and (c) show an A516 GMAW joint with a three-zone microstructure. Figure 4(a) shows the fusion zone combines base material elements with filler material parts from ER70S-6 until solidification occurs. The fusion zone stands as the fundamental area since it determines the properties and strength of the welded joint. Figure 4(a) reveals the fusion zone with various microscopic textures along with different phases, which result from multiple affecting factors such as cooling speeds and welding heat inputs, and alloy composition. A complete description follows regarding the microstructural elements found in fusion zones. Dendritic crystal formation can be observed in Figure 4(a), during which the solidification process is mostly present in the core area of the fusion zone. Dendrites manifest themselves through branching geological formations that often appear during metal solidification processes. Dendrite growth in aligned shapes with heat flow direction (columnar) and randomly oriented dendrites (equiaxed) can also be observed. This microstructure evidence that the heat dissipation rate controls dendrite formation patterns within fusion zone areas. Faster cooling rates (usually at the edges of the fusion zone near the heat-affected zone) lead to finer dendritic branches [23]. During solidification of fusion zones, a cooling pattern results in the creation of large, coarse dendrites that develop within its central region, as seen in Figure 4(a). Various grains appear throughout the fusion zone because of the uneven cooling process that occurs across its width.
Figure 4(a) reveals that no solidification crack appears in this zone. However, the fusion zone may exhibit solidification cracks, particularly when the weld pool cools with low ductility and high stress levels in its center area. The high thermal gradient produces micro-cracks oriented in the direction of solidification [24]. The micrographic picture shows ferrite as the primary phase in the fusion zone of low alloy steels when welded with ER70S-6 filler material, while the welding material cools down. The weld inclusions absorb ductility from ferrite, even though ferrite exists as a weak material individually. Upon the cooling rate becoming slower, the formation of austenite structures that adopt a face-centered cubic arrangement can be noticed. Austenite formation during welding becomes stable in the fusion area when ER70S-6 electrode compositions introduce manganese, silicon, and carbon elements. The solid part exhibits better ductility while providing enhanced strength properties to certain alloys, although it demonstrates embrittlement under fast cooling methods that generate martensitic formation. Martensite phase forms are noticed in specific regions of the fusion zone, where rapid cooling occurs around fusion edges. The rapid cooling or “quenching” of austenite leads to hard, brittle martensite phase formation. Microscopic observation reveals needle-like structures in the appearance of this material. The formation of martensite depends on the carbon concentration and the speed of cooling down the material. Alloy steels contain a martensitic phase, which delivers strong strength characteristics yet leads to diminished material toughness [25]. The region between austenitic and martensitic zones allows bainite to develop as a microstructural component. Bainite presents itself as a microstructure that emerges during intermediate cooling speeds, which delivers a beneficial blend of toughness and strength attributes. A microstructure comprising fine ferrite and cementite exists in this phase, with microscopy showing feathery or acicular features.
During the cooling of the molten weld pool, alloying elements carbon, manganese, and silicon tend to distribute unevenly. During welding solidification processes, the distribution of alloying elements through the material results in areas with distinct phase compositions as well as mechanical properties. Weld zones containing phase boundaries and minor structural variations appear because of molten weld pool solidification. Between large dendrites, dispersed liquid and solid phases at sites which will become fully solidified as the process completes. Interdendritic segregation zones develop because of the higher concentration of alloying elements that build up at interdendritic boundaries [26]. Figure 4(b) illustrates the coarse-grained heat-affected zone (CGHAZ) in the A516 joint. The temperature level in this area triggers specific metallurgical transformations because of intense thermal exposure. Cooled too quickly before transformation, the previous austenite grains have become either martensite or bainite and appear as bright regions. The large polygonal grains show evidence of coarsened martensitic structure, which developed from thermal peak exposure-caused grain growth. The CGHAZ heats beyond the upper critical (Ac3) limit, thus causing the total transformation of Austenite. Grains grow into extensive sizes because both intense heat exposure and minimal presence of nucleation locations exist. Rapid welding cooling leads austenite to transform into martensite or bainite according to alloy composition and cooling speed. The dark parts in the structure normally form as etch-reactive products along either grain boundaries or within grain boundaries. Dark structures appear in the metal due to both high dislocation density and strong etch response of martensite laths/plates [27]. Ferrite in its Widmanstätten crystal structure or bainite structure forms when cooling occurs at a moderate pace. No carbides together with retained austenite appear as precipitates next to grain boundaries. The presence of C, Cr, Mo, Mn, or Ni in steels leads to carbide formation as M₂₃C₆, which appears as boundary-decorating particles and microscopically small precipitates. The combination of martensite within large grains generated material hardness in (CGHAZ) will cause brittleness, and the weldment displays its maximum tendency to develop cracks in this zone.
Results from Figure 4(b) show that austenitization occurs when the temperature reaches above Ac, and all ferrite and pearlite structures transform into austenite. The elimination of fine precipitates at temperatures above 1100–1200℃ starts abnormal grain growth. Complete homogenization of the metal does not take place because microsegregation still exists throughout the structure. Joints with thick sections created through SMAW typically cool at rates from 50 to 100℃/sec, yet failure to pass the martensite start temperature (Ms~400–500℃). Lath martensite develops inside coarse grains because of displacive transformation [28]. Enthalpy equilibrium at grain boundaries leads to carbide formation, particularly when welding materials include Cr, Mo, and V. Thick weldments retain heat that causes minor martensite tempering, which decreases hardness without affecting strength [29].
Figure 4. SMAW with E8018 electrode A516 grade G welding joint (a) Fusion zone (FZ), (b) Coarse-grained HAZ (CGHAZ), and (c) Fine-grained HAZ (FGHAZ)
Figure 4(c) illustrates the FGHAZ microstructure. The FGHAZ receives heat exposure at temperatures slightly over the Ac₃ (~900–1050℃), resulting in total austenitization while the exposure time remains shorter than CGHAZ. The lower peak temperature effectively hinders grain enlargement. Better mechanical characteristics developed because the material retained its fine, small prior austenite grains. When cooled down, the refined austenite forms martensite together with bainite and ferrite, depending on cooling rate, combined with alloy content and nucleation site presence [30]. The changed ferritic or martensitic structure produces bright areas that create small, evenly shaped or slightly stretched grains with light markings due to their few dislocations. The likely phases are tempered martensite or lower bainite because they originate from fine-grained austenite. A polygonal formation of ferrite occurred because it formed through diffusion processes when the cooling rate permitted diffusional transformation. The austenite grains stay small because of reduced peak temperatures, together with accelerated cooling processes. The internal strain of fine martensite in CGHAZ remains lower than that of lath martensite and results in decreased etching. Ferrite crystal formation relies on diffusion-controlled transformation at a suitable cooling rate. The dark regions inside the material structure contain either martensite laths or bainite plates and fine carbides [31]. The material displays dark appearances due to the etching process that affects zones containing numerous dislocations and tiny carbide particles under stress or composition differences. The process of undercooled austenite yields lath martensite, which contains an elevated quantity of dislocations. The acicular ferrite plates forming bainite at the upper parts contain carbides that separate themselves along the laths. The formation of carbides such as M₂₃C₆ and Fe₃C, as well as intragranular carbides, occurs during the process of cooling the system [32]. The phase transformation sequence involved in forming FGHAZ begins with Austenitization, which occurs above Ac₃ (~900–950℃) It transforms ferrite/pearlite into austenite, but the brief waiting period minimizes grain size refinement of austenitic grains before rapid air-cooling triggers martensitic transformations. Rapid cooling through air leads to the transformation into martensite within refined grains.
The cooling rate, together with alloy content, determines whether upper bainite will form in specific areas. The material develops tempered martensite after transformation because of the remaining heat [33]. Grain boundary ferrite develops as a result of temperatures that exceed the Ms threshold during transformation. Carbides prefer to form at grain boundaries or within laths, in particular when Cr or Mo-rich alloys are present. The metallurgical Table 4 shows how the optical micrograph features relate to phase transformations that occur throughout each area of the SMAW-welded joint between A516 grade G materials made with E8018 electrode. Several microstructurally distinct areas form during fusion welding when different thermal gradients operate, resulting in special transformation processes and specific grain shapes accompanied by certain phases. These microstructural zones enable the exact interpretation of observed physical characteristics that relate to metallurgical importance because they clearly differentiate between the fusion zone and both the CGHAZ and the FGHAZ regions [34]. Structure–property relationships in welded joints become understandable through systematic mapping because the method enables improved mechanical performance optimization along with the prediction of potential failure zones, including brittle fracture and hydrogen-assisted cracking, and aids in the development of post-weld heat treatment strategies. The creation of this table represents an essential requirement for descriptive characterization as well as a predictive method for process improvements and structural reliability enhancement.
4.3 Fusion zone SEM analyses
4.3.1 SMAW with E8018 fusion zone SEM analyses
The study of welding fusion zone microstructures for examining mechanical behavior needs the use of scanning electron microscopy (SEM). Regular optical microscopy falls short of SEM in identifying bainite, martensite, ferrite, and retained austenite simultaneously at the same level. SEM serves three functions: revealing solidification patterns while investigating grain structures and scanning for flaws that include inclusions and micro-cracks. Microstructural information serves to evaluate weld performance for both inspection and post-weld heat treatment decision-making and quality control purposes.
Table 4. Microstructural features across weld zones
|
Fusion Zone (FZ) |
Coarse Grain HAZ (CGHAZ) |
Fine Grain HAZ (FGHAZ) |
Zone |
|
Bright dendritic structures; proeutectoid ferrite or acicular ferrite formed during solidification. |
Bright coarse grains; martensite transformed from large-grain austenite. |
Bright fine-grain matrix; tempered martensite or ferrite with smooth equiaxed texture. |
Bright Areas (Appearance & Phase) |
|
Dark interdendritic areas; martensite/bainite in segregated zones, or carbide films. |
Dark lath martensite, GB carbides (M23C6), or bainite plates; highly etched due to strain. |
Dark fine laths or plates; martensite/bainite and minimal carbide segregation. |
Dark Areas (Appearance & Phase) |
|
Solidification from molten pool → austenite → ferrite/acicular ferrite; residual austenite → martensite/bainite. |
Austenitization at >1100 °C → grain growth → martensitic transformation on rapid cooling. |
Austenitization at ~900–1050 °C → refined grains → martensite/bainite/ferrite mix. |
Transformation Mechanisms |
|
Fully melted and resolidified; rapid directional solidification with solute segregation. |
Full austenitization and grain coarsening; rapid post-weld cooling. |
Lower thermal input; refined grains; no grain coarsening. |
Thermal/Metallurgical Conditions |
|
Moderate strength; acicular ferrite improves toughness, but segregation may localize hardness. |
High hardness, low toughness; primary zone for hydrogen-assisted cracking (HAC). |
Excellent balance of strength and toughness; favorable fatigue performance. |
Mechanical Implications |
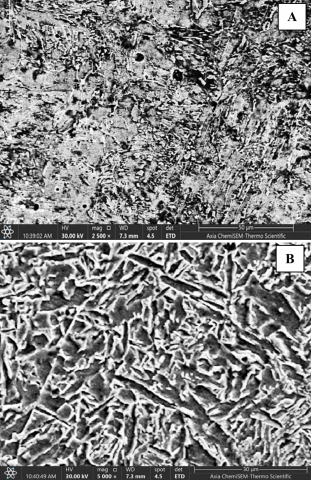
A noticeable coarse grain inside the E8018 fusion zone exists within the SMAW structure of A516. High welding heat temperatures lead to the direct formation of this structure. When the welding pool reaches its melting point and then cools rapidly, it results in A516 forming large, non-uniform column-shaped grains. Several different-sized grains can be observed in the fusion zone according to this presentation. SEM morphology demonstrates that both martensite and bainite exist within the examined area. Fast cooling of the fusion zone leads to the development of these phases. The quick solidification of molten metals does not allow carbon atoms to move, therefore creating hard but brittle martensite phases. Bainite emerges through temperature variations at different zones in material structures, and it demonstrates higher strength than martensite under specific temperature conditions. The microstructure of martensite shows black needles, while bainite contains light-colored plates. During solidification, the fusion zone reveals a complicated texture from the various-sized grains and phases that developed because cooling rates differed throughout the process. In Figure 5(a), elongated grains establish that the material adopted columnar growth patterns, which align with the heat flow direction while solidifying. This occurrence is normal within the fusion zone because cooling rates vary from place to place. The micrograph shows high-magnification martensite and bainite structures that formed because the cooling rate was sufficiently fast. Rapid cooling of the weld pool mainly determines its texture properties.
Figure 5. Fusion zone SEM (a) SMAW with E8018 SEM and (b) GMAW with ER70S-6 SEM
The molten state temperature gradient drives solidification, which starts from the weld pool edges before reaching the center and produces coarse-grained structures together with martensite in specific areas and bainite in others, depending on local cooling rates. The E8018 electrode influences the microstructure formation through its selected alloying elements, which impact cooling processes during solidification. The electrode produces welds with both high strength and toughness, which enables the formation of martensitic and bainitic phases within the fusion zone. During Shielded Metal Arc Welding, the welder must pay close attention to the heat input since this factor significantly influences the welding outcome. The alloy structure becomes more extensive when the heat input runs high, but remains fine when the heat input stays low. Fast cooling conditions support the development of martensitic structures throughout specific parts of the fusion zone despite their known brittleness [35].
4.3.2 GMAW with ER70S-6 fusion zone SEM analyses
A fine needle-like microstructure of Upper Bainite appears in the GMAW fusion zone according to the SEM image shown in Figure 5(b). The Upper Bainite displays thin needle-like structures surrounded by ferrite layers containing retained austenite and martensite areas. Ferrite exists along the prior austenite grain boundaries with a white or lighter appearance. The dark areas found in the image could represent M/A islands because the E70S wire used in the welding process contains small alloy additives that support the retention of austenite during rapid cooling. The fusion zone exists as completely solid material with needle-like features showing evidence of columnar solidification grains, although they remain undetectable in this area. Acicular features aligned in a highly directed manner indicate the direction (perpendicular to the weld pool boundary) in which heat extraction occurred rapidly. The welded structure shows rapid phase transformation and solidification due to the high cooling rate found in GMAW processes, which results in acicular appearance and absent equiaxed grains.
Table 5. SMAW (E8018) and GMAW (E70S) fusion zone SEM microstructure characteristics comparison
|
Aspect |
SMAW (E8018) |
GMAW (E70S) |
|
Main Microstructure |
Mixed: Martensite + Bainite |
Predominantly Upper Bainite, with M/A islands |
|
Grain Structure |
Coarse, partially lath-like; acicular martensite evident |
Fine, dense, acicular (bainitic ferrite sheaves) |
|
Texture |
Irregular grain alignment, partially directional |
Highly directional acicular laths, aligned with heat flow |
|
Phase Contrast |
Distinct light and dark regions: martensite (dark), bainite/ferrite (light) |
Lighter bainitic laths with dark retained austenite or M/A regions |
|
Cooling Rate Influence |
Rapid cooling → martensitic transformation |
Moderate cooling → bainitic transformation |
|
Hardness Expectation |
Higher due to martensite (hard but brittle) |
Moderate hardness, better toughness than SMAW |
|
Solidification Structure |
Columnar dendritic grains (implied), less refined |
Directional solidification, fine solidification substructure |
|
Metallurgical Implications |
High strength, but possible reduced toughness if not tempered |
Balanced strength and toughness, better weld ductility |
|
Phase Stability Influencers |
Higher carbon + basic flux stabilizes martensite |
Mn & Si in filler promote bainite, suppress pearlite |
The combination of GMAW with E70S wire typically runs at moderate to high currents to produce a penetration depth middle range while also creating fast drying times when welding in flat positions with minimal protection. The fast solidification rate promotes bainite formation instead of pearlite or ferrite-pearlite through the aid of alloying elements found in the filler material, particularly C, Mn, and Si. The E70S filler wires consist of electrodes containing carbon steel and copper with low hydrogen content, while also including Mn (1–1.5%) and Si (0.5–1%) components. The combination of manganese and silicon with steel increases its hardness, which transforms its structure from ferrite and pearlite to bainite and martensite/austenite (M/A). The addition of silica to steel aids in stabilizing the residual austenite between laths through carbide inhibition. The complete melting of the fusion zone results in δ-ferrite formation before the material transforms into austenite while it cools. Austenite transforms into bainite when fast cooling occurs, while the alloy is present. The portions of high manganese or carbon content create isolated spots where austenite or martensite remains untransformed [36]. A comprehensive Table 5 presents below an evaluation of SMAW (E8018) and GMAW (E70S) fusion zone microstructure characteristics in A516 grade G through the integration of SEM data and established metallurgical knowledge.
4.4 Microhardness profile analyses
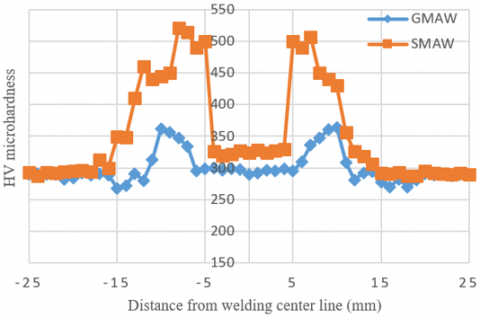
A516 grade G joining methods, SMAW and GMAW, exhibit distinct characteristics regarding heat input and cooling rates, together with dissimilar electrode behaviors. SMAW (with E8018 electrode) yields high heat input from its reduced speed and restricted heat distributions through the weld zone. Because of the fast-cooling rate, the weld metal develops martensitic microstructures while achieving higher hardness near the weld center. Using SMAW produces a wide HAZ together with elevated residual stresses, which raises the risk of weld cracking. Because of its continuous wire supply and shielding gas system, GMAW produces heat at a lower rate than SMAW when generating welds. The GMAW weld tends to form ductile ferritic or bainitic microstructural components. GMAW enables the manufacturing of welds with reduced HAZ width while attaining similar hardness throughout the entire weld area. Figure 6 below illustrates the microhardness results of both welding techniques.
Figure 6. SMAW and GMAW microhardness test results charts
According to this hardness profile chart (Figure 6), the two processes display divergent results. The hardness measurement of SMAW welds at the center shows increased values, which point to martensite formation resulting from fast cooling rates. The material exhibits such behavior within the fragile section of the weld zone. The welding procedure employing GMAW produces lower and more uniform hardness levels, which indicates that it results in a weld material that is less brittle and tougher at a slower cooling rate.
When welding occurs, the material achieves a full melting state while directly experiencing high welding process heat before solidifying after cooling down. The fusion zone generally displays enhanced hardness levels, which result primarily from martensitic formation, particularly in SMAW processes. A sharp peak identifies microhardness at its peak in the FZ hardness profile, which appears close to the weld's center in the presented chart. The depth of hardness attains its maximum value in SMAW steel because of its fast-cooling rate and resulting rigid microstructure formation. GMAW produces slightly less hardened steel at this location compared to both HAZ and BM, but the metallurgical changes lead to higher values than the base metals. The fusion zone in SMAW tends to have a slightly wider dimension than in SMAW because of its increased heat application. The weld bead size with GMAW remains narrow because of the shielding gas system. The Fusion Line acts as the border between melted fusion zone material and thermally changed heat-affected zone material. The materials found in this zone transition from being totally melted to partially melted, making it a vital operational area. The fusion line Hardness Profile shows an intense decrease in resistance values. The microhardness experiences a significant decrease within the area preceding the HAZ, where this location is situated. The weld center typically shows a thin and indistinct band, which constitutes this narrow area.
The HAZ extends next to the fusion zone, yet the metal remains solid because welding heat exposure has altered its structure. The HAZ high temperature modifies the metal microstructure, while the cooling speed determines its hardness level. The central part of the heat-affected zone marks the position where grain coarsening develops, thereby reducing material hardness while possibly increasing brittleness [37]. The HAZ Hardness Profile demonstrates a softening effect that extends outward from the fusion zone, and this behavior appears equally in SMAW and GMAW. The SMAW HAZ shows a greater hardness inconsistency compared to the GMAW HAZ because of its swift cooling speed and risk of forming martensitic microstructures. GMAW produces a HAZ with steady and mellow properties through its gradual cooling process. Table 6 below illustrates the maximum hardness values recorded for the three distinct welding joint zones.
Table 6. Three welding joint zones' maximum hardness values
|
Zone |
SMAW Mean HV ± SD |
GMAW Mean HV ± SD |
|
Fusion Zone |
520 ± 11 |
310 ± 9 |
|
Fusion Line |
335 ± 8 |
295 ± 7 |
|
HAZ |
460 ± 12 |
335 ± 10 |
The standard deviation (or frequently denoted as SD) in the above table is a statistical measure to quantify how much the data values differ from the arithmetic mean (or average). It is a measure of dispersion or variation that exists within a set of data. A small value of SD means that there are small deviations from the mean, which indicates high consistency of observations. On the other hand, a large SD indicates observations are widely spread in a larger range, indicating a large variability of the data. In applied situations, in which results are presented in tabular form as "mean+- SD," the SD indicates the average magnitude of deviation of individual measurements from the mean. The use of the standard deviation is indispensable in evaluating the degree of reliability and precision of experimental findings. It allows one to test whether observed differences, for example, between two welding techniques, are specific differences or simply due to random variability among samples. Formally, the value of SD is found in the following procedure: (1) find the arithmetic mean of the values of the observations; (2) find the differences between each observation and this mean; (3) square each of the deviations; (4) average the squared deviations; and (5) take the square root of this average value.
The Heat Affected Zone stretches up to multiple millimeters beyond the fusion interface. The size of the heat-affected zone in SMAW extends wider with a more pronounced decrease in material hardness, but GMAW produces a narrower and better-controlled HAZ zone. The Fusion Zone's position can normally be assessed to exist between 5 mm on each side of the weld centerline because the hardness evaluation showed a swift increase followed by a decline. The hardness measurements demonstrate that the SMAW heat-affected zone spreads up to 12 mm beyond the fusion line. The larger HAZ occurs with SMAW welding because the process generates higher heat that leads to sizeable material structure modifications. The GMAW HAZ maintains a small width measuring 7 mm next to the fusion line because of heat control and the gradual cooling characteristic. Table 7 below summarizes these zones' dimensions and characterizes them.
Table 7. Welding zones with approximately dimensions according to the microhardness results
|
Welding Zone |
SMAW (E8018) Approx. Dimensions |
GMAW (ER70S-6) Approx. Dimensions |
|
(FZ) |
5 mm (sharp rise in hardness) |
5 mm (sharp rise in hardness) |
|
Fusion Line |
7 mm (sharp drop-off in hardness) |
7 mm (sharp drop-off in hardness) |
|
(HAZ) |
19 mm (gradual decrease in hardness) |
14 mm (gradual decrease in hardness) |
4.5 Tensile and Charpy test results analysis
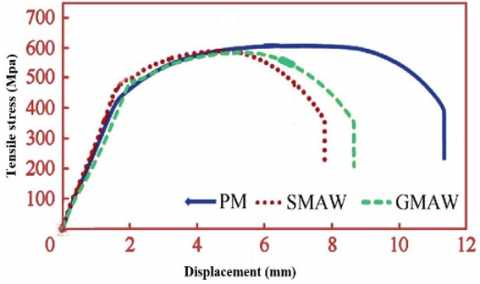
Figure 7 presents the tensile strengths of the base metal and the welded joints. The yield strength of the base metal was 446 MPa, while its tensile strength was 617 MPa. Nonetheless, the SMAW joint has a yield strength of 468 MPa and a tensile strength of 581 MPa, which is 5.2% inferior to that of the parent metal. The yield and tensile strengths of the GMAW joint are 491 MPa and 588 MPa, respectively, reflecting a 5.1% reduction from the parent metal's values. Joints fabricated using the GMAW technology exhibited superior strength compared to other types of welded connections. The elongation rate of the parent metal is 27%, but the GMAW joint exhibits a rate of 22%. Overall, the GMAW procedure appears to diminish ductility by 23%. In comparison to the parent metal, the SMAW joints exhibit an elongation percentage that is 33% lower, measuring at 17%. In the comparison of the two welded joint types, the ductility values of GMAW joints exceeded those of SMAW joints. Figure 8 illustrates the stress-displacement curves of the base metal and the welded joints. Table 8 presents the results of the Charpy impact toughness test. The parent metal exhibits an impact hardness of 81 J at ambient temperature. The weld metal's 72 J after GMAW welding is 36% inferior to that of the parent metal. Joints fabricated using the SMAW technique had the lowest impact strength (65 J) compared to those produced using the GMAW method (72 J).
Figure 7. Base metal and welded joints: Load vs displacement curves
Table 8. Parent metal and welded joints' mechanical properties
|
(PM) |
SMAW |
GMAW |
Joint |
|
446 ± 5 |
468 ± 7 |
485 ± 6 |
Yield Strength (MPa ± SD) |
|
617 ± 6 |
578 ± 8 |
588 ± 7 |
Tensile Strength (MPa ± SD) |
|
27 ± 1 |
17 ± 1 |
22 ± 1 |
Elongation (% ± SD) |
|
81 ± 2 |
65 ± 2 |
72 ± 2 |
Impact Energy (J ± SD) |
|
— |
520 ± 11 |
310 ± 9 |
Weld Metal Hardness (HV ± SD) |
|
Center |
HAZ |
HAZ |
Fracture Location |
4.6 Tensile test sample fracture SEM analyses
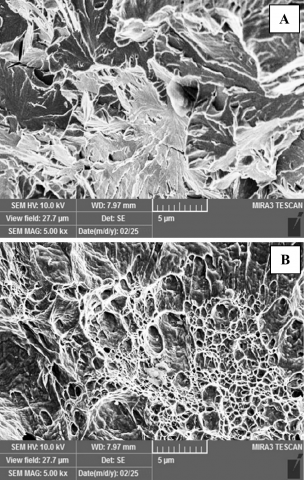
Examining fractures with SEM constitutes an essential method to understand the mechanical properties that emerge in welded joints. The method presents the step-by-step failure processes along with ductile-brittle examination, followed by microvoid coalescence and crack growth procedures. The features that stress SEM analysis are vital because they find fundamental aspects of residual stresses, together with phase transitions and material flaws that decrease welded joint strength and structural integrity. Examining broken materials enables improvement of welding parameters while advancing material production methods, which subsequently ensures dependable performance for critical uses. Figure 8 (a) and (b) below illustrate the tensile test samples' fracture surface SEM.
Figure 8 (a) demonstrates flexible breaking through a tiny hole unification on the surface of SMAW. Ductile fracture surface characterizes itself through its large, irregular voids combined with fibrous textures that appear due to enormous plastic deformation preceding failure. The fracture occurs within the HAZ of the material because the welding heat affected the surrounding material area. Stress residuals and hardness modifications in this region cause it to become weaker than the base material, thus becoming a vital structural point. Small holes within the SEM image represent a typical sign of ductile fracture due to material voids producing larger cracks, leading to material failure. The SEM image displays a textured appearance, which probably combines fibrous patterns with round-shaped voids that are frequently observed in ductile HAZ fracture locations. The plastic deformation process generates a special texture whose appearance signals stretching of the material before voids start forming and eventually grow until breaking happens. The surrounding material demonstrates signs of necking through the reduction of its cross-sectional area shortly before the crack reaches a complete length [38].
Figure 8. Tensile test samples fracture morphology (A) SMAW sample, (B) GMAW sample
Several variables related to welding procedures generate micro-cracks inside the HAZ of SMAW fractures, as seen in Figure 8 (a). Material stress responses together with welding-induced structural modifications become visible through the formation of these vital indicators known as cracks. Material structure develops different types of cracks during welding when it experiences fast heating and cooling conditions. The welding process creates residual stresses that focus on the HAZ region alongside the weld bead because of thermal expansion and contraction. High thermal gradients lead to material shrinkage together with thermal expansion that produces micro-cracking at HAZ locations, primarily because this material section does not efficiently handle these stresses. Due to the welding heat application, the HAZ grain material structure changes substantially. Differentially treated A516 alloy steel may undergo martensitic transformation in the heat-affected zone and produce brittle phase zones. The brittle phases in this material become easier targets for tensile stress, which ultimately leads to multiple micro-cracks. The welding method with SMAW allows hydrogen materials to enter both the welding metal and the heat-affected zone material. The process of hydrogen embrittlement causes micro-cracks to occur within regions experiencing high levels of stress. The HAZ represents a zone where rapid cooling and microstructural modifications cause hydrogen retention that decreases Micro-cracks in Figure 8 (a) present through the SEM images display short and pointed discontinuities inside voids or along the borders between grains. Fractures normally originate from particular vulnerable areas, including martensite phases together with brittle substances and voids or sulfide and oxide particles. The SMAW fracture surface extends either through the grains as trans granular fractures or along the grain boundaries as intergranular cracks. The crack propagation occurs either within material grains through trans granular paths or it spreads along the intergranular spaces between grains. Intergranular cracks are significant indicators of material imperfection at grain boundaries because welding stresses or HAZ changes can cause this weakness between grains. Plastic deformation leads to micro-cracks and micro voids joining together. The combination of cracks spreads toward each other, creating greater fractured areas. The material shows small crack formation at initial weakening points that may lead to the development of the bigger voids discovered in tests of the SMAW sample. Sheared areas near material cracks increase overall damage to the point of material failure [39].
The morphology of the GMAW fracture in Figure 8 (b) exhibits slight distinctions compared to the other welds. The HAZ is the location where this fracture forms in both welding processes, yet the GMAW results in more uniform fractures than SMAW. Morphology in Figure 8 (b) shows smaller voids and a more uniform fracture surface, likely indicating less plastic deformation. The material showed reduced plastic behavior at this location, possibly because it had lower strength in the specific area. Due to a shift between ductile and brittle material behavior within this condition, smaller, distinctive void shapes appear in the fracture surface. The observed change in material strength possibly arises from excessive residual stress, together with pronounced welding procedure effects or unfavorable HAZ grain arrangement. The fracture from GMAW welding shows smaller grains than the SMAW weld. GMAW enables controlled heat input to the material, which potentially creates alterations in the material structure. The fracture surface of the GMAW sample features smaller void characteristics with uniform distribution, which indicates reduced localized strain before breakage occurs. The specific hardness, together with the microstructure of the HAZ area, will determine how many brittle fracture characteristics are present in the material. The fracture occurs through a trans granular fracture that runs along the grain boundaries.
From the macroscopic examination and scanning-electron-microscope (SEM) fractographic analysis of tensile test specimens, material failure basically occurred in the HAZ of both welding configurations. The fracture surface of the SMAW joints was found to consist of coarse facets illustrating cleavage cracking and irregular cracking, characterizing intergranular cracking, which is consistent with the appearance of the martensitic microconstituents and high residual stresses. This brittle fracture mode is in agreement with the low elongations and low impact toughness that are measured. In contrast, GMAW specimens showed more ductile fracture behavior with many fine deep dimples, which suggests a superior plastic deformation before failure. Such morphology is incorporated with an additional homogenous bainitic microstructure feature and achieves a balanced toughness, which adds support to the realizations of concurrently improved elongation and impact energy. Experimental results show that the GMAW welds exhibit a slower and prolonged strain-hardening phase beyond the yield point due to gradual growth of dislocation density and following interaction with similar fine bainitic microstructure (i.e., fine bainite microconstituent), and the progression and this hardening mechanism improves the ductility and toughness. In contrast, SMAW welded joints have a distinct yield point with fast strain hardening saturation, as a result of a dominant martensitic microstructure, which inhibits dislocations early in plastic deformation, reducing ductility and causing earlier necking. The microstructural and mechanical mechanisms of GMAW are superior, indicating the outstanding fabrication of welds with higher toughness and energy absorption capabilities, which are critical for applications where impact resistance and fatigue durability are required. Furthermore, the strain-hardening behavior of the GMAW fusion zone supports the greater stability and homogeneity of the GMAW fusion zone compared to the SMAW.
5.1 Corrosion weight loss test analysis
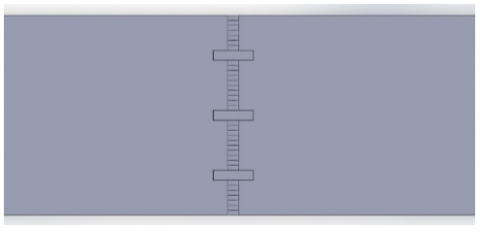
Figure 9 displays welding specimens for SMAW and GMAW samples. Three samples were extracted from each welding process specimen by sectioning the specimen at the left, right, and center ends, each measuring 20 mm in width, as seen in Figure 10. Three welding samples were prepared for each welding process to measure the corrosion weight loss, used for 20 different corrosion times. The samples were subsequently submerged in 600 ml of FeCl3 solution, with each glass beaker containing the identical welding current.
Figure 9. Corrosion test sample’s locations
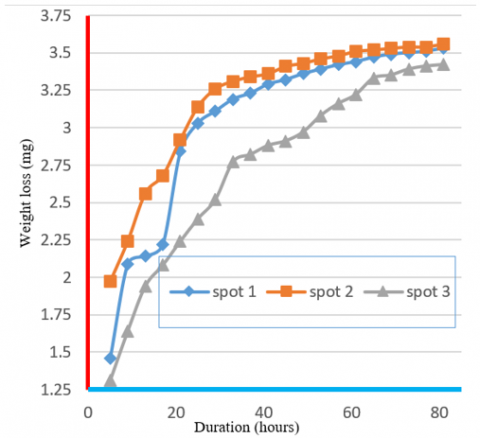
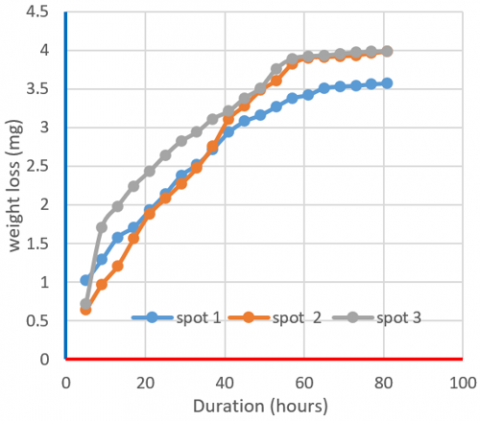
Data collection occurred at 4-hour intervals, during which samples were weighed prior to and following immersion. The three samples were located at both ends with a discard distance and at the center of the welding line. Table 9 shows the reduction in sample weight throughout the designated time period. Utilizing Table 9 and employing equations 1 and 2, the corrosion rate data for a length of 81 hours may be ascertained, as seen in Table 10. According to Table 9, the data may be displayed to illustrate the weight loss of the sample during an 81-hour timeframe for various welding technologies. Figure 10 illustrates the weight loss of the three samples during Gas Metal Arc Welding (GMAW). The figure indicates a quick decline in weight until the fifth hour, followed by a gradual reduction in the slope, ultimately reaching a plateau at the eighty-first hour. Figure 11 illustrates the weight decrease of the three samples for SMAW.
Figure 10 presents GMAW joint sample weight loss measurements in milligrams throughout its 81-hour immersion in FeCl3 solution across three sample locations. The authors made readings from the charts every 4-hour interval for the three separate samples. The sampled area extends from the weld line beginning to its midsection and the end point of the welding line. The third spot for measurement exists at the extremity of the welding line. From the beginning of the experiment until the end of 81 hours, Spot 1 (Welding Line Start) demonstrated the highest weight loss rates yet maintained this elevated rate during the entire period. Spot 2 begins with lower weight loss than both other spots until its pace accelerates to exceed spot three while maintaining lower levels than spot 1 in the later period. The weight loss observation at Spot 3 (Welding Line End) displays the least starting deterioration while maintaining the slowest weight loss boost that stays lower than both other test locations throughout the whole testing period.
Table 9. 81-hour duration sample weight loss
|
Duration (hrs.) |
GMAW (Weight Loss gm) |
SMAW (Weight Loss gm) |
||||
|
Spot (1) |
Spot (2) |
Spot (3) |
Spot (1) |
Spot (2) |
Spot (3) |
|
|
5 |
1.46 |
1.97 |
1.31 |
1.02 |
0.64 |
0.72 |
|
9 |
2.09 |
2.24 |
1.64 |
1.29 |
0.97 |
1.71 |
|
13 |
2.14 |
2.56 |
1.94 |
1.58 |
1.21 |
1.98 |
|
17 |
2.22 |
2.68 |
2.08 |
1.71 |
1.56 |
2.24 |
|
21 |
2.84 |
2.92 |
2.24 |
1.93 |
1.88 |
2.43 |
|
25 |
3.03 |
3.14 |
2.39 |
2.14 |
2.08 |
2.64 |
|
29 |
3.11 |
3.26 |
2.52 |
2.38 |
2.27 |
2.82 |
|
33 |
3.19 |
3.31 |
2.77 |
2.52 |
2.48 |
2.94 |
|
37 |
3.23 |
3.34 |
2.82 |
2.27 |
2.76 |
3.11 |
|
41 |
3.29 |
3.36 |
2.88 |
2.94 |
3.11 |
3.21 |
|
45 |
3.32 |
3.41 |
2.91 |
3.08 |
3.39 |
3.38 |
|
49 |
3.36 |
3.43 |
2.97 |
3.16 |
3.48 |
3.51 |
|
53 |
3.39 |
3.46 |
3.08 |
3.27 |
3.61 |
3.76 |
|
57 |
3.42 |
3.48 |
3.16 |
3.38 |
3.82 |
3.89 |
|
61 |
3.44 |
3.51 |
3.22 |
3.42 |
3.90 |
3.92 |
|
65 |
3.47 |
3.52 |
3.43 |
3.51 |
3.91 |
3.93 |
|
69 |
3.49 |
3.53 |
2.45 |
3.53 |
3.92 |
3.95 |
|
73 |
3.50 |
3.54 |
2.49 |
3.54 |
3.93 |
3.97 |
|
77 |
3.51 |
3.54 |
3.51 |
3.56 |
3.96 |
3.98 |
|
81 |
3.53 |
3.56 |
3.52 |
3.57 |
3.98 |
3.99 |
Table 10. Various specimens with 81 hours of duration, corrosion rates
|
Duration (hrs) |
GMAW |
SMAW |
|
5 |
60.12077 |
30.18722 |
|
9 |
42.06763 |
27.97462 |
|
13 |
32.39224 |
25.07471 |
|
17 |
26.03890 |
20.55507 |
|
21 |
24.15944 |
18.84436 |
|
25 |
21.71451 |
17.40205 |
|
29 |
19.44106 |
16.33574 |
|
33 |
17.81484 |
15.33575 |
|
37 |
16.09460 |
13.11221 |
|
41 |
14.74094 |
13.96755 |
|
45 |
13.58566 |
13.36017 |
|
49 |
12.63194 |
12.72253 |
|
53 |
11.97773 |
12.50422 |
|
57 |
11.19282 |
11.73799 |
|
61 |
10.57322 |
11.25939 |
|
65 |
10.16648 |
10.66407 |
|
69 |
8.70396 |
10.09182 |
|
73 |
8.27916 |
9.56491 |
|
77 |
8.69740 |
9.13392 |
|
81 |
8.30705 |
8.72984 |
The start of the welding line experiences large microstructural disparities due to welding temperature gradients along with quick cooling rates. The weld origin shows a distinct phase distribution leading to ferrite formation in this area since ferrite demonstrates increased sensitivity to FeCl₃-induced pitting and crevice corrosion. The fusion zone contains dendritic structures that lead to increased ferrite content, resulting in increased material corrosion susceptibility. The localized corrosion occurs since ferrite-rich regions show a higher anode potential than austenitic regions. The high initial weight loss demonstrates that localized corrosion (probably pitting) takes place in this area because of microstructural defects paired with phase segregation. The weight loss expands continuously, yet the speed of growth begins to stabilize because the corrosion-prone areas have been damaged and the surviving material has displayed enhanced resistance to deterioration. Early weight loss increases dramatically because both the microstructural heterogeneity and surface defects make the fusion line the most vulnerable area.
Figure 10. GMAW three samples weight loss
At the weldments center, the microstructures create a more consistent distribution than what exists in fusion zones. This location usually requires a slower cooling speed that produces balanced phase distributions. With a calmer cooling rate in the center compared to the fusion zone, the material exhibits a reduced tendency toward localized corrosion because it remains more homogeneous. The initial weight loss rate at the center zone occurs at a slower pace than at the fusion line since localized pitting and micro-cracking affect the fusion line more than the center. When time advances, the area in the center of the specimen shows steady corrosion at a moderate pace that will ultimately surpass the weight loss experienced by the end of the welded joint. The normal dissolution process becomes more uniform because time allows complete material decomposition. The center area experiences steady corrosion development according to the weight loss data, which indicates the influence of diffuse corrosion actions more than localized aggressive attacks. The weight loss profile achieves better consistency during this process than the fusion line does. Figure 11 demonstrated that the beginning weight reduction occurs fast in Spot 1 (Welding Line Start). The overall weight reduction at spot 1 remains the highest throughout the experimental period because its weight reduction continues to rise steadily as time progresses. Weight loss in Spot 2 (Center) starts more gradually after the beginning frame than Spot 1 does. Weight loss shows a steady growth during the experiment until it reaches the same level as spot 1. Weight loss at the third spot (Welding Line End) started high, but it proceeded at a steady but slower pace in comparison to spots 1 and 2. Weight loss from spot 3 continues its incremental climb; however, this growth becomes weaker than both other measurement points. The welding lines initiate with diverse microstructure patterns from the welding procedure heat that causes temperature gradients and fast cooling rates. The corrosion-prone areas within this zone might contain greater amounts of ferrite and other such phases. The fusion zone develops specific localized defects, which include micro-cracks and pores, and phase segregation together. The weld beginning region may contain elevated ferrite amounts before welding, which shows high pitting corrosion sensitivity under FeCl₃ solution. The portion of the sample undergoes rapid corrosion because different areas within the microstructure develop contrasting electrochemical conditions that facilitate intense corrosion. Weight loss at this initial stage indicates that material degradation occurs locally and through defects that exist in the microstructure. The corrosion resistance reaches equilibrium as the surface damage becomes equal, but maintains higher overall levels compared to different areas. The fusion zone shows decreasing vulnerability to corrosion after the termination of its initial intense corrosive exposure.
Figure 11. SMAW three samples weight loss
Slower cooling rates make weld centers adopt a balanced and uniform microstructure when compared to fusion lines. The weld's center section shows increased homogeneity because it contains fewer imperfections, which make it more resistant to localized corrosion. This material section contains an equal combination of austenite and ferrite. Yet, its corrosion rate remains lower than the fusion line because its uniform and stable microstructure exists throughout this area. The measured corrosion extends gradually from the surface, indicating lower susceptibility to fast pitting, which typically affects fusion areas. The corrosion rate rises gradually as FeCl₃ affects the solution-stable material, although it does not escalate to match spot 1's destructive speed. The material slowly disintegrates throughout the observation period without developing the harmful localized attacks that would have triggered accelerated corrosion. The microstructure in the welding line end exhibits higher consistency compared to other zones because it experiences minimal thermal effects. The cooling dynamics in this region are milder than in other zones, so it contains fewer defects than fusion areas. The last segment of the weld line shows maximum corrosion resistance because it features homogenous material with high austenite content, since this phase demonstrates better corrosion resistance over ferrite. Initial corrosion rates show that surface defects or phase segregation resulting from high corrosion rates do not affect this material because it maintains a slower acceleration level. Finally, weight measurements indicate the corrosion advances evenly, which results in steady material dissolution at a reduced rate than what is observed at the fusion junction. A steady upward trend in weight loss reveals that corrosion distributes uniformly throughout time, leading to limited areas where rapid weight loss could occur.
The corrosion rates of the two welding joints appear in Figure 12. The data reveal that GMAW resulted in a more rapid reduction of corrosion rate than SMAW during the 81-hour assessment. The changing corrosion resistance of alloy steel joints depends strongly upon the welding techniques utilized.
Figure 12. 81 hours duration GMAW and SMAW specimens’ corrosion rates
The GMAW process initiated its corrosion rate at 60.12 mm/year (mmpy) after five hours, before the rate gradually decreased over time. At 81 hours, the corrosion rate stabilizes near 8.31 mmpy. SMAW initiates corrosion at 30.19 mmpy during its first 5 hours before it decreases at a slower pace than GMAW. The corrosion rate reaches its final value of 8.73 mmpy after 81 hours. The initial rapid decline of GMAW corrosion rates from 60.12 mm/year (mmpy) to lower levels becomes stable before SMAW reaches the same value. The GMAW welding technique develops superior resistance to corrosion throughout the initial 30 hours because its rate measures significantly more than SMAW. Several structural factors and heat utilization, together with cooling rates, explain the differing rates of corrosion shown in the graph between Gas Metal Arc Welding (GMAW) and Shielded Metal Arc Welding (SMAW). Gas Metal Arc Welding's fast cooling occurs because operations include continuous filler material addition and shield gas application. The weld metal acquires small uniform grains that host stronger material components as upper bainite and martensite, because of its higher energy input. The microstructural grains dissipate heat more quickly to form stronger areas with better corrosion resistance in the exact regions where dendritic patterns are fine [40]. The temperature reduction in SMAW occurs at a slower pace because of its operating method. During the manufacturing process, the resulting weld zones obtain bigger grains through heat effects that create both HAZ and FZ regions. The material becomes more prone to corrosion because of the larger amounts of martensite and bainite in the material structure. The brittleness, together with pitting corrosion, tends to rise mainly in coarse grains where martensitic phases exist.
GMAW generates phases such as fine bainite and retained austenite throughout the welds in a uniform pattern that provides superior localized corrosion resistance. A uniform distribution of these phases in GMAW welds generates electrochemical stability throughout the weld surface, thus reducing its corrosion rate over time. The heterogeneous microstructure from SMAW generates larger grain sizes together with localized phase transformations mainly through martensite formation, resulting in local breakdown points at ferrite-rich areas. Pitting and crevice corrosion occur because of localized behavior, which leads to increased initial corrosion rates in SMAW-welded joints. SMAW produces metal joints with multiple structures that create potential locations for localized corrosion because ferrite forms along with nonuniform phase distributions. The pitting properties of ferrite make it react more quickly to corrosive exposure, thus resulting in faster corrosion starting rates than GMAW. GMAW produces a refined microstructure, which minimizes localized corrosion by creating homogenous material distributions that have lower chances of forming corrosion-susceptible phases. The rate of corrosion reduction for both processes decreases gradually, but GMAW demonstrates steeper initial slope changes. GMAW provides a consistent low corrosion rate after the initial stages, primarily because it creates a uniform microstructure in the material. SMAW produces an irregular microstructure that leads to a slower corrosion rate reduction because initial corrosion operates at higher levels. Environmental factors such as pitting and crevice corrosion tend to affect materials having localized defects one by one, since the material exhibits greater sensitivity to these external elements, particularly where grain sizes are coarse.
Both SMAW and GMAW specimens showed similar overall trends, i.e., an initial fast weight loss during the first hours following immersion, followed by a slow stabilization due to the formation of protective corrosion films. Nevertheless, GMAW specimens consistently showed better corrosion resistance than SMAW during the whole test duration. In the early exposure interval (first five hours), the GMAW samples showed a mass loss of 60.12 mg, which is almost double the mass loss measured with SMAW specimens (30.19 mg). The activation of microscale fresh interfaces causes this fast initial deprotonation. The corrosion rate for both processes reduced with the passage of time, reaching a constant value of about 3.53 g and 3.99 g after 81 h, suggesting the formation of passive protective layers and hence restraining metal dissolution. The higher performance of GMAW joints can be explained by their fine-grained bainitic and martensitic microstructure, which contributes to phase stability and reduces galvanic activity between adjacent areas. In contrast, SMAW welds have regions that are heterogeneous mixtures of ferritic and martensitic phases, with localized attack occurring preferably at fusion-line defects and at the CGBs, where the onset of pitting happens easily.
Weight loss distributions, which were determined at different positions in the weld (weld initiation, middle of the weld strand, and weld termination), were similar; the greatest loss occurred in the initiation region, followed by the mid-weld strand, and the lowest weight loss occurred at the termination region. Such variations are related to localized differences in heat input and in rate of cooling throughout the weld bead, and zones of ferrite with a higher concentration near the initiation point have an increased susceptibility to corrosion. Overall, the corrosion rate values corroborated a decreased steady rate of corrosion in GMAW (8.31 mm/year) in comparison with SMAW (8.73 mm/year), which were in good consonance with the microstructural observations. This shows that the refined and uniform microstructure produced by GMAW (including that facilitated by efficient shielding gas and controlled thermal cycles) correlates proportionally with the developed corrosion resistance over the course, ferrite-bearing structures produced by SMAW.
The research examines alloy steel weld joint corrosion resistance using GMAW as well as SMAW welding techniques. GMAW welding produces superior corrosion resistance because its rapid cooling process and consistent microstructure surpass those of SMAW. The research results can be listed as below:
The main novelty in this article is the integrated evaluation of mechanical, microstructural, and corrosion properties of ASTM A516 Grade 70 steel performed under carefully controlled but industrially relevant values of the heat inputs in GMAW and SMAW processes. Prior studies have been largely focused on stainless or duplex steels or on individual performance measures (e.g., tensile strength, corrosion rate), while, in contrast, the current study develops a holistic correlation between metallurgical changes, heat input, and service performance in the case of pressure vessel grade carbon steel. This research, unlike earlier studies on heat input and alternative alloy systems (for example, Lu et al. [2]; Mohammed et al. [3]; Unnikrishnan et al. [9]) on heat-affected zone outcomes, establishes the direct control of fusion-zone solidification together with heat-affected zone width on the refinement of material grain structure and phase formation in the weld of the ASTM A516 grade. Furthermore, the corrosion testing in ferric chloride solution for 81 hr under the ASTM G48 conditions provides a good comparative dataset not previously reported for such a material-process combination. Consequently, the study arrives at novel results on how to optimize industrial welding of pressure vessel steels through evidence that GMAW welding performance can be improved during transient heat flow by the mechanical homogeneity in the weld. These results may be helpful to establish not only the choice of the parameters, but also the post-weld quality evaluation criteria for engineering applications in petrochemical and marine environments where ASTM A516 steels are widely used.
[1] Sitorus, M.B.H. (2021). Effect of welding heat input on the corrosion rate of carbon steel MMA welding. International Journal of Innovation in Mechanical Engineering and Advanced Materials, 3(1): 26-31.
[2] Lu, Y., Jing, H., Han, Y., Xu, L. (2016). Effect of welding heat input on the corrosion resistance of carbon steel weld metal. Journal of Materials Engineering and Performance, 25(2): 565-576. https://doi.org/10.1007/s11665-015-1815-4
[3] Mohammed, G.R., Ishak, M., Aqida, S.N., Abdulhadi, H.A. (2017). Effects of heat input on microstructure, corrosion and mechanical characteristics of welded austenitic and duplex stainless steels: A review. Metals, 7(2): 39. https://doi.org/10.3390/met7020039
[4] Yousefieh, M., Shamanian, M., Saatchi, A. (2011). Influence of heat input in pulsed current GTAW process on microstructure and corrosion resistance of duplex stainless steel welds. Journal of Iron and Steel Research, International, 18(9): 65-69. https://doi.org/10.1016/S1006-706X(12)60036-3
[5] Nowacki, J., Rybicki, P., Piastow, A. (2007). Corrosion resistance of SAW duplex joints welded with high heat input. Journal of Achievements in Materials and Manufacturing Engineering, 23(2): 7-14.
[6] Zhang, J., Hu, K., Zhao, J., Duan, S., Zhan, X. (2022). Effect of heat input on microstructure and corrosion resistance in heat affected zone of 304 stainless steel joint by laser welding. Materials Today Communications, 30: 103054. https://doi.org/10.1016/j.mtcomm.2021.103054
[7] Wang, H.S. (2005). Effect of welding variables on cooling rate and pitting corrosion resistance in super duplex stainless weldments. Materials Transactions, 46(3): 593-601. https://doi.org/10.2320/matertrans.46.593
[8] Verma, J., Taiwade, R.V. (2017). Effect of welding processes and conditions on the microstructure, mechanical properties and corrosion resistance of duplex stainless steel weldments—A review. Journal of Manufacturing Processes, 25: 134-152. https://doi.org/10.1016/j.jmapro.2016.11.003
[9] Unnikrishnan, R., Idury, K.S., Ismail, T.P., Bhadauria, A., Shekhawat, S.K., Khatirkar, R.K., Sapate, S.G. (2014). Effect of heat input on the microstructure, residual stresses and corrosion resistance of 304L austenitic stainless steel weldments. Materials Characterization, 93: 10-23. https://doi.org/10.1016/j.matchar.2014.03.013
[10] Yan, C., Jiang, X., Zhou, Q., Zhang, K., Zhao, L., Wang, B. (2023). Microstructure and properties of laser-MIG hybrid welded X80 and X100 steel dissimilar joint. Transactions of The China Welding Institution, 44(1): 20-26. https://doi.org/10.12073/j.hjxb.20220202001
[11] Wang, J., Ma, J., Liu, Y., Zhang, T., Wu, S., Sun, Q. (2020). Influence of heat input on microstructure and corrosion resistance of underwater wet-welded E40 steel joints. Journal of Materials Engineering and Performance, 29(11): 6987-6996. https://doi.org/10.1007/s11665-020-05160-7
[12] Saha, M.K., Mondal, A., Hazra, R., Das, S. (2019). Influence of heat input on corrosion resistance of duplex stainless steel cladding on low-alloy steel by FCAW. In Advances in Micro and Nano Manufacturing and Surface Engineering: Proceedings of AIMTDR 2018, pp. 571-581. https://doi.org/10.1007/978-981-32-9425-7_51
[13] Drosos, K.I.M.O.N., Kotsakis, S. (2014). Influence of welding parameters on weld quality and productivity using metal cored wires. Doctoral dissertation, Master Thesis, Chalmers University of Technology, Gothenburg.
[14] Ebrahimi, A., Babu, A., Kleijn, C.R., Hermans, M.J., Richardson, I.M. (2021). The effect of groove shape on molten metal flow behaviour in gas metal arc welding. Materials, 14(23): 7444. https://doi.org/10.3390/ma14237444
[15] Dauod, D.S., Wade, K.J., Mohammed, M.S., Majdi, H.S. (2024). Analysis of shielding gases influences 304 gas metal arc welding microstructure, weld geometry, and mechanical properties. Revue des Composites et des Materiaux Avances, 34(4): 435. https://doi.org/10.18280/rcma.340405
[16] Kou, S. (1987). Welding Metallurgy. New York.
[17] Lippold, J.C., Kotecki, D.J. (2005). Welding Metallurgy and Weldability of Stainless Steel. New York: Willer Inder Science Publication.
[18] Nilsson, J.O. (1992). Super duplex stainless steels. Materials Science and Technology, 8(8): 685-700. https://doi.org/10.1179/mst.1992.8.8.685
[19] Liu, Y., Dong, D., Han, Z., Yang, Z., Wang, L., Dong, Q. (2018). Microstructure and strain rate-dependent tensile deformation behavior of fiber laser-welded butt joints of dual-phase steels. Journal of Materials Engineering and Performance, 27(5): 2148-2165. https://doi.org/10.1007/s11665-018-3295-9
[20] Muthupandi, V., Srinivasan, P.B., Seshadri, S.K., Sundaresan, S. (2003). Effect of weld metal chemistry and heat input on the structure and properties of duplex stainless steel welds. Materials Science and Engineering: A, 358(1-2): 9-16. https://doi.org/10.1016/S0921-5093(03)00077-7
[21] Alkhafaji, M.M., Mohammed, M.S., Amin, S.A., Habeeb, L.J., Majdi, H.S. (2025). Electrodes type effects on welding of copper to 304 stainless steel and analysis of heat distribution, microstructures, and mechanical properties. International Journal of Computational Methods and Experimental Measurements, 13(1): 85-96. https://doi.org/10.18280/ijcmem.130109
[22] Hamdey, M.D., Mohammed, M.S., Kareem, A.H., Majdi, H.S. (2024). Thermal and mechanical analysis in joint welding of thick steel alloy plates with and without backing plate. Journal of Engineering Science and Technology, 19(5): 1974-1989.
[23] Hu, Z., Hua, L., Qin, X., Ni, M., Ji, F., Wu, M. (2021). Molten pool behaviors and forming appearance of robotic GMAW on complex surface with various welding positions. Journal of Manufacturing Processes, 64: 1359-1376. https://doi.org/10.1016/j.jmapro.2021.02.061
[24] Zargari, H.H., Ito, K., Kumar, M., Sharma, A. (2020). Visualizing the vibration effect on the tandem-pulsed gas metal arc welding in the presence of surface tension active elements. International Journal of Heat and Mass Transfer, 161: 120310. https://doi.org/10.1016/j.ijheatmasstransfer.2020.120310
[25] Mohammed, M.S., Hamdey, M.D., Kareem, A.H., Majdi, H.S. (2024). Investigation of copper backing plate effects in stainless steel welding distortion, heat distribution, and residual stress. International Journal of Heat and Technology, 42(4): 1434. https://doi.org/10.18280/ijht.420433
[26] Ebrahimi, A., Kleijn, C.R., Hermans, M.J., Richardson, I.M. (2021). The effects of process parameters on melt-pool oscillatory behaviour in gas tungsten arc welding. Journal of Physics D: Applied Physics, 54(27): 275303. https://doi.org/10.1088/1361-6463/abf808
[27] Wu, F., Flint, T.F., Falch, K.V., Smith, M.C., Drakopoulos, M., Mirihanage, W. (2021). Mapping flow evolution in gas tungsten arc weld pools. International Journal of Heat and Mass Transfer, 179: 121679. https://doi.org/10.1016/j.ijheatmasstransfer.2021.121679
[28] Wu, F., Falch, K.V., Guo, D., English, P., Drakopoulos, M., Mirihanage, W. (2020). Time evolved force domination in arc weld pools. Materials and Design, 190: 108534. https://doi.org/10.1016/j.matdes.2020.108534
[29] Zhang, G., Goett, G., Uhrlandt, D., Lozano, P., Sharma, R. (2020). A simplified voltage model in GMAW. Welding in the World, 64(9): 1625-1634. https://doi.org/10.1007/s40194-020-00943-x
[30] Xu, B., Chen, S., Tashiro, S., Jiang, F., Tanaka, M. (2020). Material flow analyses of high-efficiency joint process in VPPA keyhole flat welding by X-ray transmission system. Journal of Cleaner Production, 250: 119450. https://doi.org/10.1016/j.jclepro.2019.119450
[31] Ding, K., Wu, T., Dong, W., Hu, T., Li, S., et al. (2023). Clarification of the ferrite formed in the laser welded joint of the Al–Si coated press-hardened steel. Journal of Materials Research and Technology, 23: 5880-5891. https://doi.org/10.1016/j.jmrt.2023.02.185
[32] Deen, K.M., Zang, A., Uddin, M.H., Farooq, A., Asselin, E. (2025). Evaluating the structural and corrosion performance of a steel welded joint produced via submerged arc welding. Journal of Alloys and Compounds Communications, 6: 100074. https://doi.org/10.1016/j.jacomc.2025.100074
[33] Khamari, B.K., Dash, S.S., Karak, S.K., Biswal, B.B. (2020). Effect of welding parameters on mechanical and microstructural properties of GMAW and SMAW mild steel joints. Ironmaking and Steelmaking, 47(8): 844-851. https://doi.org/10.1080/03019233.2019.1623592
[34] Xiong, J., Liu, S., Zhang, G. (2015). Thermal cycle and microstructure of backing weld in double-sided TIG arc horizontal welding of high-strength steel thick plate. The International Journal of Advanced Manufacturing Technology, 81(9): 1939-1947. https://doi.org/10.1007/s00170-015-7248-2
[35] Mehta, H.R. (2015). Analyzing effects of weld parameters for increasing the strength of welded joint on mild steel material by using the TIG welding process. International Journal of Science Technology and Engineering, 2(12): 480-483.
[36] Ogundimu, E.O., Akinlabi, E.T., Erinosho, M.F. (2019). Comparative study between TIG and MIG welding processes. Journal of Physics: Conference Series, 1378(2): 022074. https://doi.org/10.1088/1742-6596/1378/2/022074
[37] Kulkarni, B., Pankade, S. (2023). Comparative Study of Corrosion, Mechanical and Electrical Characteristics of Tungsten Inert Gas and Friction Stir Welded Joints. Springer Science and Business Media LLC. https://doi.org/10.21203/rs.3.rs-2646289/v1
[38] Beg, A., Alam, M. (2020). Comparison of mechanical properties and heat affected zone of 304stainless steel of joints by tig welding and electric arc welding. International Journal for Research in Application Science and Engineering Technology, 8(10): 311-317.
[39] Kessal, B.A., Fares, C., Meliani, M.H., Alhussein, A., Bouledroua, O., François, M. (2020). Effect of gas tungsten arc welding parameters on the corrosion resistance and the residual stress of heat affected zone. Engineering Failure Analysis, 107: 104200. https://doi.org/10.1016/j.engfailanal.2019.104200
[40] Nathan, S.R., Balasubramanian, V., Malarvizhi, S., Rao, A.G. (2015). Effect of welding processes on mechanical and microstructural characteristics of high strength low alloy naval grade steel joints. Defence Technology, 11(3): 308-317. https://doi.org/10.1016/j.dt.2015.06.001