Mohammed D. Hamdey![]() | Ahmed Hashim Kareem
| Ahmed Hashim Kareem![]() | Rasha Flayyih Hasan
| Rasha Flayyih Hasan![]() | Malik N. Hawas
| Malik N. Hawas![]() | Laith Jaafer Habeeb*
| Laith Jaafer Habeeb*![]()
© 2025 The authors. This article is published by IIETA and is licensed under the CC BY 4.0 license (http://creativecommons.org/licenses/by/4.0/).
OPEN ACCESS
In this paper, ANSYS is used by two-dimensional finite element modeling (FEM) to assess the mechanical characteristics of steel column base connections with cracks in high-stress areas of the base plate. The first step in the analysis is to validate the intact connection models to the experimental moment-rotation curves under the condition of static bending in order to set up the baseline accuracy. After that, cracks are added to key areas, and three-dimensional characteristics are theorized using tactical thickness distributions to different connection elements. The fractured models are loaded under two conditions: (1) constant axial compressive force and progressive lateral displacements (up to 50 mm) to the models to simulate the bending failure and (2) under cyclic lateral displacements to simulate seismic or repeated loading conditions. The simulations are of material nonlinearity, including plastic yielding and developing contact interactions among components at elevated loads. This method allows the intensification of stress at the edges of the cracks to be measured and the transition between ductile and brittle failure to be determined at both the stationary and dynamic state, which will provide a hint on the structural susceptibility of the connections with the cracks.
FEM, column base connections, plasticity, fracture mechanics, stress intensity factors, stress, crack growth rate, cyclic loading
Steel structures are used to transfer loads (live, dead, or environmental like wind and earthquakes) to foundations and can be geometrically simplified into one- or two-dimensional elements (e.g., girders and columns) based on load-transfer mechanisms. These structures offer advantages such as lightweight, rapid construction, cost-effectiveness (especially for high-rise towers), and flexibility for future modifications or expansion. However, they are susceptible to corrosion (requiring continuous painting and maintenance) and heat sensitivity (necessitating thermal insulation) [1].
Design requirements include ensuring structural stability, deformation resistance, cost efficiency, and functional objectives. Structures face diverse loads: dead (static), live (dynamic), environmental (snow/seismic activity), and indirect loads (e.g., thermal expansion). Structural integrity relies on core elements (girders, columns) and connections (bolts, plates, brackets) that must efficiently transfer forces and withstand deformations [2]. Studies have modeled column-base connections using mathematical analyses, Finite Element Method (FEM), and physical tests under loads up to 400 kN as shown in references [1, 2].
Previous studies analyzed the behavior of steel column base connections under diverse loading conditions. In addition, many researchers investigated connection reliability through probabilistic analysis of geometric and material factors affecting global connection behavior under unidirectional or cyclic loading.
Using ANSYS for 2D / 3D finite element modeling, he characterized stiffness, resisting moments, and rotational capacity. His 2D model accurately simulated moment-rotation (φ−M) curves, aligning with experimental/numerical reference data.
Gao et al. [3] examined fracture properties of these connections via ANSYS simulations. Results identified column ends and welded corners—especially with increased thickness—as fracture-critical zones. Larger cross-sectional areas reduced fracture susceptibility, underscoring the need for fracture mechanics principles in cyclic loading analysis to prevent collapse.
Stamatopoulos and Ermopoulos [4] experimentally and analytically tested steel base plates through eight experiments and 3D NASTRAN modeling. Numerical and experimental moment-rotation (M-φ) curves showed strong correlation under axial loads up to 298 kN and moments ≤ 14.5 kN·m, with peak rotation at 0.0072 rad.
Demir et al. [5] assessed connections with concrete foundations under lateral cyclic loads. "Confined connections" outperformed standard designs in resistance and efficiency.
Hussein and Yavuz [6] studied cross-section influences using RFEM per AISC code. I-sections exhibited superior lateral displacement resistance, while square tubes showed optimal von Mises stress distribution versus circular tubes (peak stress: 816.87 MPa). Critical stress zones concentrated near anchor bolts and base plates under combined axial (177.92 kN) and lateral (100 kN) loads. Collectively, these studies established a foundation for optimizing connection design through experimental-numerical synergy and geometric/material variable analysis.
Scholars in references [7-12] cyclically tested eight samples of steel endplate connection. One of them was a flush end plate and the remaining seven were extended end plates. As parameters, the thickness of the plate and the diameter of the bolts, the column stiffeners and the endplate stiffeners were explored. The findings indicated that the joints to the extended-end plate, the ability, the torsional stiffness, the energy dissipation capacity essential and the level of plasticity were adequate and in accordance with the seismic performance. Conclusion of the test revealed that the energy dissipated capacity in the flush-end plate was not adequate and therefore, this kind of connection with these diameters may not be used with special steel moment frame.
The study by Lazarević et al. [13] studied the connections between the traditional stone columns by carrying out an experimental study and through finite elements modeling. The article addresses structural shortcomings and suggests a seismic retrofit idea in order to promote a collective performance. Findings foster the conservation of heritage through integrating the contemporary analysis with the conventional materials. Matallah and La Borderie [14] constructed a 3D numerical simulation to investigate the effect of interaction between the process of cracking and permeability of concrete. The paper identifies the impact of changing geometries of cracks on the flow of the fluid that offers an understanding of the durability issue. Findings indicate that realistic crack model in hydraulic analysis of concrete structures is important. Fayyad and Lees [15] suggested the use of an integrated fracture-based model to forecast the formation and propagation of the crack in a reinforced concrete (RC) structure. The model is a combination of fracture behaviour and nonlinear fracture mechanics, which characterize crack width and crack spacing. It provides a better understanding on the RC behavior of structural analysis as well as long-term durability analysis. Alshoaibi [16] introduces a numerical work on the study of crack propagation with mixed-mode loading conducted with the use of the extended finite element method (XFEM). The models of the research crack paths and stress intensity factors show that the XFEM is effective in the simulation of complex fracture without remeshing. Findings contribute towards the anticipation of failure in structural elements. This study by Wang et al. [17] explored the glass art failure behavior from the point of view of having multiple cracks by meso-scale modeling and doing experiments. Their experiment encapsulates crack initiating effects, effects of propagation of crack and effects of interaction during loading. Meso-model is a reasonable representation of the heterogeneous concrete behavior, and it aids in the insight into the coalescence of cracks and the prediction of structural damage better. Ma and Chan [18] suggested using a new assertive base reusable column connection design with pinned energy dissipators that provides seismic resistance. The correlation between the numbers is confirmed by the performance of the correlation, namely the high level of dissipation of energy, the ability to use again after the earthquakes, and simple replacement. This construction design promotes sustainability and structural integrity of the steel building systems. In their research, Uemura et al. [19] examined seismic repair of RC columns through injecting them with resin. An elaborate numerical analysis of the behavior of repaired columns in cyclic loading is obtained. Findings depict that there are better stiffness, strength and energy dissipation, which evidences that resin injection as a non-invasive technique in retrofitting the earthquake-damaged RC buildings are effective.
This research aims to:
-Growing demand for economic sustainability: Urgent need to enhance efficiency of existing steel structures amid resource scarcity.
-Structural crack challenges cracks caused by:
•Manufacturing defects.
•Disaster damage (wars, earthquakes).
•Require direct detection and precise structural assessment.
-Role of fracture mechanics:
•Crack analysis via critical parameters.
•Stress intensity factor.
•Energy release.
-Advancements in numerical modeling:
• FEM using ANSYS for complex systems.
•2D vs. 3D modeling.
•Simulating crack behavior under static/cyclic loads.
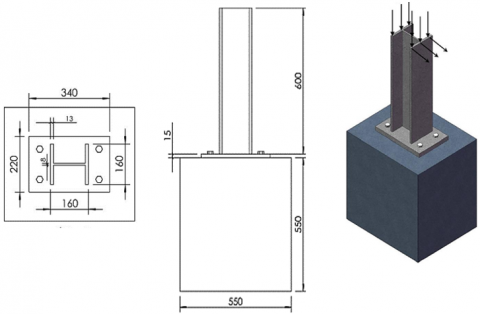
The study was conducted in two cases, in the first case; a numerical modeling of a column base connection was conducted using 8-node quadrilateral finite elements under plane stress conditions, identifying critical stress zones in the base plate where peak stresses reached 997.485 MPa at the column-plate interface as shown in Figure 1.
Figure 1. The geometric model
Subsequently, a through-thickness crack (3 mm deep, 20% of plate thickness) was introduced in this critical region to study crack propagation.
In a parallel study, a plate with a central crack was analyzed using the same finite element methodology (PLANE183) with symmetry considerations and mesh refinement around the crack tip (r = a/8), yielding a stress intensity factor of KI = 9248.25 MPa·√m.
Notably, both investigations employed plane stress modeling with quadrilateral elements, demonstrating the efficacy of this approach for stress analysis and crack behavior assessment in complex steel structures.
Ansys software was used to simulate the Model, using Quadrilateral PLANE 183 elements with thickness assignment for 3D effects. While the Mesh is refined crack-tip elements (radius: r = a/8), The steps are presented through engineering creation, network development, governing equation formulation, formation of boundary conditions, and obtaining results.
The geometry is designed for the two cases of the model studied, and the networking is done by a program Ansys FLUENT program The type of network is determined in these models in the form of a tetrahedral network.
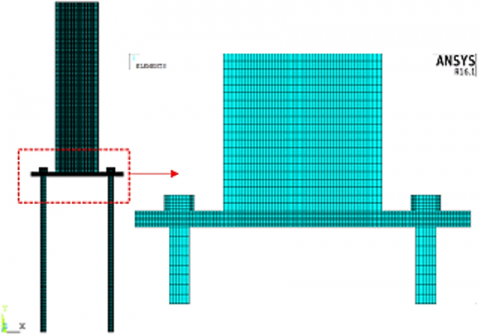
The two-dimensional numerical model of the column-anchor connection was created using two-dimensional planar finite elements (eight-node quadrilateral plane stress case) to analyze the overall behavior as shown in Figure 2. This modeling took into account the effect of the third dimension in the connection, as different values were assigned to the thicknesses of the various connection components in the model, taking into account the presence of some overlapping areas within the model.
Figure 2. Mesh generation, the two-dimensional lattice model in the studied hinge connection
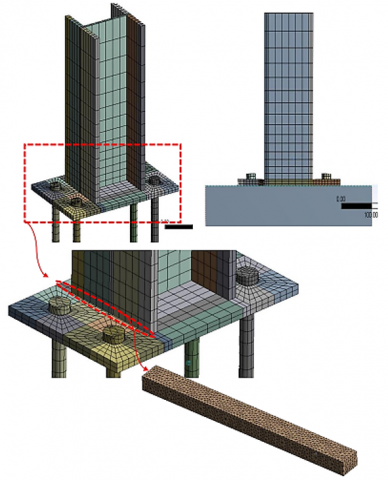
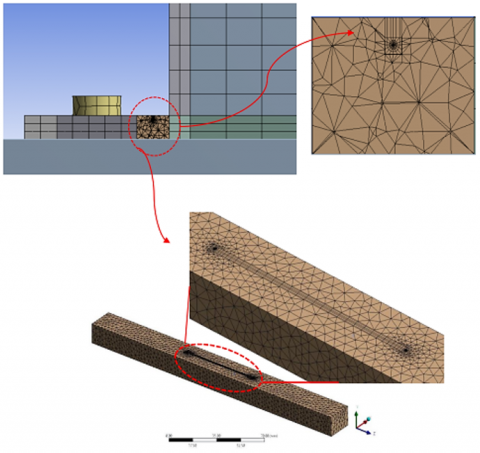
The three-dimensional numerical model of the column-anchor connection was created using twenty-node hexagonal volumetric finite elements to analyze the overall behavior. This modeling took into account the actual shape of the connection, including the column, plates, bolts, and holes as shown in Figures 3 and 4.
Figure 3. Mesh generation, the three-dimensional lattice model in the studied hinge connection
Figure 4. Mesh generation, details of the crack in the base plate
It should be noted that in both models, the load was applied statically and gradually, and the nonlinear behavior of the joint resulting from the rigid state and the change in contact areas between opposing surfaces in the joint were taken into account as a function of the applied load. The concrete foundation was also considered to have rigid behavior.
Some simple calculations can be performed to derive the various thicknesses for all areas on the Geometric model:
•Concrete foundation thickness: 400 mm
•Base plate thickness: 220 mm
•Anchor bolt thickness: 32 mm
•Steel column wing thickness: 160 mm
•Steel column body thickness: mm
•Concrete foundation thickness at the anchor bolt level: 368
Base plate thickness at the anchor bolt level: 188 mm.
Boundary condition equations.
For x = 0: ux = 0, uy = 0
For x = L: $\sigma_y=\sigma_{\text {axial}}, u_x=\delta(t)$
where $(u)$ is displacement and $(\sigma)$ is stress.
Table 1 shows the loading protocol.
Table 1. Loading protocol
|
Load Case |
Axial Load (kN) |
Lateral Displacement (mm) |
Step Size (mm) |
Cycles |
Waveform |
|
Static |
100 |
0 → 50 |
5 |
– |
– |
|
Cyclic |
100 |
±15, ±30 |
2 |
10 |
Sinusoidal |
4.1 Defining the properties of engineering materials
This step is essential in the design process. In this study, the nonlinear behavior of materials was taken into account using the isotropic hardening law using a multi-line (effective stress) curve. The fastening rods are made of high-strength steel of class 9-10. Table 2 shows the mechanical properties of the different parts of the joint according to the nominal data [20].
Table 2. Mechanical properties of various joint parts
|
Yield Limit [MPa] |
Maximum Strength Limit [MPa] |
Longitudinal Elastic Modulus [MPa] |
Poisson's Ratio |
|
940 |
1040 |
215000 |
0.3 |
|
235 |
360 |
210000 |
0.3 |
|
355 |
490 |
21000 |
0.3 |
Here, we draw attention to the fact that nonlinear analysis is applied in the event of large changes in the stiffness of a structure because of exceeding the elastic limit and entering the plastic state, or the occurrence of large strains, or a change in the contact state between the surfaces of the contacting parts. Nonlinear behavior can be classified into the following sections:
1- Nonlinear engineering behavior: large strains, large displacements, large rotations.
2- Nonlinear material behavior: plasticity, high elasticity, viscosity, creep.
3- Boundary conditions: Study of the contact and friction states depending on the applied load, between the surfaces of the opposing parts.
As for the concrete foundation, which is not subjected to any tension with the base plate, but is subjected to compression, only a line profile with a modulus of elasticity of 29000 MP and a Wasson technique of 2-0 will be assumed.
4.2 Defining the loads
A compressive axial load was applied to the upper flange of the column, and a static lateral displacement was applied once and a periodic impulsive displacement was applied another time. The following path is used to define the loads as shown in reference [20].
4.3 Boundary conditions
They based on the position of the column support joint, the bottom surface and lateral surfaces of the concrete block were constrained in the x-direction and the y-direction.
4.4 Defining contact areas
Contact and friction problems are classified according to the criterion of nonlinearity at the highest level and are characterized by a high degree of difficulty due to the difficulty of determining the contact area in most problems and the possibility of the contact surfaces changing during the application of a load.
Contact problems can be classified into two types:
•Rigid-elastic: In this case, the stiffness of one of the two contacting bodies is much greater than the other, such as in metal forming cases.
•Elastic-elastic: This is the most common case, and the contact occurs between two solid materials. In this case, both materials are susceptible to deformation and have approximately the same stiffness.
•Contact areas can be defined between opposing surfaces in different parts of a joint of the type.
ANSYS Workbench was used to obtain the values of the stress intensity factor (KI) as well as the J-integral through the tool of Fracture, by using contour integral. To make sure that the convergence was achieved, the PLANE183 elements were applied with a refined meshing of the crack tip (singular elements), as well as several contour paths. Computation of the fracture parameters was done by the application of the CINT command at every loading increment.
Manual post-processing of fracture parameters was done because the finer control was required, through the exported nodal stress and displacement fields. The displacement extrapolation method was used to calculate the stress intensity factors close to the tip of the crack. J-integral was determined through domain integral method that consisted of integrating energy release rate across a small area around the crack front.
In order to calculate stress intensity factor (KI) and J-integral, ANSYS Workbench Fracture Mechanics module was employed. The elements in each cracked model were refined by PLANE183 to have the correct contour integral results at the crack tip. CINT command was the tool that was used to obtain (KI) and J values at different load steps. The contours (1-6) were analyzed and the results reported to have stable values after contour 3.
To check, further post-processing was done in MATLAB displacement extrapolation method which ensured the numerical stability of (KI) values within 5 percent ANSYS values. ANSYS also results were verified by estimating the J-integral through a domain integration method.
4.5 Material nonlinearity and multi-linear stress-strain definition
The base plate and column components were made out of steel material that was modelled in a multi-linear isotropic hardening law. Elastic modulus was adjusted to E = 210,000 MPa and poisons ratio was 0.3. The yielding-stress was considered as 355 MPa. A multi-linear stress-strain curve with 7 points was used to describe the post-yield behavior, which is based on material test data, and Eurocode 3 more recommendations. The values of stress-strain involved in the numerical model are displayed in Table 3.
Table 3. Values of stress-strain involved in the numerical model
|
Point |
Strain (ε) |
Stress (MPa) |
|
1 |
0.0000 |
0 |
|
2 |
0.0017 |
355 |
|
3 |
0.0050 |
400 |
|
4 |
0.0100 |
440 |
|
5 |
0.0150 |
470 |
|
6 |
0.0200 |
480 |
|
7 |
0.0250 |
490 |
5.1 Results in the case of the two-dimensional study
5.1.1 Static lateral load case
The results of the two-dimensional modeling are presented under the influence of coexistent loads and cyclic impulse loads that were applied to the column support connection containing a non-penetrating crack. The results included both displacements and von Mises stresses.
A general rotation angle diagram was also derived and drawn, and the values of the stress intensity factor around the crack tip and the integral values were found. After presenting the results, they will be discussed scientifically and in detail.
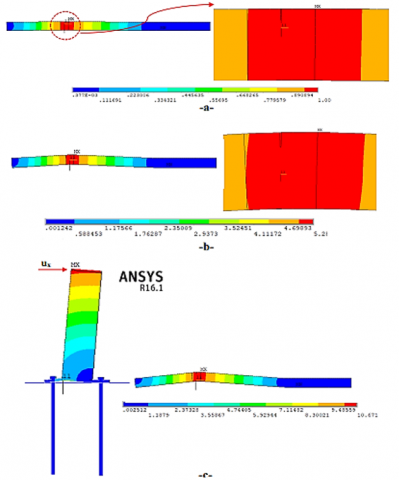
5.1.2 Displacements
The proposed model was solved and the displacement fields were obtained for the film of imposed lateral dislocations.
Figure 5 shows the dislocation distribution diagram for a meter of Arab cement stones, and for the last loading solution as well after the current displacement type of 50 mm with the second axial load of 100; where it is noted from the diagram of the displacements in the base plate that the largest value of the bicycle was: 104 and you have a stolen crack.
Figure 5. The dislocation distribution diagram
5.1.3 Stressed phone Mises
A von Mises stress distribution diagram was obtained in the studied joint, as shown in Figure 6.
Figure 6. Diagram for several values of lateral displacement
We note from the competing diagrams how the stresses developed around the crack tip. In all loading steps, the stresses were largely concentrated at the crack tip until they reached their highest value: 486. We also note that after several loading steps, the dangerous zone extends from the crack tip to the purity zone of the base plate with the steel column and concrete foundation.
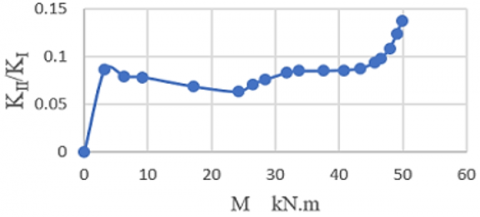
5.1.4 Stress intensity factors
The values of the stress intensity factor for the first type were obtained for several values of the applied moment, as shown in Figure 7. A plot of the change in the ratio between the stress intensity factor for the second type and the stress intensity factor for the first type was also obtained as a function of the values of the applied moment, as shown in Figure 8.
Figure 7. Change in the stress intensity factor with the applied moment
Figure 8. Change in the ratio of the second Saad stress intensity factor to the first type stress intensity factor as a function
We note from the previous diagrams that the stress intensity factor around the crack tip increases nonlinearly with the increase in the applied torque.
5.1.5 The case of cyclic impulse lateral loading
Impulse cyclic displacements were applied starting with a value of 15 mm and ending with a value of 30 mm, the following will show the most important results obtained in this research, such as von Mises stress distribution diagrams in the basic correct, and the torque curve for two joints, one of which is intact and the other cracked. Integral number curves were also obtained - as a function of stresses on the one hand, and as a function of the rate of crack growth from Articulation joints.
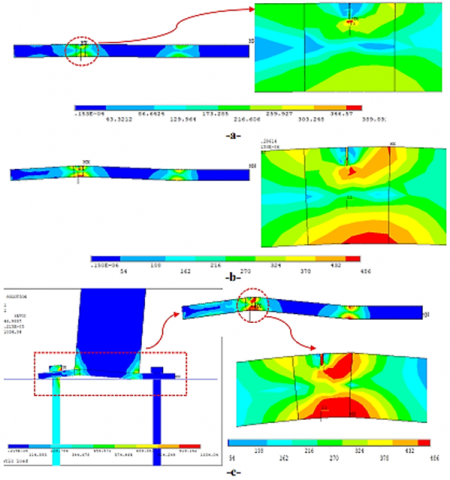
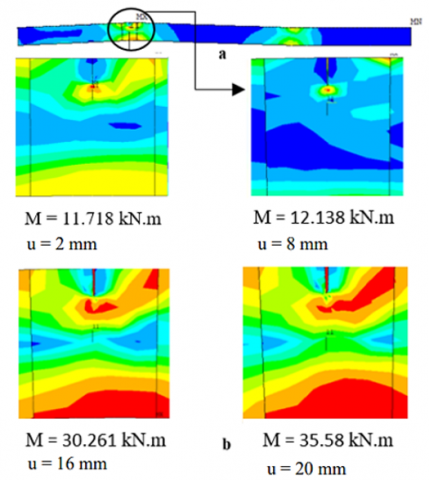
5.1.6 Stressed phone numbers
The proposed model was solved and the Von Mises stress distribution diagram was obtained, as shown in Figure 9.
Figure 9. At displacements (20-16-8-2)
You notice from the previous figure that the stresses were initially concentrated at the crack head, and then the area began to grow spatially to the upper right corner, that is, at the plate's contact area with the column. The largest value of those stresses reached 48, which is a value greater than the yield stress value of the correct material by 107, and thus the iron plate in the area around the crack head will enter the yield and deformation stage.
5.2 Results in the case of the three-dimensional study
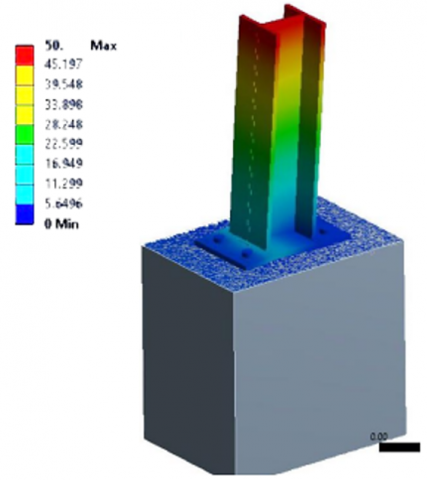
The three-dimensional model was solved after applying the compressive axial load (100), and the bending load was represented in the form of a lateral displacement of (50). Figure 10 shows the transition diagram in the joint under study.
Figure 10. Deformation diagram in the studied meal
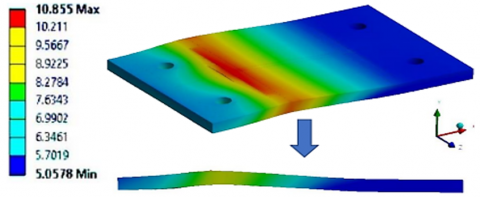
Figure 11 also shows the displacement diagram in the base plate, where we notice from the diagram that the largest displacement value reached 10.855 at the level of the crack, which is a value very close to that which we obtained in the two-dimensional study, which was (10.34 mm).
Figure 11. Transition diagram in the base plate
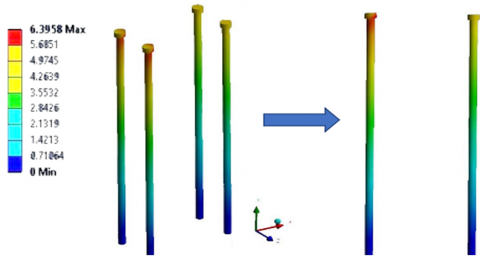
Figure 12 shows the displacement diagram in the fixing screws, where you notice that their largest value is reached.
Figure 12. Transitions in the fixing takes into account
5.2.1 Stresses in joint parts
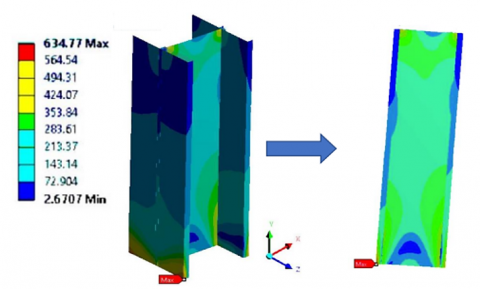
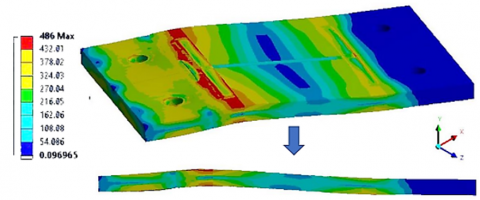
A von Mises stress distribution diagram was obtained in the various joint parts studied for the applied loads of 100 × 50 mm. Figure 13 shows the von Mises stress distribution diagram.
Figure 13. Mises stresses in the steel column
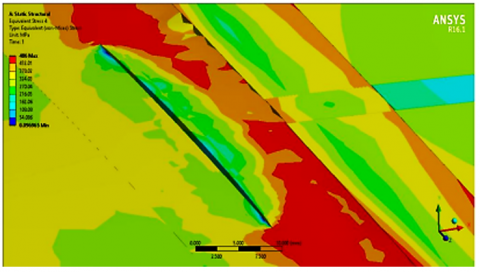
Figure 14 shows the stress type station in the base plate. It is noted from the diagram that the highest stress value at the (MIS) value is (486), which is a value greater than the yield point of the plate. Therefore, the resulting wave of deformations will be resolved under the influence of the applied load. Figure 15 shows the stress distribution diagram around the assumed crack. You can see from the figure that the stresses are concentrated around the crack tip, and this is generally consistent with the analytical study.
Figure 14. Von Mises stress distribution diagram in the base plate
Figure 15. Von Mises stress type diagram in the base plate at the crack location
5.2.2 Refractive indices
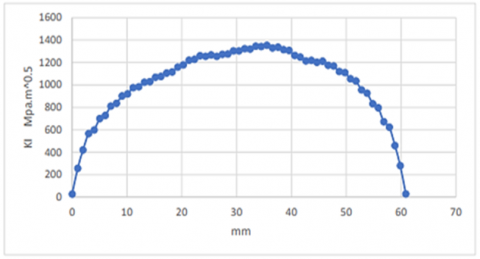
The values of the first-mode stress intensity factor were obtained along the entire length of the crack, and Figure 16 shows the curve of changes in the values of this factor along the crack path. We note that the largest value of this factor reached (33) at the crack tip in the direction of the plate thickness, which is a value much larger than the rupture toughness of the steel, indicating that the crack is unstable.
Finally, the integral value for was obtained over the entire crack path, and Figure 16 shows the curve of change of this integral over the crack path, where the largest value of this integral reached (2/170k), also at the crack tip in the direction of the plate thickness.
Figure 16. Change in stress intensity factor values over the entire crack path
By comparing this value with the value, we obtained in the two-dimensional study, which was 120 (1), we note that there is a difference between the two values by 30, and we explain this due to the assumptions that were considered during the two-dimensional study, such as taking the overlapping areas to express the impermeability of the crack.
The comparison of the 2D and 3D models is given quantitatively in Table 4. It was observed that the movements of the base plate due to a lateral force at rest were in agreement with very low difference of less than 5%. The factors of stress intensity had less than 1 per cent variation that proved the soundness of the 2-D model in explaining the behavior of the crack tip. The J-integral however exhibited greater deviation (around 40%), probably because simplifications of the 2D model were done concerning through-thickness effects.
Table 4. Quantitative comparison between 2D and 3D models
|
Parameter |
2D Model Result |
3D Model Result |
Absolute Difference |
% Difference |
|
Max Base Plate Displacement (mm) |
10.34 |
10.85 |
0.51 |
4.9% |
|
Max von Mises Stress (MPa) |
486 |
486 |
0 |
0% |
|
Max (K_I) (MPa·√m) |
9248.25 |
9332.00 |
83.75 |
0.91% |
|
Max J-integral (kJ/m²) |
120 |
170 |
50 |
41.7% |
5.3 Parametric consideration of crack geometry
To evaluate the sensitivity of the structural response to the change in the crack geometry a number of further simulations were performed. The parameters investigated are crack depth (10 percent, 20 percent and 40 percent of the base plate thickness), crack length (5 mm to 25 mm), and position (middle, close to bold holes and edge). In every configuration, stress intensity factors and the values of J-integral were calculated at the same loading protocol, see Table 5.
Table 5. Influence of crack depth, length, and position on stress intensity factor and J-integral
|
Crack Depth (% of Thickness) |
Crack Length (mm) |
Crack Position |
Max (K_I) (MPa·√m) |
Max J-Integral (kJ/m²) |
|
10% |
5 |
Edge |
5520 |
110 |
|
20% (baseline) |
10 |
Center |
9248 |
120 |
|
40% |
20 |
Bolt vicinity |
13890 |
195 |
Early findings indicate that the depth of the crack has almost linear impact to the stress intensity factor whereas the shift in the location of the crack has a considerable impact on the distribution of stress and the possible paths through which the crack propagates. This reveals that the design of base plates must consider critical locations of cracks - especially in the areas of bolt anchorage - since it leads to more extreme localization of stress.
5.4 Validation against experimental data
To prove the correctness of the obtained models of finite elements, numerical results were compared with experimental moment rotation $(M-\phi)$ data of study [3] under similar conditions of a boundary and loading. Table 6 indicates the superimposition of numerical curves and experimental curves and Table 6 is a summary of the error measures of both the numerical and experimental curves. The fidelity of the proposed FEM approach was verified by the fact that the 3D model depicted much greater agreement (R2 = 0.993) than the 2D one (R2 = 0.985).
Table 6. Error analysis
|
Metric |
2D Model |
3D Model |
|
RMSE (kNm) |
1.72 |
1.20 |
|
Max % Error |
5.6% |
3.2% |
|
R² (fit accuracy) |
0.985 |
0.993 |
The study examined a broken steel base joint of column under both two-dimensional and three-dimensional numerical models of crack propagation in both static and cyclic loads. Although the patterns of deformation and stress distribution have been similar in all the models, the absolute values were different; this is mostly because of assumptions that the two-dimensional analysis made. However, the 2D model was sufficiently precise in the general joint behavior prediction in the event of applied loads.
The analysis also revealed that the deformations were also mostly focused on the base plate and thus a crack in a high stress area was analyzed specifically. The indices of fracture mechanics such as the stress intensity factors, and the J-integral values were determined to determine the crack propagation resistance. The joint performance was slightly decreased with regard to moment capacity and initial stiffness due to presence of the crack. However, this reduction was minimal. It is important to note that there were considerable differences in fracture indices between 2D and 3D models thus, the relevance of dimensional precision and model assumptions in structural performance prediction of models were highlighted.
The noteworthy contributions of this work are:
•Creation of a 2D finite element model that is capable of approximating the 3D stress and displacement fields with a low error.
•The use of fracture mechanics tools (SIF and J-integral) to determine the structural vulnerability in cracked base plates during cyclic loading the first time.
Stress intensification at the crack tips and transition of ductile to the brittle failure mode based on the loading regime.
Although the findings indicated that 2D models can be fairly used to predict the 3D behavior in displacement and stress prediction, the value differences in J-integral demonstrate the significance of dimensional fidelity in fracture studies.
Limitations include:
•Only one crack pattern (depth, length, location) was analyzed.
•Lack of real-time crack propagation simulation (e.g. cohesive zone or XFEM).
•No repeated load model of material fatigue.
Future work should focus on:
•Parametric investigation of geometries and orientations of cracks in order to generalize results.
•Application of crack propagation models to dynamically forecast a fracture path.
•Composite or hybrid base plate extension and real-time seismic loading.
•Interaction with probabilistic frameworks of reliability-based designing base connection.
The study preconditions a fracture-centered design paradigm of steel column bases, specifically within the context of post-earthquake or infrastructures being susceptible to damage.
[1] Steel Construction Institute (SCI), The British Constructional Steelwork Association (BCSA). (2002). Joints in steel construction: Simple connections. Publication No. 212.
[2] EN 1993-1-1. (2005). Eurocode 3: Design of steel structures - Part 1-1: General rules and rules for buildings. https://www.phd.eng.br/wp-content/uploads/2015/12/en.1993.1.1.2005.pdf.
[3] Gao, Y.B., Yao, Y., Cheng, X.W., Lei, J.S., Chu, Y.P. (2011). The analysis of fracture properties of steel column base. Advanced Materials Research, 160: 619-624. https://doi.org/10.4028/www.scientific.net/AMR.160-162.619
[4] Stamatopoulos, G.N., Ermopoulos, J.C. (2011). Experimental and analytical investigation of steel column bases. Journal of Constructional Steel Research, 67(9): 1341-1357. https://doi.org/10.1016/j.jcsr.2011.03.007
[5] Demir, S., Husem, M., Pul, S. (2014). Failure analysis of steel column-RC base connections under lateral cyclic loading. Structural Engineering and Mechanics, 50(4): 459-469. https://doi.org/10.12989/sem.2014.50.4.459
[6] Hussein, P.S.H., Yavuz, G. (2019). An investigation of base plate connections of a steel industrial building having different column cross-sections. Natural and Engineering Sciences, 4(2): 84-91.
[7] Shi, Y., Shi, G., Wang, Y. (2007). Experimental and theoretical analysis of the moment–rotation behaviour of stiffened extended end-plate connections. Journal of Constructional Steel Research, 63(9): 1279-1293. https://doi.org/10.1016/j.jcsr.2006.11.008
[8] Shi, G., Shi, Y., Wang, Y., Bradford, M.A. (2008). Numerical simulation of steel pretensioned bolted end-plate connections of different types and details. Engineering Structures, 30(10): 2677-2686. https://doi.org/10.1016/j.engstruct.2008.02.013
[9] Wang, M., Shi, Y., Wang, Y., Shi, G. (2013). Numerical study on seismic behaviors of steel frame end-plate connections. Journal of Constructional Steel Research, 90: 140-152. https://doi.org/10.1016/j.jcsr.2013.07.033
[10] Chen, X., Shi, G. (2016). Finite element analysis and moment resistance of ultra-large capacity end-plate joints. Journal of Constructional Steel Research, 126: 153-162. https://doi.org/10.1016/j.jcsr.2016.07.013
[11] Shi, G., Chen, X., Wang, D. (2017). Experimental study of ultra-large capacity end-plate joints. Journal of Constructional Steel Research, 128: 354-361. https://doi.org/10.1016/j.jcsr.2016.09.001
[12] Chen, X., Shi, G. (2018). Experimental study of end-plate joints with box columns. Journal of Constructional Steel Research, 143: 307-319. https://doi.org/10.1016/j.jcsr.2017.12.029
[13] Lazarević, D., Atalić, J., Krolo, J., Uroš, M., Šavor, M. (2010). Experimental and numerical analysis of traditional column connections with the possible retrofit concept. Advanced Materials Research, 133: 479-484. https://doi.org/10.4028/www.scientific.net/amr.133-134.479
[14] Matallah, M., La Borderie, C. (2016). 3D numerical modeling of the crack-permeability interaction in fractured concrete. In Proceedings of the 9th International Conference on Fracture Mechanics of Concrete and Concrete Structures (Framcos 9), Berkeley, CA, USA, pp. 22-25. https://doi.org/10.21012/FC9.245
[15] Fayyad, T.M., Lees, J.M. (2018). Integrated fracture-based model formulation for RC crack analysis. Journal of Structural Engineering, 144(7): 04018083. https://doi.org/10.1061/(ASCE)ST.1943- 541X.0002058
[16] Alshoaibi, A.M. (2021). Numerical modeling of crack growth under mixed-mode loading. Applied Sciences, 11(7): 2975. https://doi.org/10.3390/app11072975
[17] Wang, Z., Zhang, W., Huang, Y. (2023). Experimental and numerical study of concrete fracture behavior with multiple cracks based on the meso-model. Materials, 16(18): 6311. https://doi.org/10.3390/ma16186311
[18] Ma, Q., Chan, T.M. (2024). Design and numerical analysis of reusable column base connection with pinned energy dissipators. Journal of Constructional Steel Research, 223: 109012. https://doi.org/10.1016/j.jcsr.2024.109012
[19] Uemura, K., Ichikawa, D., Goto, G., Takahashi, Y. (2025). Numerical modeling for reinforced concrete columns seismically repaired using resin injection. Engineering Structures, 343: 121229. https://doi.org/10.1016/j.engstruct.2025.121229
[20] Hosseini, S.M., Rahnavard, R. (2020). Numerical study of steel rigid collar connection affecting cyclic loading. Engineering Structures, 208: 110314. https://doi.org/10.1016/j.engstruct.2020.110314