Prasanna Sutar![]() | Ravi Sekhar*
| Ravi Sekhar*![]() | Sukrut Thipse
| Sukrut Thipse![]() | Sandeep Rairikar
| Sandeep Rairikar![]() | Shailesh Sonawane
| Shailesh Sonawane![]() | Debjyoti Bandyopadhyay
| Debjyoti Bandyopadhyay![]() | Rit Dhar
| Rit Dhar![]()
© 2025 The authors. This article is published by IIETA and is licensed under the CC BY 4.0 license (http://creativecommons.org/licenses/by/4.0/).
OPEN ACCESS
This study presents a multi-objective optimization of a six-cylinder, SI, Hydrogen-Enriched Compressed Natural Gas (HCNG) engine using an integrated Taguchi–CRITIC–GRA approach. Experiments were designed with an L9 orthogonal array to investigate the effects of engine load (50–100%), HCNG blend ratio (18–30% H2 v/v), and equivalence ratio (ϕ = 0.952–1.031) on brake mean effective pressure (BMEP), brake-specific fuel consumption (BSFC), CO, NOx, and non-methane hydrocarbons (NMHC). The CRITIC method was employed to objectively determine criteria weights from the statistical dispersion and correlation among responses. Grey Relational Analysis (GRA) was then used to compute the Grey Relational Grade (GRG), ranking each trial based on overall performance-emission synergy. The optimum parameters were Load = 100%, Blend = 30% H2, and ϕ = 0.952, yielding BMEP = 7.50 bar, BSFC = 211.33 g/kWh, NOx + NMHC = 66.30 ppm, and CO = 32.80 ppm. Compared to the baseline (Load = 50%, Blend = 18% H2, ϕ = 0.952), GRG improved from 0.08135 to 0.1216, an increase of 49.4%. The experimental GRG closely matched the predicted value (error ~2%), confirming model robustness. This integrated statistical framework demonstrated its capability for simultaneous optimization of complex, conflicting engine parameters, offering a transferable methodology for alternative-fuel engine research.
HCNG engine, Taguchi method, CRITIC, Grey Relational Analysis, multi-objective optimization, performance-emission trade-off
1.1 Purpose
The push for cleaner, more efficient car engines has brought alternative fuels like Hydrogen-Enriched Compressed Natural Gas (HCNG) into the spotlight as a practical stepping stone toward a greener future. HCNG blends hydrogen with compressed natural gas (CNG), combining their strengths to burn fuel faster, stretch efficiency in lean conditions, ignite quicker, and cut down on carbon emissions. This certainly makes HCNG a particularly great and practical fit for modern spark-ignition engines, especially in various areas and regions where CNG pumps are already common and widely accessible.
Because it addresses major problems, HCNG is important. It can help cut greenhouse gas emissions, clean up urban smog, and lessen our reliance on oil. Because of hydrogen's propensity for cleaner combustion, it emits significantly less carbon monoxide (CO), non-methane hydrocarbons (NMHC), and soot when burned. Even better, HCNG can work with renewable hydrogen, supporting global climate goals like the Paris Agreement and the UN’s Sustainable Development Goals [1]. That said, fine-tuning HCNG for multi-cylinder engines is no easy task—it requires clever adjustments to balance the tricky interplay between power and emissions in a dual-fuel system.
1.2 Inspiration
As the need for sustainable mobility and climate change prevention grows, the problem of optimizing HCNG engines has attracted attention. Proven advantages of HCNG include lower emissions, improved thermal efficiency, and efficient lean-burn operation. However, because combustion, performance, and emission characteristics interact, its use in multi-cylinder engines presents substantial optimization challenges.
Research has illuminated HCNG’s potential and challenges. Ma et al. [2] demonstrated that HCNG improves brake thermal efficiency and lowers CO and hydrocarbon emissions in spark-ignition engines, but higher hydrogen fractions increase nitrogen oxide (NOₓ) emissions. Yuce and Oral [3] explored multi-cylinder HCNG engines, highlighting how hydrogen content and equivalence ratio interact non-linearly to affect power and emissions. They also combined Taguchi, GRA, and CRITIC to optimize a single-cylinder spark-ignition engine, achieving notable improvements in brake-specific fuel consumption (BSFC) and emission trade-offs. Beyond HCNG, studies that applied the Taguchi-Grey Relational Analysis (GRA) method to optimize biodiesel engines were conducted by Lakshmi et al. [4], while García et al. [5] used similar techniques for dual-fuel diesel engines, though often with static or equal weights for multiple responses.
Karnwal et al. [6] used the CRITIC technique to get beyond these restrictions. This method improves the accuracy of GRA-based optimization by objectively allocating weights to engine responses based on variability and inter-criteria conflict. However, in multi-cylinder HCNG engines, where conventional optimization techniques are complicated by inter-cylinder variability, thermal dynamics, and transient behaviors, such approaches are still understudied.
Several studies in recent years have emphasized the growing role of advanced optimization methods in alternative-fuel engine research. Traditional statistical techniques such as Taguchi design and GRA have been widely used for performance-emission trade-offs in IC engines. However, with the rise of computational capabilities, researchers are increasingly exploring intelligent algorithms and machine learning models to supplement or replace conventional designs.
For example, Zareei and Rohani [7] applied machine learning models integrated with genetic algorithms to optimize performance parameters in hydrogen engines, highlighting the nonlinear complexity of combustion under varying blend ratios. Similarly, Li et al. [8] developed predictive frameworks using intelligent algorithms to estimate performance and emission outcomes in dual-fuel engines, showing strong alignment with experimental validation. In another recent effort, Bhatt and Shrivastava [9] reviewed the application of artificial neural networks (ANNs) in internal combustion engine research, establishing the potential of ANN-based surrogates to reduce experimental effort while maintaining predictive accuracy.
Expanding beyond conventional piston engines, Wang et al. [10] employed a hybrid machine learning and genetic algorithm approach for optimizing a hydrogen-fueled Wankel rotary engine, demonstrating that multi-objective algorithms can effectively balance competing performance and emission metrics. Zbikowski and Teodorczyk [11] further synthesized progress in hydrogen-blended fuel research through a systematic review, emphasizing that intelligent optimization and ML-driven models are critical to unlocking the full potential of HCNG and related alternative fuels.
Several multi-criteria decision-making (MCDM) methods, such as TOPSIS (Technique for Order of Preference by Similarity to Ideal Solution), AHP (Analytic Hierarchy Process), and VIKOR, are available but often rely on subjective judgments to assign weights or define ideal solutions, potentially introducing bias into the optimization process. Furthermore, the efficacy of these approaches in intricate engineering applications may be limited by their inability to smoothly integrate with experimental data or Design-of-Experiments (DOE) frameworks. In contrast, the integrated Taguchi–CRITIC–GRA framework offers a robust and objective approach for optimizing engine performance. Taguchi’s orthogonal arrays reduce experimental complexity by efficiently structuring test conditions, Grey Relational Analysis (GRA) consolidates multiple performance metrics into a single, comparable score, and the CRITIC method provides data-driven weighting based on variability and inter-criteria correlations. In order to handle the nonlinear and interrelated dynamics of engine performance and emissions, this combination provides a strategy that is both efficient and rigorous.
A strong foundation for addressing these issues is provided by combining Taguchi's orthogonal arrays, GRA's multi-response aggregation, and CRITIC's objective weighting. This study is driven by the need to apply this triad to optimize critical parameters—brake mean effective pressure (BMEP), BSFC, NOₓ, CO, and NMHC in a multi-cylinder HCNG engine, considering variables like load, blend ratio, and equivalence ratio. The aim is to provide a validated methodology for efficient and environmentally compliant HCNG engine calibration.
1.3 Challenges
Optimizing hydrogen–compressed natural gas (HCNG) engines involves addressing multiple technical trade-offs. Increasing the hydrogen fraction in the fuel blend enhances thermal efficiency due to improved combustion kinetics, but it also raises in-cylinder temperatures, thereby promoting NOx formation via thermal (Zeldovich) mechanisms [12]. Conversely, operating at leaner equivalence ratios or with higher hydrogen content can significantly reduce CO and non-methane hydrocarbon (NMHC) emissions due to more complete oxidation, yet this often comes at the expense of power output or combustion stability [13]. In multi-cylinder installations, where inter-cylinder variability, transient load variations, and dynamic operating circumstances can intensify performance and emissions trade-offs, these nonlinear effects become even more complex. Developing strong HCNG optimization solutions that both reduce emissions and increase efficiency requires an understanding of and ability to quantify these connections.
Conventional trial-and-error or single-objective calibration techniques are ineffective and frequently produce less-than-ideal outcomes. Practical HCNG engine deployment requires a thorough optimization approach that can handle several goals at once, such as optimizing BMEP while lowering BSFC, CO, NOx, and NMHC.
1.4 Approach
To address these challenges, this study proposes an integrated multi-objective optimization framework combining:
•Taguchi Method: Utilizes orthogonal arrays to efficiently design experiments with discrete input levels, reducing experimental effort.
•CRITIC (Criteria Importance Through Intercriteria Correlation): Objectively determines weights for performance metrics based on their variability and interdependencies, ensuring data-driven prioritization [14].
•Grey Relational Analysis (GRA): Aggregates diverse response variables into a single Grey Relational Grade (GRG), enabling ranking of experimental configurations [15].
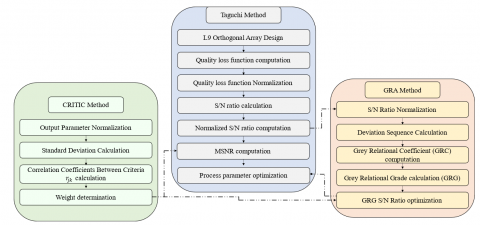
The Taguchi method minimizes experimental runs, while GRA resolves its limitations in multi-response optimization. CRITIC eliminates subjective weight assignments, ensuring robust optimization outcomes. The complicated behavior of HCNG engines is balanced by this framework, which improves performance while adhering to environmental regulations. The integrated multi-objective optimization framework is shown in Figure 1. The inherently complicated behavior of HCNG engines is effectively balanced by this comprehensive framework, which reliably improves engine performance while strictly adhering to stringent environmental regulations. The resulting integrated multi-objective optimization framework is clearly shown in the following Figure 1.
Figure 1. Integrated multi-objective optimization framework
To explore the potential of Hydrogen-Enriched Compressed Natural Gas (HCNG), experiments were conducted using a robust 6-cylinder, 4-stroke, spark-ignition engine tailored for gaseous fuels. This engine, with its in-line cylinder design and 6.5-liter displacement, is built for low-speed, high-torque tasks, delivering a solid 52 kW of power at 1500 rpm, perfect for applications needing steady, reliable output. The detailed engine specifications are given in Table 1.
Table 1. Engine specifications
|
Parameter |
Specification |
|
Engine Type |
4-stroke, 6-cylinder, in-line SI engine |
|
Total Displacement |
6.5 Liters |
|
Rated Power |
52 kW @ 1500 rpm |
|
Compression Ratio |
10.5:1 (optimized for gaseous fuels) |
|
Ignition System |
Electronic spark ignition (ESI) |
|
Fuel Supply |
Electronic gas flow regulator system |
|
Cooling System |
Water-cooled |
|
Dynamometer |
Eddy current, computer-controlled |
A sophisticated ESI system installed in the engine provides exact control over the timing and manner of fuel ignition, guaranteeing ideal combustion. An electronic gas flow system manages fuel delivery, carefully blending natural gas and hydrogen in precisely the proper amounts with the use of mass flow sensors and solenoid-controlled valves.
The engine was placed on a test bed with an eddy current dynamometer for reliable and repeatable testing. Particular loads were able to be applied while maintaining a constant engine speed, which was managed by sophisticated software. A data acquisition system kept track of key performance and emission metrics in real time, giving us a clear picture of how the engine performed under various conditions.
This engine was chosen because it’s well-suited for spark-ignition operation and can handle HCNG blends effectively, making it an ideal platform for studying the balance between performance and emissions in a controlled setting.
2.1 Instrumentation and measurement
The experimental setup was developed to evaluate the combined performance and emission characteristics of a multi-cylinder HCNG-fueled spark-ignition engine under controlled laboratory conditions. Engine loading was conducted in accordance with the ISO 8178 Part 4, 3-mode steady-state emission test cycle, which prescribes operation at 50%, 75%, and 100% load. These load points were selected as they capture the most operationally relevant regions of engine performance in practical applications, particularly for stationary and heavy-duty equipment, without the extended test durations associated with full duty cycles.
An electronically controlled gas metering system was used to control fuel delivery, guaranteeing accurate and consistent natural gas and hydrogen delivery. The HCNG blends were prepared in accordance with ISO technical specifications for gaseous fuel mixtures, and their composition was verified through Gas Chromatography (GC) analysis before each test session. This verification step ensured both compliance with safety protocols and consistency across trials by confirming volumetric hydrogen content in the target ranges of 18%, 25%, and 30% v/v.
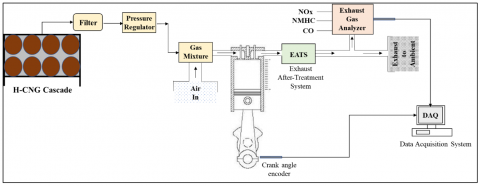
A raw exhaust emission analyzer (AVL AMA i60) that could constantly monitor NOx, CO, CO2, O2, and total hydrocarbons (THC) was used to measure exhaust emissions. In order to account for the high methane concentration characteristic of CNG-based fuels, non-methane hydrocarbons (NMHC) were generated from THC using standardized correction factors. Brake torque and engine speed were recorded directly through the dynamometer system, and standard thermodynamic equations were used to compute Brake Mean Effective Pressure (BMEP) and Brake Specific Fuel Consumption (BSFC) from fuel flow and output power. The engine test setup is shown in Figure 2.
Figure 2. Engine test setup
To maintain testing consistency, all measurements were performed at a fixed engine speed of 1500 rpm, corresponding to the engine’s rated operating point. At each test condition, the engine was allowed to stabilize thermally for at least 10 minutes, after which emissions and performance data were recorded. Each reported value represents the average of three independent trials, and the standard deviation was computed to quantify repeatability. Across all runs, the repeatability error remained within ± 2% for BMEP and BSFC and ± 3-5% for emissions (CO, NOx, NMHC). Measurement uncertainties were primarily associated with the accuracy of the instrumentation (flow meters: ± 1%, exhaust analyzers: ± 2%), and error propagation analysis confirmed that the overall uncertainty in reported parameters did not exceed ±5% of measured values.
2.2 Experimental variables
In this work, engine performance and emissions were assessed concurrently under various operating situations using a multi-objective optimization approach. The key input variables and output responses are summarized below.
Input parameters
Three primary control variables were selected based on their known influence on combustion dynamics, emissions, and efficiency in HCNG-fueled engines:
Engine load (% of full load): Load conditions were set at 50%, 75%, and 100%, following the ISO 8178 3-mode cycle. These levels were chosen for their ability to capture representative engine operating regimes, ranging from moderate acceleration/load-sharing conditions to full-throttle operation without overextending test time or complexity. The 3-mode cycle provides a balance between regulatory compliance and experimental efficiency.
HCNG blend ratio (% H₂ by volume): Blend levels of 18%, 25%, and 30% v/v hydrogen in natural gas were selected based on prior findings that identify this range as optimal for enhancing combustion speed and reducing CO and HC emissions, without triggering knock or excessive NOₓ formation. While concentrations exceeding 30% may surpass pre-ignition thresholds in traditional spark-ignition systems, blend levels below 18% provide diminishing returns in emission reductions.
Equivalence ratio (ϕ): Three equivalence ratios of 0.952 (lean), 1.000 (stoichiometric), and 1.031 (slightly rich) were investigated. These values span the practical operating window for gaseous spark-ignition engines while remaining within the limits of stable combustion. Lean mixtures improve fuel economy and reduce NOₓ, but may risk misfire; rich mixtures favour power output but elevate unburned hydrocarbons and CO. Without sacrificing engine stability, the chosen range guarantees that both extremes of the trade-off spectrum are represented.
Output Responses
The following five output parameters were used as criteria for optimization:
•BMEP (bar) – Indicator of effective cylinder pressure and engine torque output.
•BSFC (g/kWh) – Measure of fuel consumption per unit power, linked to thermal efficiency.
•NOₓ (ppm) – Key pollutant affected by in-cylinder temperatures and oxygen availability.
•CO (ppm) – Product of incomplete combustion, sensitive to mixture richness.
•NMHC (ppm) – Reflects unburned hydrocarbons not attributable to methane, associated with fuel slip or quenching.
A Taguchi L9 orthogonal array was used to structure the test matrix because of the experiment's three-factor, three-level structure. Compared to full factorial designs (33 = 27 combinations), this design offers a statistically sound and efficient way to cover the experimental area with just nine trials, greatly lowering the number of tests needed. The orthogonality of the Taguchi technique permits independent evaluation of primary impacts and guarantees balanced coverage of factor levels.
3.1 Design of experiments
The selection of the orthogonal array was guided by the number of control parameters and their levels. In this study, three input parameters, such as engine load, HCNG blend ratio, and equivalence ratio (ϕ), were each investigated at three levels. This results in a 33 factorial design. To systematically explore this parameter space while minimizing experimental burden, the Taguchi L9 orthogonal array was chosen.
The L9 design requires only nine experimental trials yet ensures balanced coverage of the factor levels and enables the estimation of main effects. Larger orthogonal arrays, such as L18 or L27, could in principle be employed, or replicates added, to capture higher-order interactions or enhance statistical power. However, such expansions would substantially increase the number of test runs, which is particularly demanding for multi-cylinder engine experiments in terms of fuel consumption, operating time, and cost. Since the present work focuses on identifying the dominant parameters and optimal levels for overall engine performance and emissions, the L9 array provides an efficient and statistically sufficient design.
Future extensions of this study may incorporate larger experimental arrays or replicated runs to investigate parameter interactions and validate findings under transient or real-world operating conditions.
3.2 Experimental design using Taguchi method
The experimental design for this study utilized the Taguchi method to assess the significance of various process parameters on the target outcomes. As detailed in Table 2, the three process parameters examined include load, blend and phi (ϕ), each with three different levels. As a result, a total of 27 possibilities (3 × 3 × 3) were investigated. The Taguchi approach, however, allows samples to be arranged into just nine groups and still produces results with a level of confidence that is comparable to that of analyzing each combination separately.
Table 2. The levels and control parameters for the three engine input parameters
|
Parameters |
|||
|
Load |
Blend |
Phi |
|
|
Unit |
(%) |
(%) |
(-) |
|
Level 1 |
50 |
18 |
0.952 |
|
Level 2 |
75 |
25 |
1 |
|
Level 3 |
100 |
30 |
1.031 |
3.3 Experimental matrix and output observations
The Taguchi method was utilized in the current study to optimize contrasting output parameters like maximizing BMEP, while at the same time reducing BSFC, NOx + NMHC and CO. Table 3 shows the coded input parameters with the values of the output parameters. This coding maintains the design's interpretability while enabling concise representation and streamlining statistical computation. Higher BMEP is generally preferred since it results in increased torque and engine efficiency. Additionally, a lower BSFC is desired since it means using less fuel to achieve the same performance results. Similarly, lower emission parameters like NOx + NMHC and CO are also likely.
Table 3. The levels and control parameters for the three engine input parameters
|
Exp. No. |
Coded Input Parameter |
Output Parameters |
|||||
|
Load |
Blend |
Phi |
BMEP |
BSFC |
NOx + NMHC |
CO |
|
|
(%) |
(%) |
bar |
g/kWh |
ppm |
ppm |
||
|
1 |
1 |
1 |
1 |
3.77 |
264.67 |
107.77 |
45.36 |
|
2 |
1 |
2 |
2 |
3.77 |
268.12 |
299.49 |
30.82 |
|
3 |
1 |
3 |
3 |
3.73 |
264.91 |
177.98 |
38.06 |
|
4 |
2 |
1 |
2 |
5.80 |
240.78 |
263.99 |
50.72 |
|
5 |
2 |
2 |
3 |
5.69 |
239.14 |
688.57 |
40.28 |
|
6 |
2 |
3 |
1 |
5.69 |
233.22 |
130.62 |
9.42 |
|
7 |
3 |
1 |
3 |
7.86 |
228.52 |
422.18 |
59.86 |
|
8 |
3 |
2 |
1 |
7.56 |
223.35 |
43.82 |
35.01 |
|
9 |
3 |
3 |
2 |
7.55 |
220.53 |
123.03 |
20.85 |
3.4 Signal-to-noise ratio (S/N) analysis
In the Taguchi method, the Signal-to-Noise Ratio (S/N ratio) serves as a critical statistical metric to evaluate the robustness of each experimental run in the presence of variability. By integrating mean performance and variance into a single index, it quantitatively reflects how far the observed experimental result deviates from the intended goal value. The central premise is to maximize the S/N ratio to achieve optimal and stable system performance, particularly under varying and uncertain conditions.
In the Taguchi method, the term "signal" refers to the ideal value for the output characteristic, while "noise" denotes the undesirable value for that characteristic. Accordingly, the Taguchi method's "signal-to-noise ratio" or S/N ratio measures the degree to which the quality characteristic deviates from the desired value. Optimization within this framework involves maximizing the S/N ratio. For the current investigation, optimizing the output parameters, the following steps have been implemented:
Computation of quality loss function: Quality loss functions can be categorized into three distinct types based on the characteristics of the output: smaller-the-better, nominal-the-best, and higher-the-better. In the present study, the objective is to maximize BMEP and hence the higher-the-better quality loss function (fi) has been employed. For the ith trial, the function (fi) is mathematically represented as follows:
$f_i=\frac{1}{n} \sum_{i=1}^n \frac{1}{y_i^2}$ (1)
To minimize BSFC, NOx + NMHC and CO, the smaller-the-better quality loss function (fi) has been employed. For the ith trial, the function (fi) is mathematically represented as follows:
$f_i=\frac{1}{n} \sum_{i=1}^n y_i^2$ (2)
In this context, $y_i^2$ represents the output or quality characteristic measured during the ith trial at a uniform parameter level, while n denotes the total number of trials conducted in the study.
Normalization of quality loss function: Given that the current study involves four quality characteristics (BMEP, BSFC, NOx + NMHC and CO) with varying ranges of values, it is necessary to normalize the quality loss function values calculated in Eq. (1) to a scale between 0 and 1 prior to their use in simultaneous optimization. The normalized quality loss value $f_{i j}^{\prime}$ is determined as follows:
$f_{i j}^{\prime}=\frac{f_{i j}}{f_{i \max }}$ (3)
In this context, $f_{i j}^{\prime}$ signifies the normalized quality loss for the ith output characteristic under the jth trial condition, whereas fi max represents the maximum quality loss for the ith output characteristic observed across all trials or experimental runs.
If wi denotes the weights associated with the ith output characteristic and p represent the total number of output characteristics, the overall normalized quality loss for the jth trial condition Fj can be calculated as follows:
$F_j=\sum_{i=1}^p w_i f_{i j}^{\prime}$ (4)
Computation of multiple S/N ratio: Each design point's quality index is assessed using the Multiple Signal-to-Noise Ratio (MSNR) and the total normalized quality loss values. The MSNR associated with the jthtrial condition MSNRj is computed as follows:
$M S N R_j=-10 \log _{10}\left(F_j\right)$ (5)
Optimization of process parameters: To evaluate the impact of a process parameter or factor on the quality attributes at a given level, the average of all MSNR values at that level is used. The optimum level for a given parameter is the one that produces the highest average MSNR. The predicted value of MSNR (MSNRopt) at these optimal parameter levels is determined using the following formula:
$M S N R_{ {opt }}=\overline{M S N R}+\sum_{i=1}^k\left(M S N R_{ {avg }}-\overline{M S N R}\right)$ (6)
where, $\overline{M S N R}$ is the mean MSNR of all experimental runs, k is the number of significant control factors, and avg is the average MSNR for jth control factor corresponding to the optimum parameter level. Further, an experiment is conducted with optimum parameter levels determined by the Taguchi method for validation of the predicted response.
3.5 CRITIC method for objective weighting
Using the CRITIC method to determine the weights of the criteria, the weight for the jth response, referred to as wjwere calculated. This involved examining each vector based on its Standard Deviation (SD). After that, a symmetric matrix that shows the linear correlation coefficients between the different vectors was constructed.
3.5.1 Normalization of SNR values
Initially, a decision matrix $D=\left[d_{i j}\right]_{m \times n}$ is defined, which comprises m quality characteristics and n criteria. In this matrix, dij indicates the output value for the ith alternative concerning the jth criterion. To eliminate numerical variations among the various quality characteristics, we normalized the matrix D so that all output values are scaled between 0 and 1. This normalization can be represented as:
$\overline{d_{\imath \jmath}}=\frac{d_{i j}-d_j^{ {worst }}}{d_j^{ {best }}-d_j^{ {worst }}}$ (7)
3.5.2 Calculation of standard deviation (SD)
In this context, dij denotes the normalized output value for the i^th alternative with respect to the jth criterion, while djworst and djbest represent the lowest and highest output values for the jth criterion, respectively. Additionally, dij is defined in relation to the output value of the ith alternative corresponding to the jth criterion, where i=1,2,...,m and j=1,2,..,n. Following this, the degree of contrast among the criteria was assessed based on the Standard Deviation (SD) of the normalized criterion values organized by columns (dj). The SD for the jth criterion, denoted as $\sigma_j$ is given by:
$\sigma_j=\sqrt{\frac{\sum_{i=n}^m\left(\overline{d_{\imath \jmath}}-\overline{d_{\jmath}}\right)^2}{m}}$ (8)
where, m denotes the number of experiments, while $\overline{d_{\imath \jmath}}$ is defined as the average output value for the jth criterion.
3.5.3 Establishment of correlation matrix
Subsequently, a symmetric matrix of dimensions (m × m) was constructed to illustrate the linear correlation coefficients between the criteria, represented as rjk which can be formulated as:
$r_{j k}=\frac{\sum_{i=1}^m\left(\overline{d_{\imath \jmath}}-\bar{d}_{\jmath}\right)\left(\overline{d_{\imath k}}-\overline{d_k}\right)}{\sum_{i=1}^m\left(\overline{d_{\imath \jmath}}-\overline{d_{\jmath}}\right)^2 \sum_{i=1}^m\left(\overline{d_{\imath k}}-\overline{d_k}\right)^2}$ (9)
The correlation coefficient functions as a statistical measure that varies between -1 and 1, illustrating the degree of association between two variables. A negative coefficient value indicates a negative association between the two variables, whereas a positive number indicates that they increase or fall together.
3.5.4 Calculation of criterion information
Subsequently, the information pertaining to the jth criterion, denoted as cj, was computed using the multiplicative formulas presented in Eqs. (8) and (9) as follows:
$c_j=\sigma_j \sum_{k=1}^m\left(1-r_{j k}\right)$ (10)
As indicated in Eq. (10), a rise in the value of cj is associated with an increased amount of information transmitted by the corresponding criterion. As a result, both the relative importance and the objective weight of the criteria are also heightened.
3.5.5 Determination of objective weights
Ultimately, the weight attributed to the jth criterion, represented as wj, was determined by employing the normalized method, which utilized the obtained criterion data, as expressed in the following way:
$W_j=\frac{c_j}{\sum_{j=1}^n C_j}$ (11)
The sum of wj for all criteria will always be equal to 1.
3.6 GRA
The Taguchi method is deemed technically unsuitable for executing simultaneous multi-objective optimization. As a result, the GRA method was adopted as an alternative strategy to evaluate the importance ranking of each process parameter across various quality characteristics by maximizing weld strength and minimizing weld width at the same time. Generally, GRA considers the dimensions of factors that display considerable differences in magnitude. Thus, the original data's magnitude is normalized to one, making it dimensionless.
Primarily, the original response data underwent conversion into the SNR (yij) according to the type of quality characteristic. Following this, the yij was normalized to xij within the interval [0,1], a procedure known as grey relational generating. Since the normalization process has an impact on the ranking, the sensitivity of this process regarding the sequencing results was also examined. The normalized results, xij, for the larger-the-better quality characteristic of BMEP are articulated as:
$x_{i j}=\frac{y_{i j}-\min \left(y_{i j}\right)}{\max \left(y_{i j}\right)-\min \left(y_{i j}\right)}$ (12)
Conversely, the normalized outcomes, xij, pertaining to the smaller-the-better quality characteristic pertaining to BSFC, CO, NOx and NMHC, can be articulated as:
$x_{i j}=\frac{\max \left(y_{i j}\right)-y_{i j}}{\max \left(y_{i j}\right)-\min \left(y_{i j}\right)}$ (13)
A greater normalized result signifies improved quality, where the perfect normalized result should be 1. For the jth response of the ith experiment, the ith experiment's performance is regarded as the best if the normalized value xij is close or equal to 1 compared to the other values.
The importance of other experimental results is underscored. The reference sequence, labelled X0, is articulated as (X01, X02, ..., X0j, ..., X0n)=(1,1,...,1,...,1), in which X0j signifies the reference value for the response and is utilized to determine the experiment that has the closest similarity to the reference sequence.
3.6.1 Calculation of GRC
Following the normalization, the GRC was utilized to evaluate the range between Xij and X0j, where an increased GRC denotes a nearer value between the two. The GRC for the normalized SNR values is represented as:
$\gamma\left(x_{0 j}, x_{i j}\right)=\frac{\left(\Delta_{\min }+\xi \Delta_{\max }\right)}{\left(\Delta_{i j}+\xi \Delta_{\max }\right)}\ For\ i=1,2, \ldots, m\ and\ j=1,2, \ldots, n$ (14)
where, $\gamma\left(x_{0 j}, x_{i j}\right)$ represents the GRC between $x_{0 j}, x_{i j}$; $\Delta_{ {min }}=\min \left\{\Delta_{i j}, i=1,2, \ldots, m ; j=1,2, \ldots, n\right\}$ signifies the minimum value of $x_{i j} ; \Delta_{ {max }}=\max \left\{\Delta_{i j}, i=1,2, \ldots, m ; j=\right. 1,2, \ldots, n$ indicates the maximum value of $x_{i j} \cdot \xi$ denotes the distinguishing coefficient. A lower $\xi$ indicates higher distinguishability. The $\xi$ is utilized to mitigate the influence of $\Delta_{max }$ when it becomes excessively large, thereby enhancing the significant difference of the GRC. The $\xi$ is set to 0.5.
In Grey Relational Analysis (GRA), the distinguishing coefficient ($\xi$) plays a critical role in balancing the contrast between the maximum and minimum deviations across alternatives. Although $\xi$ can theoretically vary between 0 and 1, most studies adopt $\xi$ = 0.5 as a standard practice to ensure both stability and comparability of results. Mahmoudi et al. [16] demonstrated through a sensitivity study in project management that $\xi$ = 0.5 provides a robust middle ground, avoiding the excessive skewness that arises when $\xi$ approaches 0 or 1, thereby enhancing decision reliability. Similarly, Wu et al. [17], in their comprehensive evaluation of coal-fired power units, explicitly applied $\xi$ = 0.5, noting that this choice ensures that neither extreme deviation dominate the analysis, while maintaining computational simplicity and comparability with previous GRA applications. Saeheaw further reinforced this approach in the field of composite material optimization, where the integration of CRITIC weighting with GRA yielded reliable rankings only when $\xi$ = 0.5 was adopted, emphasizing its role in delivering consistent optimization outcomes [18]. Collectively, these works illustrate that the choice of $\xi$ = 0.5 is not arbitrary but rather a consensus developed through empirical validation across diverse engineering domains.
3.6.2 Calculation of GRG
The assessment of the grey relational space is known as the GRG, which signifies the weighted sum of the GRCs, and is computed using the following formula:
$\Gamma\left(X_0, X_i\right)=\sum_{j=1}^n w_j \gamma\left(x_{0 j}, x_{01}\right)\ For\ i=1,2, \ldots, m,\ where \sum_{j=1}^n w_j=1$ (15)
The GRG, $\Gamma\left(X_0, X_i\right)$, signifies the extent of similarity between the comparability sequence, Xi, and the reference sequence, X0. An experiment that attains the highest GRG suggests that the comparability sequence closely mirrors the reference sequence, thus rendering that experiment the most favourable option. The response graph method, also known as ANOVA, was utilized, and the ideal levels of the factors were established based on the maximum average $\Gamma\left(X_0, X_i\right)$ value. In conclusion, the anticipated optimal condition for the multiple quality characteristics was validated through a confirmation experiment following the identification of the optimal combined process parameters.
The anticipated ideal GRG, $\hat{\gamma}$, was determined based on the findings of Haq et al. [19].
$\hat{\gamma}=\gamma_t+\sum_{i=1}^n\left(\gamma_i-\gamma_t\right)$ (16)
where, $\gamma_t$ represents the overall average of the GRG, $\gamma_i$ denotes the average GRG of the ith parameter at optimal levels, and n indicates the count of controllable variables that have a significant impact on the quality characteristics.
3.7 Analysis of Variance (ANOVA) for GRG
In order to quantitatively assess the relative influence of each control parameter on the overall multi-performance output of the HCNG engine, Analysis of Variance (ANOVA) will be conducted on the Grey Relational Grade (GRG) values derived from Grey Relational Analysis (GRA). The GRG represents a unified performance index that consolidates multiple output responses such as BMEP, BSFC, NOₓ + NMHC, and CO into a single scalar value for each experimental run.
The ANOVA technique offers a robust statistical framework to evaluate the significance and contribution percentage of each input parameter - namely, engine load, HCNG fuel blend ratio, and equivalence ratio (ϕ) with respect to their impact on the GRG. Each factor's variance is successfully isolated by this approach, which also separates it from random experimental noise.
Professional statistical software, such as Minitab, was used to perform ANOVA in this study at a 95% confidence level. The percentage contribution assisted in determining which parameter has the greatest impact on engine performance and emission optimization overall, while the F-ratio was utilized to assess the statistical significance of each component.
By applying ANOVA to the GRG values, this study aims to offer clear insights into the dominant parameters driving the HCNG engine’s multi-objective performance. These understandings are essential for well-informed decision-making and the best possible calibration of alternative-fuel engines in real-world scenarios.
3.8 Confirmation experiment and validation of optimal conditions
Following the identification of the optimal input parameter settings using the integrated Taguchi–CRITIC–GRA methodology, confirmation experiments will be conducted to validate the predictive effectiveness of the proposed optimization model. By determining whether the experimental Grey Relational Grade (GRG) attained under ideal circumstances matches the expected value, the robustness and dependability of the optimization procedure will be evaluated. To establish this, the predicted optimal GRG (denoted as $\hat{\gamma}$) will be calculated using the additive model expressed in Eq. (16).
An expected multi-objective performance score is produced by integrating the effects of each parameter at its ideal level, adjusted in relation to the overall mean. The projected GRG range will be restricted by a 95% Confidence Interval (CI) in order to further confirm the statistical significance of this forecast. The CI provides a probabilistic measure of the accuracy of the prediction and is calculated using the following formula:
$C I=\sqrt{F_{\alpha, v 1, v 2} . M S e.\left(\frac{1}{n_{e f f}}+\frac{1}{r}\right)}$ (17)
where,
Fα,v1,v2: F-distribution critical value at confidence level $\alpha$
MSe: mean square error from the ANOVA table
neff: effective number of observations
r: no. of confirmation trials
Usually, the effective number of observations (neff) is the product of the number of observations and the number of performance characteristics considered. For the L9 orthogonal array, the number of observations is 9, and we have 4 performance characteristics, namely BMEP, BSFC, NOx + NMHC and CO. This gives neff = 36.
There were two confirmation trials, thus, r = 2.
The Confidence Interval (CI) for the validation experiment was computed using Eq. (17), whereas the effective number of observations (neff) is articulated as Eq. (18).
$n_{eff}=\frac{{Total\ number\ of\ observations}}{1+{total\ df\ of\ effects\ used\ in}\ \hat{\gamma}}$ (18)
As a result, a 95% confidence interval for the expected optimal condition is defined as:
$\hat{\gamma}-C I \leq \hat{\gamma}_{cgg} \leq \hat{\gamma}+C I$ (19)
where, $\hat{\gamma}_{c g g}$ is the GRG obtained from the confirmation experiment. If the actual GRG value falls within this interval, the prediction is considered statistically valid.
The successful alignment of experimental and predicted GRG values confirms the predictive accuracy and robustness of the integrated optimization method. This provides confidence that the Taguchi–CRITIC–GRA approach is not only theoretically sound but also practically applicable to the multi-objective tuning of HCNG engine systems, where balancing performance, fuel efficiency, and emissions remains a complex engineering challenge.
A thorough examination of the experimental findings obtained from the Taguchi-based design matrix is provided in this section. Using Signal-to-Noise (S/N) ratio analysis, individual effects of engine input parameters like load, HCNG blend ratio, and equivalence ratio (ϕ) on the output responses are examined to identify their influence on performance and emissions characteristics. Each response was treated according to its respective objective: "larger-the-better" for performance (BMEP), and "smaller-the-better" for fuel consumption and emissions (BSFC, NOₓ + NMHC, and CO).
4.1 S/N ratio analysis
Table 4 presents the S/N ratio values calculated for each of the four output responses, BMEP, BSFC, NOₓ + NMHC, and CO, across the three levels of each input factor (Load, Blend, and Phi). The best-performing factor level for each answer is indicated, as is the delta value (Δ), which shows how sensitive the response is to changes in each factor. Rankings are based on the magnitude of these delta values.
Table 4. Response table for signal-to-noise ratios
|
BMEP^ |
BSFC* |
NOx + NMHC* |
CO* |
|||||||||
|
Level |
Load |
Blend |
Phi |
Load |
Blend |
Phi |
Load |
Blend |
Phi |
Load |
Blend |
Phi |
|
1 |
11.5 |
14.9 |
14.73 |
-48.49 |
-47.75 |
-47.6 |
-45.06 |
-47.2 |
-38.6 |
-31.51 |
-34.26 |
-27.83 |
|
2 |
15.16 |
14.73 |
14.79 |
-47.52 |
-47.71 |
-47.69 |
-49.17 |
-46.37 |
-46.59 |
-28.56 |
-30.92 |
-30.09 |
|
3 |
17.68 |
14.7 |
14.81 |
-47.01 |
-47.56 |
-47.74 |
-42.38 |
-43.04 |
-51.43 |
-30.94 |
-25.82 |
-33.08 |
|
Delta |
6.18 |
0.21 |
0.08 |
1.48 |
0.19 |
0.14 |
6.79 |
4.15 |
12.82 |
2.95 |
8.44 |
5.25 |
|
Rank |
1 |
2 |
3 |
1 |
2 |
3 |
2 |
3 |
1 |
3 |
1 |
2 |
|
The highlighted value represents the optimal condition for every process parameter. |
||||||||||||
4.1.1 BMEP
As a performance indicator, BMEP was analyzed under the "larger-the-better" criterion. The S/N analysis shows that Load had the most substantial influence on BMEP (Δ = 6.18), followed by HCNG Blend (Δ = 0.21) and Phi (Δ = 0.08). The optimal level for maximizing BMEP was found at Load Level 3, indicating that increased load conditions consistently enhanced engine torque output. While blend and equivalence ratio also contributed, their effects were notably less pronounced. The optimal parameter settings for BMEP were:
Load = Level 3, Blend = Level 1, ϕ = Level 2
4.1.2 BSFC
Under the "smaller-the-better" criterion, BSFC revealed that Load remained the most dominant parameter (Δ = 1.48), followed by Blend (Δ = 0.19) and Phi (Δ = 0.14). Load Level 3 produced the ideal S/N ratio, indicating that the engine ran more effectively under full load. Improved thermal efficiency and combustion stability under increased mechanical loads are responsible for this. Thus, for minimizing fuel consumption:
Load = Level 3, Blend = Level 3, ϕ = Level 1 proved to be the most effective setting.
4.1.3 NOx + NMHC emissions
For emissions analysis, NOx and NMHC were grouped and evaluated together using the "smaller-the-better" approach. Unlike performance metrics, the most influential factor here was ϕ (Equivalence Ratio) with a significantly high delta value of 12.82, indicating strong sensitivity of NOx + NMHC emissions to air–fuel mixture strength. This was followed by Load (Δ = 6.79) and Blend (Δ = 4.15). The lowest emissions were observed at ϕ Level 3 (ϕ = 1.031), which is slightly rich and thus conducive to lowering NOx formation without disproportionately increasing unburned hydrocarbons. The recommended settings for minimizing NOx + NMHC emissions were:
Load = Level 3, Blend = Level 3, ϕ = Level 1
4.1.4 CO emissions
For CO emissions, HCNG Blend emerged as the most influential parameter (Δ = 8.44), followed by ϕ (Δ = 5.25) and Load (Δ = 2.95). By improving flame speed and combustion completeness, the rising hydrogen fraction in the HCNG blend successfully lowers CO levels. The most favourable outcome was achieved at Blend Level 3 (30% H₂) and ϕ Level 1 (ϕ = 0.952), reflecting the benefit of leaner and hydrogen-rich mixtures for CO mitigation. The recommended optimal setting for minimal CO emissions was:
Load = Level 2, Blend = Level 3, ϕ = Level 1
This single-objective S/N analysis reveals the most favorable level of each control parameter for individual output responses. It is evident that the same parameter levels do not simultaneously optimize all responses. For example, while higher load improves BMEP and BSFC, it also tends to increase NOₓ + NMHC emissions. Similarly, the blend and equivalence ratio settings that minimize CO may not be ideal for fuel efficiency.
The inherent multi-objective complexity of HCNG engine optimization is highlighted by these trade-offs, which show that economy, performance, and environmental compliance cannot all be maximized separately. Therefore, the S/N analysis does not offer a comprehensive solution, even though it offers insightful information on the sensitivity of individual factors. For this reason, the next phase employs Grey Relational Analysis (GRA) integrated with CRITIC-derived weights to identify the optimal compromise setting that best satisfies all performance criteria collectively.
4.2 CRITIC method results and objective weight determination
In the context of multi-objective optimization of engine performance and emissions, the challenge lies in assigning rational and justifiable importance to each output parameter—especially when performance metrics (e.g., BMEP) must be optimized alongside conflicting environmental goals (e.g., low NOx, CO). To address this, the CRITIC (Criteria Importance Through Intercriteria Correlation) method is applied to compute objective weights based solely on data-derived criteria, thus eliminating user-induced bias inherent to subjective approaches.
4.2.1 Normalized S/N ratios and variability assessment
Table 5 displays the normalized values of each output response variables BMEP, BSFC, NOₓ + NMHC, and CO calculated using the appropriate "larger-the-better" or "smaller-the-better" normalization techniques depending on the desired direction of optimization. This normalization enables comparability across responses that differ in units and scales.
Table 5. Normalized values of the output parameters based on the critic method
|
Exp. No. |
BMEP |
BSFC |
NOx + NMHC |
CO |
|
1 |
0.0156 |
0.9337 |
0.3267 |
0.8501 |
|
2 |
0.0156 |
1 |
0.6978 |
0.6411 |
|
3 |
0 |
0.9384 |
0.5088 |
0.7552 |
|
4 |
0.5932 |
0.4496 |
0.6520 |
0.9105 |
|
5 |
0.5676 |
0.4147 |
1 |
0.7859 |
|
6 |
0.5676 |
0.2863 |
0.3965 |
0 |
|
7 |
1 |
0.1821 |
0.8224 |
1 |
|
8 |
0.9474 |
0.0651 |
0 |
0.7100 |
|
9 |
0.9461 |
0 |
0.3748 |
0.4299 |
|
SD |
0.4159 |
0.3905 |
0.2987 |
0.3018 |
The standard deviation (SD) for each parameter reflects the contrast intensity, a key aspect of the CRITIC method. It measures the amount of variety that each criterion adds to the whole decision space. The results reveal the following variability among normalized parameters.
BMEP: 0.4159
BSFC: 0.3905
NOₓ + NMHC: 0.2987
CO: 0.3018
These values indicate that BMEP and BSFC exhibit relatively higher dispersion among experimental conditions, while NOₓ + NMHC and CO show moderately consistent patterns.
4.2.2 Correlation matrix and conflict quantification
The CRITIC method also accounts for the degree of conflict or redundancy between criteria by calculating pairwise correlation coefficients. Table 6 outlines the correlation matrix, with key observations as follows:
•BSFC and NOₓ + NMHC share a high correlation (0.985), suggesting potential co-dependency.
•NOₓ + NMHC and CO are less correlated (0.602), highlighting a degree of independent behaviour.
•BMEP shows moderate correlation with most parameters but is most independent from NOₓ + NMHC (0.973).
This analysis helps isolate which parameters contribute unique information to the multi-objective function.
4.2.3 CRITIC-based objective weights
Using both the standard deviation and the inter-criteria correlations, the CRITIC method computes the information content (Cj) for each output and finally derives the normalized objective weights (Wj). These weights reflect the relative importance of each parameter in the multi-objective optimization process. The results are given in Table 6.
Table 6. The correlation coefficient of each criterion and the objective weights of all output parameters
|
|
BMEP |
BSFC |
NOx + NMHC |
CO |
Cj |
Wj |
|
BMEP |
0 |
1.960 |
0.973 |
0.946 |
6.558 |
0.010 |
|
BSFC |
1.960 |
0 |
0.985 |
0.848 |
70.915 |
0.113 |
|
NOx + NMHC |
0.973 |
0.985 |
0 |
0.602 |
514.274 |
0.819 |
|
CO |
0.946 |
0.848 |
0.602 |
0 |
36.488 |
0.058 |
It is evident that NOx + NMHC emissions dominate the information structure of the decision space, contributing over 81.9% of the weight. This high weight is not only a statistical outcome of the variability and correlation structure among the responses but also aligns with practical engineering priorities and regulatory requirements. Specifically, under the Central Pollution Control Board (CPCB) emission norms for stationery and generator-set engines, based on the ISO 8178 Part 4 (3-mode test cycle), NMHC + NOₓ is a regulated pollutant and represents one of the most critical compliance criteria [20, 21]. From a practical perspective, excessive NOₓ formation is a key barrier for hydrogen-enriched fuels due to higher flame temperatures, while NMHC levels must be minimized to ensure combustion completeness and avoid unburned hydrocarbon slip.
Thus, the high CRITIC weight reflects both the statistical dominance of NOₓ + NMHC in the dataset and its engineering importance under emission standards. This strengthens the validity of the optimization framework, as it inherently prioritizes parameters most relevant to regulatory compliance and real-world deployment.
The second most influential factor is BSFC (11.3%), indicating its substantial role in determining engine efficiency. CO emissions (5.8%) follow, and BMEP (1.0%), despite its relevance for performance, has the lowest weight due to its strong correlations with other parameters and lower relative discriminative power in this dataset.
4.2.4 Significance and advantage over subjective weighting
The objectivity and analytical rigor of the CRITIC technique are among its main advantages. By determining weights directly from the statistical characteristics of the answer data, CRITIC avoids arbitrary assumptions that are present in expert-driven or equal-weighted techniques. In engine research, where performance and emission goals are linked and frequently conflict, this is very helpful.
The CRITIC framework guarantees that the forthcoming GRA phase is based on a fair, evidence-based weighting method by letting the data determine what is most important. Conflicting goals are settled in accordance with their actual statistical behavior, producing a more realistic and trustworthy optimization result.
4.3 GRA results
To derive a unified performance metric from multiple conflicting output responses, GRA was employed. Using the normalized S/N ratio values and CRITIC-derived objective weights from Section 4.2, the GRCs were calculated for each output variable across all experimental runs. These coefficients represent the degree of closeness of each experiment's performance to the ideal solution.
Then, the corresponding goal weights were applied to the GRCs of each response to determine the GRG. BMEP, BSFC, and emissions (CO, NOx, NMHC) are all simultaneously taken into consideration in this scalar index, which represents the total multi-objective performance of each experimental setup.
4.3.1 GRG and multi-objective ranking
To quantitatively evaluate the collective performance of all output responses, namely, BMEP, BSFC, NOx + NMHC, and CO, the Grey Relational Analysis (GRA) technique was implemented. As described in Section 3.5, this process begins with the normalization of individual performance responses, followed by the computation of Grey Relational Coefficients (GRCs), which are then aggregated using the objective weights derived through the CRITIC method to determine the final Grey Relational Grade (GRG) for each experimental run.
Table 7 presents the computed GRCs, the corresponding GRG values, and the rank for each of the nine experimental trials.
The GRG values thus obtained for each of the nine experimental combinations are provided in Table 7. These values range approximately from 0.065 to 0.118, where a higher GRG implies closer proximity to the ideal (optimal) response behaviour across all performance metrics. This proximity is calculated based on the magnitude of deviation between the normalized SNR values of each experiment and the best-case reference sequence (which is 1 for all normalized responses in GRA).
Table 7. The correlation coefficient of each criterion and objective weights of all output parameters
|
Exp. No. |
GRC |
GRG |
Rank |
|||
|
BMEP |
BSFC |
NOx + NMHC |
CO |
|||
|
1 |
0.2519 |
0.4689 |
0.29881 |
0.4348 |
0.0813 |
6 |
|
2 |
0.2519 |
0.5 |
0.38395 |
0.3679 |
0.0986 |
3 |
|
3 |
0.25 |
0.4709 |
0.33530 |
0.4016 |
0.0883 |
5 |
|
4 |
0.3554 |
0.32249 |
0.37090 |
0.4589 |
0.0925 |
4 |
|
5 |
0.3490 |
0.3154 |
0.5 |
0.4118 |
0.1181 |
1 |
|
6 |
0.3490 |
0.2917 |
0.31182 |
0.25 |
0.0765 |
7 |
|
7 |
0.5 |
0.2750 |
0.42459 |
0.5 |
0.1032 |
2 |
|
8 |
0.4750 |
0.2584 |
0.25 |
0.3875 |
0.0653 |
9 |
|
9 |
0.4744 |
0.25 |
0.30764 |
0.3184 |
0.0758 |
8 |
By reducing the dimensionality of several competing criteria into a single composite index, this system enables multi-response optimization. It also helps in identifying the experiments which collectively offer the most favourable engine output characteristics like BMEP, efficiency (BSFC), and emissions (NOx + NMHC and CO) as per the statistical priorities defined by the CRITIC-derived weights.
4.3.2 Mean response analysis for GRG
To further interpret the effect of each input parameter, the mean GRG values for each level of Load, HCNG Blend, and Equivalence Ratio were computed and are presented in Table 8. These mean values allow for the identification of the optimal level for each factor and reveal the influence ranking based on the Δ (Delta) values.
Table 8. Response table for signal to noise ratios for overall GRG
|
Level |
Load |
Blend |
Phi |
|
1 |
-20.99 |
-20.73 |
-22.6 |
|
2 |
-20.51 |
-20.79 |
-21.06 |
|
3 |
-21.94 |
-21.93 |
-19.78 |
|
Delta |
1.43 |
1.2 |
2.82 |
|
Rank |
2 |
3 |
1 |
|
The highlighted value represents the optimal condition for every process parameter. |
|||
Finding the ideal level setting for each component that maximizes overall performance based on the aggregated response behavior is the main goal of this investigation. In this context, the "larger-the-better" criterion was applied, since a higher GRG implies closer approximation to the ideal multi-objective performance.
From this analysis:
•Equivalence Ratio / Phi (ϕ) emerges as the most influential factor, with the highest Delta value of 2.82. This supports past findings that adjusting air-fuel mixes significantly affects emissions and combustion efficiency.
•The second most important factor is engine load, which is crucial for maximizing thermodynamic performance and lowering specific fuel consumption.
•HCNG Blend ratio, although still significant, is comparatively the least dominant among the three parameters. This suggests that once a sufficient hydrogen fraction is introduced, further increments yield diminishing returns in the studied range.
While the absolute S/N values are negative due to logarithmic transformation in the Taguchi method, the comparative trend is what determines the optimal setting, i.e., the least negative value represents the most favourable performance.
The optimal levels based on GRG are:
•Load = Level 3 (100%)
•Blend = Level 3 (30% H2)
•ϕ = Level 1 (0.952)
This indicates that operating the engine at full load and moderately lean equivalence ratio, with a higher hydrogen content, provides a synergistic balance of power, economy, and environmental performance. These levels collectively signify the experimental condition expected to provide the best compromise across power output, fuel consumption, and emissions performance. This insight guides the next stage of analysis i.e. ANOVA and confirmation experiments, to validate the statistical significance and practical robustness of this optimal setting.
4.3.3 Strategic inferences
The GRA-based optimization, when guided by CRITIC-derived objective weights, yields a statistically sound and practically relevant configuration for HCNG engine operation. Unlike traditional trial-and-error approaches, this methodology ensures that each parameter's contribution is quantitatively captured, making it an effective decision-making framework for future engine development and policy-conforming fuel strategies.
The results emphasize how crucially emission formation and combustion stoichiometry interact, highlighting the necessity of strictly controlled air-fuel calibration in hydrogen-enriched gaseous fuel systems. The GRG-based optimization thus not only facilitates targeted engine tuning but also provides a replicable template for multi-response optimization in alternative fuel technologies.
4.4 Analysis of variance (ANOVA) for GRG
To statistically quantify the influence of the engine input parameters like Load, HCNG Blend, and Equivalence Ratio (ϕ) on the combined performance responses, an ANOVA was conducted on the GRG. This analysis helps determine the percentage contribution and statistical significance (P-values) of each parameter toward the overall variability in GRG, thereby identifying the most influential control factors in the experimental matrix. While the Taguchi method is well regarded for its efficiency in identifying optimal parameter levels, one of its limitations is that it does not inherently capture the interaction effects between factors. In the present study, this limitation was acknowledged, and an additional ANOVA was carried out to examine such interactions. The use of ANOVA provided insights into the combined influence of the parameters, thereby supplementing the Taguchi approach and enhancing the reliability of the optimization outcomes.
4.4.1 ANOVA findings
Table 9 presents the ANOVA results across all four primary response characteristics: BMEP, BSFC, NOₓ + NMHC, and CO. The P-values assess each factor's statistical significance at a 95% confidence level, whilst the F-values show the ratio of variation explained by the factor to the residual variance ($\alpha$ = 0.05).
Table 9. ANOVA result of the effect of process parameters on the engine output parameters
|
BMEP |
BSFC |
NOx + NMHC |
CO |
|||||
|
Source |
F-Value |
P-Value |
F-Value |
P-Value |
F-Value |
P-Value |
F-Value |
P-Value |
|
Load |
1305.24 |
0.001 |
460.59 |
0.002 |
1.51 |
0.399 |
0.47 |
0.679 |
|
Blend |
2.46 |
0.289 |
7.3 |
0.12 |
1.68 |
0.374 |
12.84 |
0.072 |
|
Phi |
0.65 |
0.607 |
3.86 |
0.206 |
4.71 |
0.175 |
4.2 |
0.192 |
The ANOVA results state the following:
•Engine Load is the only parameter that demonstrates statistically significant influence (P < 0.05) on both BMEP and BSFC, affirming its critical role in enhancing power output and fuel efficiency.
•For NOₓ + NMHC and CO emissions, none of the parameters exhibit statistically significant influence at the 95% confidence level, indicating a complex, potentially non-linear relationship with the control factors, or the need for additional interactions or replicates for further insight.
•HCNG Blend and Equivalence Ratio (ϕ) show borderline effects on CO and NOₓ, suggesting that these variables still affect emissions behaviour, albeit not strongly enough to reach conventional significance thresholds in this design.
These findings reinforce and complement the GRG-based ranking in Table 8, where ϕ (Equivalence Ratio) emerged as the most influential based on mean GRG Delta values. This disparity suggests that while ANOVA is effective for individual response contributions, GRG combined with CRITIC-derived weights provides a more holistic, multi-objective assessment.
ANOVA indicated that engine load was statistically significant for BMEP and BSFC, but not for emissions such as NOₓ and CO (p > 0.05). In contrast, the GRG analysis ranked the equivalence ratio (ϕ) as the most influential factor overall, followed by load and blend ratio.
This apparent discrepancy arises from the different scopes of the two methods. ANOVA evaluates the statistical contribution of each parameter for a single response variable, meaning that load strongly drives efficiency-related metrics but shows limited direct influence on emissions. On the other hand, GRG consolidates multiple responses into a single performance index using CRITIC-derived weights. In this framework, the equivalence ratio exerts the greatest leverage because it simultaneously affects combustion efficiency and pollutant formation, thereby gaining higher importance in the combined multi-objective optimization.
Thus, the ANOVA and GRG outcomes should be seen as complementary rather than contradictory: ANOVA isolates factor significance on individual responses, while GRG identifies the factor most critical in achieving a balanced performance–emission compromise. This reinforces the value of integrating Taguchi, CRITIC, and GRA for complex engine optimization problems.
4.5 Confirmation experiment and validation of optimal conditions
To validate the efficacy of the proposed integrated Taguchi–CRITIC–GRA optimization framework, a confirmation experiment was performed using the optimal combination of input parameters as identified through the Grey Relational Grade (GRG) analysis. It is crucial to note that this ideal set of parameters was not included in the original L9 orthogonal array, highlighting the suggested methodology's capacity for prediction outside of the experimental matrix.
4.5.1 Optimal parameter settings based on GRG analysis
•Engine Load: 100% (Level 3)
•HCNG Blend Ratio: 30% H₂ by volume (Level 3)
•Equivalence Ratio (ϕ): 0.952 (Level 1)
These parameters represent the combination identified to offer the best trade-off between performance and emissions based on the calculated Grey Relational Grade (GRG) values. Table 10 shows the comparison of results obtained from the validation experiment and GRG values for output parameters.
Table 10. Comparison table of GRG and output parameters
|
|
Initial |
Predicted |
Experimental |
|
L1B1P1 |
L3B3P1 |
L3B3P1 |
|
|
BMEP |
3.77 |
- |
7.50 |
|
BSFC |
264.67 |
- |
211.33 |
|
NOx + NMHC |
107.77 |
- |
66.30 |
|
CO |
45.36 |
- |
32.80 |
|
GRG |
0.08135 |
0.1192 |
0.1216 |
A validation experiment was carried out to evaluate the predictive accuracy of the Taguchi-based GRA optimization. The initial trial, conducted at Load = 50%, Blend = 18%, and ϕ = 0.952 (L1B1P1), yielded a GRG of 0.08135. Based on the optimization procedure, the predicted optimal settings were Load = 100%, Blend = 30%, and ϕ = 0.952 (L3B3P1), with a predicted GRG of 0.1192.
A confirmation experiment was conducted twice at these optimal settings to ensure repeatability, and the average of the measured responses was taken. The experimental GRG was observed to be 0.1216, indicating excellent agreement with the prediction.
•The percentage error between predicted and experimental GRG was only 2.01%, demonstrating the high predictive reliability of the model.
•The percentage improvement in GRG from the initial setting to the confirmed optimal condition was a significant 49.48%, reflecting a substantial enhancement in the combined engine performance and emission characteristics.
These results not only affirm the statistical accuracy of the GRG model but also validate the robustness of the Taguchi–CRITIC–GRA methodology for complex, multi-response optimization in HCNG-fueled engine systems.
This study demonstrated the application of an integrated Taguchi–CRITIC–GRA framework for optimizing the performance and emissions of a multi-cylinder HCNG engine. Using a Taguchi L9 orthogonal design, three key control factors like engine load, HCNG blend ratio, and equivalence ratio (ϕ) were evaluated systematically. The CRITIC method objectively determined the weights of the output parameters, and Grey Relational Analysis (GRA) consolidated multiple responses into a single performance index (GRG).
The optimization identified the optimal setting as 100% load, 30% H2 blend, and ϕ = 0.952, at which the confirmation experiment achieved a 49.48% improvement in GRG compared to the baseline. The deviation between predicted and experimental GRG was only ~2%, confirming the robustness of the integrated methodology.
Overall, the study highlights that combining Taguchi with CRITIC and GRA offers a transparent, statistically grounded, and computationally efficient tool for resolving complex multi-objective trade-offs in alternative fuel engines. Beyond HCNG, the methodology provides a transferable framework for optimization in other energy and combustion applications where performance and emissions must be balanced simultaneously.
The findings of this study confirm the potential of the integrated Taguchi–CRITIC–GRA methodology in achieving a balanced multi-objective optimization for HCNG-fuelled multi-cylinder engines. However, several avenues remain open for further investigation.
First, while this work utilized steady-state test points from the ISO 8178 three-mode cycle, future research should extend the analysis to transient operating conditions, reflecting real-world driving profiles. Validating the resilience of the optimized settings under realistic duty cycles will be made easier by incorporating dynamic load fluctuations, acceleration, and deceleration phases.
Second, the influence of higher hydrogen blending ratios (>30% v/v) merits exploration, particularly in combination with advanced ignition control strategies, Exhaust Gas Recirculation (EGR), and Variable Valve Timing (VVT), which could further reduce NOx without compromising power output.
Third, advanced statistical and computational intelligence methods, such as hybrid machine learning–Taguchi frameworks or deep learning-based surrogate models, could be integrated to capture nonlinear relationships more effectively and enable real-time optimization.
One limitation of the Taguchi method is that it primarily focuses on estimating main effects of control factors and does not explicitly model interaction effects between parameters. In multi-cylinder engines, interactions such as load x ϕ coupling or blend x load effects may influence combustion stability and emissions. However, the primary aim of this study was to establish the dominant factors and optimal levels for overall performance-emission balance, for which the L9 orthogonal array provides a statistically efficient framework.
Future work could incorporate larger orthogonal arrays (L18 or L27) or apply Response Surface Methodology (RSM), Full Factorial Designs, or machine learning-based surrogate models to explicitly capture these nonlinear interactions. Such approaches would allow the quantification of second-order and interaction effects while building upon the trends established in this study.
Finally, long-term durability testing under optimized HCNG operating conditions should be conducted to assess impacts on component wear, lubrication, and emissions control systems, thereby supporting the pathway toward sustainable large-scale HCNG deployment in commercial transport sectors.
|
ANOVA |
Analysis of Variance |
|
BMEP |
Brake Mean Effective Pressure |
|
BSFC |
Brake Specific Fuel Consumption |
|
CI |
Confidence Interval |
|
CNG |
Compressed Natural Gas |
|
CO |
Carbon Monoxide |
|
CRITIC |
Criteria Importance Through Intercriteria Correlation |
|
DOE |
Design of Experiments |
|
EGR |
Exhaust Gas Recirculation |
|
GRA |
Grey Relational Analysis |
|
GRC |
Grey Relational Coefficient |
|
GRG |
Grey Relational Grade |
|
HCNG |
Hydrogen-Enriched Compressed Natural Gas |
|
MSNR |
Multiple Signal-to-Noise Ratio |
|
NMHC |
Non-Methane Hydrocarbons |
|
NOx |
Nitrogen Oxide |
|
SD |
Standard Deviation |
|
S/N |
Signal-to-Noise Ratio |
|
THC |
Total Hydrocarbons |
|
Greek symbols |
|
|
$\xi$ |
Distinguishing coefficient in Grey Relational Analysis |
|
$\sigma_{\mathrm{j}}$ |
Standard deviation of the jth criterion |
|
ϕ |
Equivalence Ratio |
|
$\xi$ |
Distinguishing coefficient in Grey Relational Analysis |
[1] Lather, R.S., Das, L.M. (2019). Performance and emission assessment of a multi-cylinder SI engine using CNG & HCNG as fuels. International Journal of Hydrogen Energy, 44(38): 21181-21192. https://doi.org/10.1016/j.ijhydene.2019.03.137
[2] Ma, F., Wang, M., Jiang, L., Deng, J., Chen, R., Naeve, N., Zhao, S. (2010). Performance and emission characteristics of a turbocharged spark-ignition hydrogen-enriched compressed natural gas engine under wide open throttle operating conditions. International Journal of Hydrogen Energy, 35(22): 12502-12509. https://doi.org/10.1016/j.ijhydene.2010.08.053
[3] Yuce, B.E., Oral, F. (2024). Multi objective optimization of emission and performance characteristics in a spark ignition engine with a novel hydrogen generator. Energy, 289: 129957. https://doi.org/10.1016/j.energy.2023.129957
[4] Lakshmi, R.V., Teja, G.D., Mudidana, R.K., Sagari, J. (2024). Optimization of performance and emission parameters of biodiesel with additives using Taguchi and grey relational analysis. Engineering Proceedings, 66(1): 15. https://doi.org/10.3390/engproc2024066015
[5] García, A., Javier-López, J., Monsalve-Serrano, J., Iñiguez, E. (2025). Optimization methodology combining Taguchi design and response surface method to maximize a compression ignition engine efficiency fueled with oxygenated synthetic fuel. Fuel, 381: 133372. https://doi.org/10.1016/j.fuel.2024.133372
[6] Karnwal, A., Hasan, M.M., Kumar, N., Siddiquee, A.N., Khan, Z.A. (2011). Multi-response optimization of diesel engine performance parameters using thumba biodiesel-diesel blends by applying the Taguchi method and grey relational analysis. International Journal of Automotive Technology, 12(4): 599-610. https://doi.org/10.1007/s12239-011-0070-4
[7] Zareei, J., Rohani, A. (2020). Optimization and study of performance parameters in an engine fueled with hydrogen. International Journal of Hydrogen Energy, 45(1): 322-336. https://doi.org/10.1016/j.ijhydene.2019.10.250
[8] Li, J., Wan, T., Huang, H., Chen, G., Liang, J., Lei, B. (2023). Prediction and verification of performance and emission characteristics of diesel/natural gas dual-fuel engine based on intelligent algorithm. ACS Omega, 8(20): 18212-18224. https://doi.org/10.1021/acsomega.3c01636
[9] Bhatt, A.N., Shrivastava, N. (2022). Application of artificial neural network for internal combustion engines: A state of the art review. Archives of Computational Methods in Engineering, 29(2): 897-919. https://doi.org/10.1007/s11831-021-09596-5
[10] Wang, H., Ji, C., Shi, C., Yang, J., et al. (2023). Multi-objective optimization of a hydrogen-fueled Wankel rotary engine based on machine learning and genetic algorithm. Energy, 263: 125961. https://doi.org/10.1016/j.energy.2022.125961
[11] Zbikowski, M., Teodorczyk, A. (2025). Machine learning for internal combustion engine optimization with hydrogen-blended fuels: A literature review. Energies, 18(6): 1391. https://doi.org/10.3390/en18061391
[12] Shigemoto, A., Inoda, Y., Ukai, C., Higo, T., Oka, K., Sekine, Y. (2024). Electric field-assisted NSR process for lean NOx reduction at low temperatures. Chemical Communications, 60(12): 1563-1566. https://doi.org/10.1039/D3CC05189G
[13] Karczewski, M., Szamrej, G., Chojnowski, J. (2022). Experimental assessment of the impact of replacing diesel fuel with CNG on the concentration of harmful substances in exhaust gases in a dual fuel diesel engine. Energies, 15(13): 4563. https://doi.org/10.3390/en15134563
[14] Diakoulaki, D., Mavrotas, G., Papayannakis, L. (1995). Determining objective weights in multiple criteria problems: The critic method. Computers & Operations Research, 22(7): 763-770. https://doi.org/10.1016/0305-0548(94)00059-H
[15] Deng, J.L. (1982). Control problems of grey systems. Systems & Control Letters, 1(5): 288-294. https://doi.org/10.1016/S0167-6911(82)80025-X
[16] Mahmoudi, A., Javed, S.A., Liu, S., Deng, X. (2020). Distinguishing coefficient driven sensitivity analysis of GRA model for intelligent decisions: Application in project management. Technological and Economic Development of Economy, 26(3): 621-641. https://doi.org/10.3846/tede.2020.11890
[17] Wu, D., Wang, N., Yang, Z., Li, C., Yang, Y. (2018). Comprehensive evaluation of coal-fired power units using grey relational analysis and a hybrid entropy-based weighting method. Entropy, 20(4): 215. https://doi.org/10.3390/e20040215
[18] Saeheaw, T. (2022). Application of integrated CRITIC and GRA-based Taguchi method for multiple quality characteristics optimization in laser-welded blanks. Heliyon, 8(11): e11349. https://doi.org/10.1016/j.heliyon.2022.e11349
[19] Haq, A.N., Marimuthu, P., Jeyapaul, R. (2008). Multi response optimization of machining parameters of drilling Al/SiC metal matrix composite using grey relational analysis in the Taguchi method. The International Journal of Advanced Manufacturing Technology, 37(3): 250-255. https://doi.org/10.1007/s00170-007-0981-4
[20] Singh, S., Kulshrestha, M.J., Rani, N., Kumar, K., Sharma, C., Aswal, D.K. (2023). An overview of vehicular emission standards. Mapan, 38(1): 241-263. https://doi.org/10.1007/s12647-022-00555-4
[21] Patil, K.R., Khanwalkar, P.M., Thipse, S.S., Kavathekar, K.P., Rairikar, S.D. (2009). Development of HCNG blended fuel engine with control of NOx emissions. In 2009 Second International Conference on Emerging Trends in Engineering & Technology, Nagpur, India, pp. 1068-1074. https://doi.org/10.1109/ICETET.2009.81