Jason Fernando*![]() | Tanty Oktavia
| Tanty Oktavia![]()
© 2025 The authors. This article is published by IIETA and is licensed under the CC BY 4.0 license (http://creativecommons.org/licenses/by/4.0/).
OPEN ACCESS
This research was to evaluate remote assistance applications based on AR technology in terms of user satisfaction. Because user satisfaction is an important factor that needs to be considered in AR applications, the aim is to find out whether the presence of AR technology in telecommunications applications can increase usability and satisfaction when interacting. There are factors tested in the research, namely first impressions, ease of use, integration with the real world, UI design, level of performance and responsiveness, usability and practicality, level of learning, personalization, level of satisfaction, and suggestions for improvisation. The research used 2 methods of data collection, user tests along with interviews plus questionnaires as complementary information to interviews and literature studies with similar research. From the literature study that has been carried out, there are factors that can still be considered when integrating AR technology into remote assistance applications, then also add the results of user tests carried out on one of the remote assistance applications that use AR technology and continue with interviews that add information. new impact of AR technology in remote assistance applications. Plus, by using the User Experience Questionnaire (UEQ).
augmented reality, user experience, telecommunications
Augmented Reality (AR) is a result of technological advancements that integrate virtual information with the physical world through techniques such as 3D modeling, real-time tracking, and intelligent interaction. Its primary purpose is to merge digital content—such as text, images, and 3D models—with real-world environments, thereby enhancing the amount and quality of information available to users in real time [1]. In recent times, AR technology has developed very rapidly, which was initially only theoretical to becoming a product that is produced on a large scale that bridges the real world with the digital world. Based on data obtained from Bejinaru and Toma [2] the number of mobile AR technology users has grown annually from 2019 to around 0.44 billion and is predicted to reach 1.73 billion users in 2024.
Laugwitz et al. [3] developed the User Experience Questionnaire (UEQ) by initially analyzing 86 questionnaire items tested on six different products. The questionnaire was designed to include variables that directly measure user appeal, as well as variables assessing product quality based on key influencing aspects. Based on this framework, the items were grouped into two sets. The first set captures pure emotional responses—such as acceptance or rejection—without further qualification (e.g., good/bad or pleasant/unpleasant). This set accounts for 60% of the observed data variance and represents a single factor known as attractiveness, which is measured using six indicators. The second set explains 54% of the observed variance and includes five distinct factors: perspicuity, dependability, efficiency, novelty, and stimulation.
According to Martins and Riyanto [4], companies that prioritize user satisfaction understand that users purchase not only the product itself but also the emotional experience associated with it. Their research also highlights that poor product quality can lead to user dissatisfaction, which may extend beyond the individual user and influence the perceptions of others.
With the concept of user-centered design that has been developed, users expect the remote assistance process to be more personal according to the preferences and needs of the user. User experience is one of the important factors that need to be considered when designing mobile AR according to recent study by Arifin et al. [5]. The emergence of AR has the potential to change user interactions by offering dynamic, personal, and immersive, but understanding of these changes’ impacts on usability and user satisfaction is still very minimal. Technology must be able to last long enough, have a fast response time, and be easy to use based on research written by Hellsten et al. [6]. Coupled with an understanding of how users see and adapt to the appearance of remote assistance that has been enhanced using AR is very important to predict the level of use of this technology and ensure that this technology can continue to run in the future. When applying technology that can improve UX, one should not only focus on satisfying consumers' desire to find new things but also consider how the technology can improve and provide more value to consumers [7]. Cherukuri [8] stated that with the current 5G technology, AR has the potential to change the remote assistance communication process by using 3D holographic displays that can change the way humans communicate and interact.
In previous studies, the application of AR in the education industry, medicine, and other fields were discussed. Bhanu et al. [9] stated that in increasing work efficiency by reducing working time and minimizing errors. Research written by Obermair et al. [10] stated that AR remote assistance can potentially reduce errors when making repairs. Živičnjak et al. [11] also did a research on AR technology application for warehouse system and stated that AR application can support business activity, resulting in more efficient and improved workflow. AR technology in remote assistance has features like telecommunication applications in general such as video calls, chatting, and others, but the main feature is AR technology itself which is expected to increase user satisfaction when communicating using the application. The application of AR technology in remote assistance has the potential to have a positive impact on workers who need help or training. AR technology can improve long-distance collaboration to increase work efficiency, plus AR is able to produce more intuitive and immersive data visuals, in addition AR can also improve the training process because users can learn in simulations that are like the real world plus visual overlays and interactive training to improve the learning process experience as claimed by Kassis et al. [12].
With the development of AR technology in remote assistance applications in the communications industry, it is necessary to balance it with research that aims to evaluate whether the use of AR technology in remote assistance applications has met user satisfaction. Similar research has been conducted by Qatrunada et al. [13] on AR technology as an interactive learning tool, which states that AR technology has the potential to help make the learning process more enjoyable, improve personal learning processes, and improve the quality of education. This has certainly been applied in other industries such as the communications industry, but this still requires evaluation regarding the use of AR technology in remote assistance applications to increase user satisfaction. Based on the Scopus database, the level of research on the level of satisfaction with AR technology has not been explored further.
With the existing problems and opportunities, this researcher aims to evaluate the use of AR technology in remote assistance in the communications industry to increase user satisfaction. The target of this research is users who live in metropolitan cities with SES B-A economy and the range of age 25-34 and 35-44 who are accustomed with technology itself.
2.1 Augmented Reality (AR)
AR was first introduced in 1992 by Preston Caudell, who developed an AR application for visualizing diagrams in industrial settings, as noted by Arena et al. [14]. While definitions of AR have evolved over time, one of the most widely accepted frameworks is proposed by Paul Milgram and Fumio Kishino. They conceptualize a continuum of realities ranging from the real world to the fully virtual environment. This continuum includes four key categories: Real Environment (RE), AR, Augmented Virtuality (AV), and Virtual Reality (VR), illustrating the gradual transition from physical to digital experiences, as shown in Figure 1.
Figure 1. Various types of reality
In making AR, there are several important components such as Intelligent display technology, 3D registration technology, and intelligent interaction technology [1].
2.2 User experience
According to Wang et al. [15], user Experience is a cognitive impression of people towards the products, systems, or services they use or hope to use. Understanding the goals of users and making users have a sense of seeing and predicting what will happen while using the product can reduce the cognitive differences between users and creators. Feelings, perceptions, and responses are involved in user experience asserted by Ebrahimabad et al. [16]. In user experience, there is a framework that can help the research and design process which is commonly called user centered design (UCD). Research conducted by Derisma and Hersyah [17] on the use of AR in learning 4.0—evaluated using the UEQ—concluded that AR can enhance effectiveness and support the learning process.
2.3 User interface
Of course, one of the important parts of a User Experience (UX) is the User Interface (UI) which can support the product to achieve the set UX target. The User Interface itself can be said to be an interaction between the product and the user through techniques or commands to use tools, enter data, and use the content in the product based on reference [18]. In designing a good UI, UI principles are needed so that a design can be easily understood by users, there are 6 fundamental principles in a UI, namely clarity, flexibility, efficiency invisibility, instant feedback, and user control according to Hotjar [19]. An interface design principle that stray away from existing system can cause mental load, impeding user ability to learn and use the application effectively stated by Nordby et al. [20].
This research will use interviews plus questionnaires as complementary data. Interview subjects will use purposive sampling and for the questionnaire they will use convenience sampling which is calculated using the Slovin formula with a margin of error of 8% so that the sample obtained is 156. This questionnaire itself will use the UEQ which will be distributed to users who have never used the AR remote assistance application.
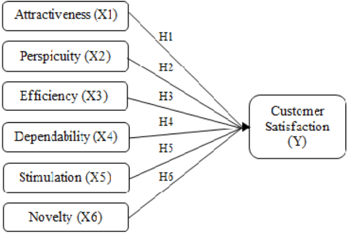
The research model used is the UEQ method which connects UX with Customer satisfaction with the operational table as follows. As illustrated in Figure 2, the following image is the research model that is used in this research.
Figure 2. Research model
Interviews will be conducted as the main data collection process for research targets who have SES B economy, are 25-34 years old, and live in metropolitan cities and researchers will also use the User Experience Questionnaire (UEQ) questionnaire as complementary data for the results of the interviews conducted, literature studies will also be conducted on similar studies to obtain information that can add to the research being carried out. The application that was tested was called Vuforia chalk and they were using their own engine called Vuforia engine. The main features for this application are real-time annotation and 3D overlay.
For the questionnaire used, the researcher used a questionnaire based on UEQ which measures based on attractiveness, perspicuity, efficiency, dependability, stimulation, and novelty. UEQ is used because UEQ has been widely used in previous studies to measure the UX level of an application or product so that UEQ has become a standard for conducting user testing. Measurement using UEQ will begin with distributing questionnaires to participants and after getting the results, the data obtained will be analyzed using Data Analysis Tools which can be obtained from the official UEQ website called the UEQ handbook. The initial stage of data analysis begins with data transformation, where the assessment scale 1-7 is changed to -3 to 3. If the assessment is on the left, then the answer is negative and if the assessment is on the right, then the answer is positive. Here’s how the data transformation looks, shown in Figure 3.
Figure 3. Data transformation
The transformed data produces an average value per individual, each grouped according to the predetermined research scale. Continued with the data inconsistency checking stage where the data obtained from participants will be analyzed whether there are inconsistent answers due to participants who do not understand the questionnaire questions or are not serious when filling out the questionnaire. The last stage is to determine the benchmark that has been adjusted to the UEQ standard. In the benchmark, all variables in UEQ will be measured by finding the average value which will then be adjusted to the 5 standard categories in UEQ, namely Excellent, Good, Above Average, Below Average, and Bad. In Figure 4, it is an example of how UEQ Benchmark look like.
Figure 4. UEQ benchmark
By using qualitative methods, researchers will obtain more subjective and in-depth results so that researchers can understand the participants' thinking patterns.
After the researcher conducted interviews and distributed questionnaires, the researcher obtained information about the UI/UX in the application being analyzed. The aim of this research is to understand whether UI/UX in AR technology integrated into remote assistance applications can increase satisfaction and usability in daily communication activities. This research was designed using qualitative study methods plus quantitative because the researcher wanted to listen to and understand the experiences of the participants themselves when conducting user testing. Interviews were conducted to collect data and questionnaires as complementary data from the interviews. The interview session was conducted online and recorded for transcription purposes, on the other hand, the questionnaire was distributed online through the AR technology community forum.
4.1 Interview
Interviews were conducted with 5 participants who met the problem limitation criteria and were in Jabodetabek. The five participants used different mobile devices with 1 participant using the IOS system and 4 participants using Android. All participants shared their experiences based on the integration of AR technology in one of the remote assistance applications. The five participants had at least one experience of applying AR technology. Interviews were conducted remotely using video calls due to quite busy schedules so interviews using video calls were the best means of conducting interviews. Interview activities carried out with participants have the aim of answering questions for research. This was done to obtain information on whether integrating AR technology into remote assistance applications can increase the usability and satisfaction of interactions. The recorded interviews were transcribed manually to avoid interpretation errors.
The interview questions were divided into 10 question themes regarding the UI and UX of the application being tested, namely first impressions, ease of use, integration with the real world, UI design, level of performance and responsiveness, usability and practicality, level of learning, personalization, level of satisfaction, and suggestions for improvisation. The interview questions are divided in such a way that the results obtained are sequential and clearer. The interview began by asking how much the participants knew about AR technology. In general, all participants had at least heard of or used AR technology once and one of the applications they had used was Pokemon GO. After conducting user testing on the application being tested, interviews began with participants.
The first question given to participants was "first impressions regarding the AR feature in the remote assistance application". The impression that participants got when using AR technology in the remote assistance application was that the AR feature in the remote assistance application was quite interesting and quite useful for certain situations and jobs. The question continued with the ease of using AR technology in the application. The five participants thought that the AR features in the application were easy to understand and use because the participants were already familiar with AR technology, but for AR supporting features such as additional menus to open the chat system and others, participants experienced little Difficulty seeing the menu due to lack of visibility of these options. Quoted from one participant,
"Because I work in a fast-paced and confidential field, the names of participants in call sessions are not immediately visible, which is one of the obstacles in this application."
Other participants also gave similar opinions regarding AR technology and expressed the opinion that,
"I feel stiff when using AR technology in applications and their supporting features, because I don't know what to do."
Although participants' opinions regarding the integration of AR technology in remote assistance applications differed, participants agreed that AR technology in remote assistance applications could be helpful for certain conditions and situations. The application of AR technology in this application to the real world of participants is a source of information as to whether this application can be useful if used in the real world at this time and the results obtained are quite varied as previously mentioned, currently AR technology in remote assistance applications can only be useful. For certain situations or jobs, such as being an event organizer, of course technology like this can help to carry out reviews and surveys of event venues and place event property, but this technology is less useful for participants who work in offices. Participants said that.
"To solve daily problems in my work, I can only solve them with a video call or regular screen share in general."
On the other hand, other participants explained.
"AR technology can help visualize goods or objects and discuss them in real time."
For the UI elements in this AR application, participants said that all the elements were quite clear and could be understood directly, but as mentioned previously, participants had a little difficulty finding menu elements, plus one participant said that the display was too minimalist which made the application less attractive to look at. Below is the screenshot of how the visual and the UI Element look like in the application.
Researchers continued to ask participants questions regarding the performance and level of responsiveness of the applications being tested. Of the five participants, 4 participants were unable to use the AR feature when given a host to screen share from the participant's mobile device and the four participants used an Android system. One participant also said that when the participant was collaborating with researchers to use AR technology, the participant's mobile device overheated. When the researcher who hosted and screen shared with the four participants, they said that the AR feature was quite responsive even though there were parts of the 3D scan that were not quite right, so the image did not stick to the 3D object. 1 participant using the IOS system can use AR technology when the participant has a host for screen sharing. Participants who used the IOS system did not experience any problems when testing AR technology. On the other hand, participants had concerns about the security of the AR application because researchers could control the features of the participant's mobile device without the participant's knowledge and vice versa. In Figure 5, we can see how the UI and the visual look like in the application.
Figure 5. Visual and UI element
In the process of testing the AR application, participants did not feel that there was anything new that could be learned or elements that would help participants to use AR features so that if the user of the application was a user who had little knowledge about AR, they would experience little difficulty in using the application being tested. Personalization was also found in the application being tested, although it was only limited to changing colors, but this feature did not make some participants satisfied. On the other hand, one participant argued that if participants could change colors continuously it would make the collaboration process confusing. On a scale of one to ten for the level of satisfaction with AR technology in the applications being tested, the five participants varied but some were similar. The first participant gave a score of 7, the second participant gave a score of 4, the third and fourth participants gave a score of 7, and the last participant gave a score of 6. Participants also wanted additional features such as being able to place a model of an object and adding a face cam feature in the application as well as improvements to problems regarding performance for several mobile devices, then the participant also continued that he wanted to provide additional indicators for each user when collaborating so that users know who is active on the screen
4.2 Questionnaire
UEQ questionnaire containing 26 questions was distributed through forums and AR communities until the specified number of respondents was obtained, namely 156 respondents who had used AR technology. The questionnaire was distributed using the Google Form platform to make it easier to obtain data that was continued into the analysis data provided on the UEQ website itself. After obtaining the specified number of respondents, the data obtained was then entered into the analysis data.
The initial stage carried out was to transform the 156 data obtained into analysis data so that it changed to -3 to 3 and obtained scale means per person. Continued by determining the mean of the data obtained so that the UEQ scales data (mean and variance) were obtained, then the data was visualized with an indication that -3 indicated very bad and +3 very good. As indicated in Figure 6, this is the visualization of the UEQ Scales data.
Figure 6. Data visualization
Judging from the visual data obtained, the Augmented Reality (AR) feature in remote assistance technology tends to have a positive impact although not too large, on the other hand there are also several factors that tend to be negative.
Not only from UEQ Scales, but the data is also processed in the Benchmark which is visible after the data is entered into the analysis data. Based on the means obtained, the 6 main factors tested obtained results with a dominant bad and one below average. With the results that were obtained, therefore this is the Benchmark Visualization of it, referring to Figure 7.
Figure 7. Benchmark visualization
With the existing benchmark results, it can be said that the 6 indicators tested still do not have a good impact on user satisfaction when using it currently. At the end of the questionnaire, respondents also provided opinions and suggestions that could be added to the AR feature, such as adding a control feedback feature so that users get clarity on the response when used, improving the UI display on the AR feature so that it is more user-friendly for new users, the automatic marker feature can also help users to minimize errors that occur. According to respondents, the AR feature in the remote assistance application has a sufficient impact on work activities, but on the other hand there are also types of work that are not suitable for this AR feature.
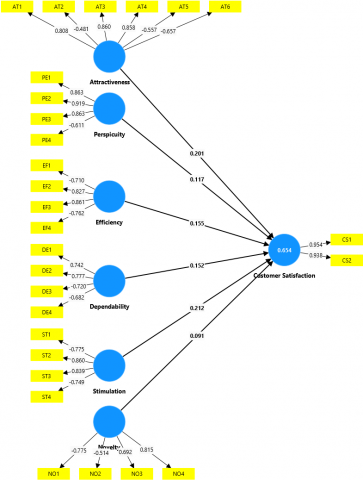
Depicted in Figure 8, the questionnaire data processing process is continued by entering it into SMARTPLS to test the hypothesis according to the selected research model and then processed using bootstrapping. Based on the research model, the processed data can be seen from the image below.
Figure 8. SMARTPLS research model
After being processed through bootstrapping, the path coefficient and path value were obtained for each indicator tested in this study. Starting with the attractiveness indicator > customer satisfaction with a path coefficient of 0.201 and a path value of 0.086, dependability > customer satisfaction with a path coefficient of 0.152 and a path value of 0.251, efficiency > customer satisfaction with a path coefficient of 0.155 and a path value of 0.186, novelty > customer satisfaction with a path coefficient of 0.091 and a path value of 0.327, perspicuity > customer satisfaction with a path coefficient of 0.117 and a path value of 0.226, and stimulation > customer satisfaction with a path coefficient of 0.212 and a path value of 0.121. All the variables that were tested have value above 0.05 which indicates strong relationship between each variable.
Since all the path coefficient values obtained are closer to +1, it can be said that all indicators have a sufficient role in user satisfaction when using the AR feature. On the other hand, the alpha value is also determined by 0.05 and the p-value obtained for each indicator is above 0.05. Thus, it can be concluded that the hypothesis stating that the indicator has an influence on user satisfaction or h0 is accepted, on the other hand h1 which states that the indicator used has no impact is rejected. If these results are compared with previous studies as written in Supporting tailor ability in augmented reality based remote assistance in the manufacturing industry: A user study by Rasmussen, Gronbaek, and Huang and then this is in line and has the potential to be developed with the note that adjustments are needed in the field of work.
The impact on user satisfaction has different levels, where novelty is the indicator that has the most impact on user satisfaction and attractiveness has the least impact. The data is also tested for validity and reliability, for data reliability it can be seen from the composite reliability and each indicator is above 0.7 so it can be said that the data obtained is quite reliable. Continued by calculating the validity of the data which is also calculated using the Heterotrait-monotrait ratio (HTMT) on SMARTPLS and obtained 19 valid variables from the 29 variables tested, as shown in Figure 9.
Figure 9. Heterotrait-monotrait ratio (HTMT)
For further research, it is expected that researchers can invest their time in research on the development of AR technology in remote assistance applications, especially focusing on the development of innovations such as UX optimization, development costs, and the development of the application itself. Technology companies must also be able to help and support the use of AR in remote assistance applications so that users become more familiar with existing technology.
This study attempts to examine how the Augmented Reality (AR) feature influences user satisfaction in remote assistance applications. Based on the results obtained, the researcher concluded that:
• Although the AR feature has the potential to help users in carrying out work activities, not all fields can apply it. For appropriate fields of work, this will certainly be very helpful in the future if users feel comfortable and easy to work using the AR features provided.
• There are still many obstacles in the AR feature itself that still need to be fixed and other features that can be added to AR itself to maximize user satisfaction. By focusing, improving and adding features provided by users, the AR feature in the remote assistance application will increase user's performance process.
This certainly still requires further and periodic research to get more accurate and maximum results. For further research, it can be more focused on several things such as additional features in the application, application compatibility with smartphones and the level of user understanding. Further research should develop this research by reaching other factors that influence the level of user satisfaction with the AR feature in the remote assistance application.
No potential conflict of interest was reported by the authors. No funding is sourced for this research. Author Contributorship: Jason Fernando - Conceptualization, Formal Analysis, Investigation, Methodology, Resources, Visualization, Writing and Editing; Tanty Oktavia - Conceptualization, Formal Analysis, Project Administration, Validation and Review. Data Availability: The authors demonstrate commitment to data openness and transparency. To facilitate further research, we have made the data used in their study publicly available. Data supporting this study is available from Zenodo at doi.org/10.5281/zenodo.15361849.
[1] Chen, Y., Wang, Q., Chen, H., Song, X., Tang, H., Tian, M. (2019). An overview of augmented reality technology. Journal of Physics: Conference Series, 1237(2): 022082. https://doi.org/10.1088/1742-6596/1237/2/022082
[2] Bejinaru. R., Toma. M.V. (2024). Proceeding of the international conferences on business excellence, AR technology potential for facilitating access to advanced education for students with ASD. Proceedings of the International Conference on Business Excellence, 18(1): 1848-1856. http://dx.doi.org/10.2478/picbe-2024-0155
[3] Laugwitz, B., Held, T., Schrepp, M. (2008). Construction and evaluation of a user experience questionnaire. In 4th Symposium of the Workgroup Human-Computer Interaction and Usability Engineering of the Austrian Computer Society, USAB 2008, Graz, Austria, pp. 63-76. https://doi.org/10.1007/978-3-540-89350-9_6
[4] Martins, M.A.J., Riyanto, S. (2020). The effect of user experience on customer satisfaction on Netflix streaming services in Indonesia. International Journal of Innovative Science and Research Technology, 5(7): 573-577. https://doi.org/10.38124/IJISRT20JUL545
[5] Arifin, Y., Sastria, T.G., Barlian, E. (2018). User experience metric for augmented reality application: A review. Procedia Computer Science, 135: 648-656. https://doi.org/10.1016/j.procs.2018.08.221
[6] Hellsten, J., Knape, A., Simberg, S. (2018). User experience in mobile augmented reality applications: The digital native perspective. Bachelor thesis, University of Boras.
[7] Flavián, C., Ibáñez-Sánchez, S., Orús, C. (2019). The impact of virtual, augmented and mixed reality technologies on the customer experience. Journal of Business Research, 100: 547-560. https://doi.org/10.1016/j.jbusres.2018.10.050
[8] Cherukuri. N. (2023). How augmented reality (AR) and 5G could impact telecommunications. https://www.forbes.com/sites/forbestechcouncil/2023/04/06/how-augmented-reality-ar-and-5g-could-impact-telecommunications/?sh=6587cfe25c3b.
[9] Bhanu, A., Sharma, H., Piratla, K., Chalil Madathil, K. (2022). Application of augmented reality for remote collaborative work in architecture, engineering, and construction–A systematic review. Proceedings of the Human Factors and Ergonomics Society Annual Meeting, 66(1): 1829-1833. https://doi.org/10.1177/1071181322661167
[10] Obermair, F., Althaler, J., Seiler, U., Zeilinger, P., et al. (2020). Maintenance with augmented reality remote support in comparison to paper-based instructions: Experiment and analysis. In 2020 IEEE 7th International Conference on Industrial Engineering and Applications (ICIEA), Bangkok, Thailand, pp. 942-947. https://doi.org/10.1109/ICIEA49774.2020.9102078
[11] Živičnjak, M., Rogić, K., Bajor, I. (2025). Augmented reality technologies application in the warehouse system. Transportation Research Procedia, 83: 35-42. https://doi.org/10.1016/j.trpro.2025.02.007
[12] Kassis. R.E., Ayer. S.K., Asmar. M.E. (2023). Augmented reality applications for synchronized communication in construction: A review of challenges and opportunities. Applied Sciences, 13(13): 7614. https://doi.org/10.3390/app13137614
[13] Qatrunada, M.I., Harasta, M.F.S., Tosofu, I. (2022). Utilization of augmented reality technology as an interactive learning media. International Journal of Research and Applied Technology, 2(1): 188-195. https://doi.org/10.34010/injuratech.v2i1.6917
[14] Arena, F., Collotta, M., Pau, G., Termine, F. (2022). An overview of augmented reality. Computers, 11(2): 28. https://doi.org/10.3390/computers11020028
[15] Wang, R., Zhang, X., Yang, D. (2020). Research on user experience design consistency of internet products based on user experience. Journal of Physics: Conference Series, 1549(3): 032059. 10.1088/1742-6596/1549/3/032059
[16] Ebrahimabad, F.Z., Yazdani, H., Hakim, A., Asarian, M. (2024). Augmented reality versus web-based shopping: How does AR improve user experience and online purchase intention. Telematics and Informatics Reports, 15: 100152. https://doi.org/10.1016/j.teler.2024.100152
[17] Derisma, D., Hersyah, M. (2021). User experience measurement using augmented reality application in learning 4.0. In ICED-QA 2019: Proceedings of the 2nd International Conference on Educational Development and Quality Assurance, ICED-QA 2019, Padang, Indonesia. https://doi.org/10.4108/eai.11-9-2019.2298473
[18] Sharma, V., Tiwari, A.K. (2021). A study on user interface and user experience designs and its tools. World Journal of Research and Review, 12(6): 41-45.
[19] Hotjar. (2022). 6 UI design principles to delight your users every time. https://www.hotjar.com/ui-design/principles/.
[20] Nordby, K., Fauske, J.E., Gernez, E., Mallam, S. (2024). A user interface design framework for augmented-reality-supported maritime navigation. Journal of Marine Science and Engineering, 12(3): 505. https://doi.org/10.3390/jmse12030505