Mohammed Riyadh Y. Al-Fakhar![]() | Ahmed Nasser B. Alsammak*
| Ahmed Nasser B. Alsammak*![]()
© 2025 The authors. This article is published by IIETA and is licensed under the CC BY 4.0 license (http://creativecommons.org/licenses/by/4.0/).
OPEN ACCESS
Distance relays are among the most significant components of electrical protection systems since their function is based on detecting the apparent impedance between the relay and the fault location in order to locate and isolate it rapidly. However, distance relays may encounter considerable hurdles as a result of power swings, which are caused by sudden and severe disturbances in large grids, such as faults or unexpected heavy load changes. A complex network of generators, transmission lines, transformers, and loads make up the power systems that serve as the basis for distance relays. However, the operational stability of these systems is heavily reliant on constantly balancing generation and loads. This paper investigates the impact of power swings on impedance distance relay performance. It gives a solution to keep the system in a stable region by monitoring the impedance trajectory and determining the change in time of crossing the suggested stability limit curve and the relay-characterized area. The research strategy proposes the use of three times out of four, which are the times of intersection of the measured instantaneous impedance path (trajectory) with the proposed stability curve and with the characteristics of the impedance distance relay, where the time difference (T3-T2) indicates the sensitivity to faults and the difference (T4-T2) gives a clear indication of stability. The results give a good indication to avoid unstable circumstances, with a time difference of 70–90 ms between T4 and T2 in critical power swing cases, depending on fault location and resistance.
power swing, distance relay, impedance distance relay, transmission lines, protection, prevention of power swing, impedance trajectory
Stability is essential to ensure system reliability. Balanced power flow between load and generation is maintained in a steady state. Conversely, transient stability is the capacity of synchronous generators to remain in synchronism with the system during major faults or disruptions such as generator disconnection, line switching, or excessive loads. These occurrences may lead to power fluctuations [1, 2]. Therefore, upsetting the balance between load and generation is needed. At the same time, protection relays such as distance and overcurrent should clear the fault quickly to keep the swings stabilized [3, 4].
On the other hand, if swing oscillations do not stop, the system becomes unstable and causes an out-of-sequence state [5, 6]. Faults are distinguished from power swings based on the rate of change of electrical characteristics, despite the fact that conventional methods, such as concentric circles and blinders, cannot distinguish between faults and rapid changes based on local information [7].
One of the famous and most common uses of FACTS devices is the static synchronous compensator (STATCOM), which has presented further difficulties in relay response accuracy. In order to increase relay response, studies have suggested using fuzzy logic [8]. Relay settings have been changed to address these impacts since devices like UPFC (Unified Power Flow Controller) also affect impedance, producing performance problems [9]. Devices like SVC (Static Var Compensator) based on fuzzy logic have been shown to outperform other approaches in boosting transient stability [10]. An innovative method based on the Improved Deep Neural Network (IDNN) has been proposed to prevent the maloperation of the zone 3 distance relay during power swings. By processing voltage and current signals using the Improved Discrete Wavelet Transform (IMDWT), the system detects power swings and ensures the correct operation of the relay [11]. Hybrid renewable energy systems, such as solar and wind, help increase voltage stability and minimize losses [12]. As a literature review, through time, many attempts to introduce the effect of adding new systems, such as Flexible Alternating Current Transmission Systems (FACTS) and renewable energy, in addition to the use an intelligent technologies such as Neural Networks (NNs), Fuzzy Inference System (FIS), or maybe adaptive between them ANFIS [13].
To reduce the impact of UPFC on the measured relay impedance while ensuring quicker and more accurate fault rate detection, a novel relay design using fuzzy logic has been proposed [14]. From another perspective, another study presented the challenge of differentiating between electrical network modes in relay protection systems using deep learning. It highlights how machine learning algorithms, with rewritable memory, offer a more flexible and efficient solution compared to traditional methods that use fixed operation characteristics [15].
While using multi-mass steam turbines during significant changes increases power stability by avoiding loss of synchronism [16], hybrid renewable systems help to lower oscillations during crises [17]. Though its primary disadvantage is detection latency during three-phase faults, power swing blocking (PSB) based on swing center voltage has been established to differentiate between faults and power swings [18, 19]. Although high-frequency sampling is necessary for successful implementation, signal processing techniques like FFT (Fast Fourier Transform) and wavelet-based algorithms are used for power swing detection [20, 21]. Investigated for systems linked to distributed generation is discrimination between strong fault resistance and power swing [22]. Though the need for extensive case studies still presents a difficulty, artificial intelligence methods such as SVM (Support Vector Machine) and ANFIS have been used to enhance fault identification and diagnosis [23-25]. Grid stability and reliability are getting increasingly difficult as smart grids are used. Modern power systems offer real-time data flow by means of synchronized phasor technology (GPS-based PMUs), hence improving decision-making and visualization algorithms. For fault detection and relay blocking/de-blocking, differentiating power coefficients and angular separation methods have been proposed [26]. PMUs are used in a variety of protective applications, including backup systems and fault detection [27, 28]. A PMU-based power swing detector to prevent distance relay maloperation was presented in the study [29]. Phase plane fault detection methods have been applied in large grids [30, 31]. By means of the combination of neural intelligence and fuzzy logic, ANN (Artificial Neural Networks) has been shown to be quicker and more accurate in fault categorization [32].
All the previous works don’t focus on the direct effect of power swings on the impedance trajectory and then distance relay response and also don’t focus on how to avoid instability after fault clearing. The current work used impedance trajectory behavior during faults to forecast large swings that can cause the loss of synchronism and focuses on investigating how power swings affect the impedance distance relay response, especially during three-phase faults and unstable swings cases and gives a suggestion on how to use it, i.e., impedance trajectory to prevent instability occurs.
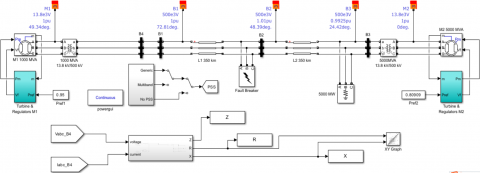
The effect of a power swing on the stability of the system was investigated by using the MATLAB-Simulink model. When sudden and severe changes occur in the system, including faults or abnormal conditions in demand, the power flow between generators and loads may oscillate, a phenomenon known as power swing. This phenomenon directly impacts generator rotor angles, voltages, and frequency stability, as well as control systems such as power system stabilizers (PSS) and automated voltage regulators (AVR) reduce these effects. The test system consists of two synchronous machines connected by three buses, including two power transformers rated at 13.8 kV and 500 kV, respectively.
The system includes a 500 kV, 700 km transmission line. The test system also included two PSSs and two AVRs. The two PPSs can work in multimode operations such as no PSS, Multiband, and Generic. A Generic mode gives good response results in rotor angle stability as compared with other modes, so it is adopted in this work. A 5000 MW pure resistive load is supplied to the system. The pure resistive load was adopted in the simulation because it has the greatest impact on the system, as real power is drawn from the generation units. Also, a capacitor bank can compensate for the reactive power, and all power systems try to reduce supplying it from generation units and passing through the transmission lines. Additionally, the effect of the fault is significantly larger compared to the load values. A measurement block was used to measure the proposed impedance relay voltage and current at Bus 4. The resistance (R) and reactance (X) were then calculated from voltage and current values to determine the impedance.
Figure 1 shows the MATLAB-Simulink model of the test system. The system is made up of a local generating plant (M2) rated at 5000 MVA and a distant generating plant (M1) rated at 1000 MVA, which together provide a 5000 MW completely resistive load that serves as the load center. M1 and M2 have respective output rates of 950 MW and 4046 MW, respectively. The system operates near its Surge Impedance Loading (SIL) of 977 MW with a regulated power flow of 944 MW across the transmission line. In order to maintain stability and peak performance, this provides real power transfer with less reactive power adjustment.
Figure 1. MATLAB-Simulink tested power system
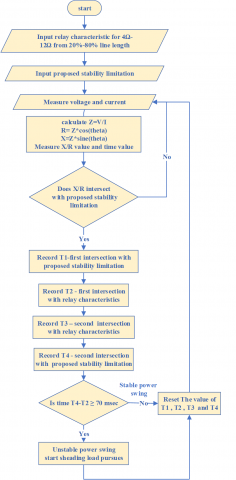
This work proposed a stability constraint line or curve that gives an indicator for a fault occurring. The proposed method starts with fixing the relay characteristics and stability constraint. Then, the X/R ratio, which reveals the relationship between resistance and reactance in the system, is calculated by measuring the voltage and current in the system. In the event of a fault or major disturbance, the X/R value will exceed the stability limits, and the time of the first intersection between X/R and the stability limit will be recorded, denoted as T1. Thereafter, the X/R value will continue to change until it enters the relay characteristic limits. At that point, the time of the first intersection with the relay characteristics is recorded, known as the fault detection time, and denoted as T2. The X/R value continues to change automatically until it exits the relay characteristic limits, at which point the second intersection with the relay characteristics will be recorded, denoted as T3. The difference between T3 and T2 can be used to determine the relay's sensitivity in detecting the fault. During this period, the trip signal for the relay should be issued; if this difference increases, the relay's sensitivity will be increased. The X/R value continues to change automatically until it intersects the stability limit a gain for the second time, at which point the second intersection time will be recorded, denoted as T4. The time difference between T4 and T2, i.e. (T4-T2), is then calculated.
From the simulation results, it is observed that the smallest difference between T4 and T2 for the occurrence of critical oscillation preceding the oscillation that causes loss of synchronization is 70.3 milliseconds, which occurs in the sixth cycle at the lowest expected fault resistance of 4 ohms and a fault location of 80%. Based on this, a value of 70 milliseconds was selected, ignoring the 0.003 milliseconds as it does not significantly affect the decision. If this difference is greater than or equal to 70 milliseconds, which is the proposed stability threshold, then an organized load-shedding procedure will begin to avoid loss of synchronization. If the difference is less than 70 milliseconds, the recorded time values will be reset, and the process will be repeated until the required condition is met. Figure 2 shows these processes as a flowchart.
Figure 2. Overall flow chart for the proposed procedure
A three-bus, two-machine test system, Figure 1, is used to get the results for the proposed protection procedure. Faults were created at various locations along the line between Bus 1 and Bus 2, as shown in Figure 3. The relay characteristics were designed for potential fault resistance values, with the lowest expected fault resistance being 4 Ω and the highest expected fault resistance being 12 Ω. The worst-case scenario for faults, which is a three-phase fault, was examined. It was focused on because it has the greatest impact on the stability of the electrical system, potentially leading to loss of synchronization or significant changes in the system's behavior. Additionally, analyzing three-phase faults provides a deeper understanding of how they affect the overall stability of the system compared to other faults with lesser impact. This fault was implemented using a three-phase fault module in the MATLAB Simulink package. The fault was applied to different system scenarios: The first scenario is a fault resistance of 4 Ω at different locations. It starts from 20% of the line length to 80%, and several periods of fault from 3 cycles to 7 cycles were tested. The second and third scenario involves a fault resistance of 8 Ω and 12 Ω at the same conditions as the first scenario (i.e., fault location and cycle duration). The results for varying fault resistances, line lengths, and fault time durations. In order to elucidate the analysis, the system's behavior and performance in terms of monitoring the impedance path through the distance stage characteristics are demonstrated through the use of numerous graphs. The fault occurring time is 0.5 sec. As a physical explanation, the longer duration of the electrical fault, represented by the number of cycles, the lower impedance value measured by the instruments during the fault equals the fault resistance plus line impedance, represented by the distortion in the impedance path at the far left. When the fault ends, the impedance starts to gradually return to its original value before the fault, causing the impedance path (trajectory) to move towards the stability detection curve but in the opposite direction of the previous one. This change directly affects the time value (T4); as this value increases with the longer duration of the fault due to the impedance path remaining in the fault region, the difference between the values (T4 - T2) will increase significantly.
Figure 3. Faults at various locations
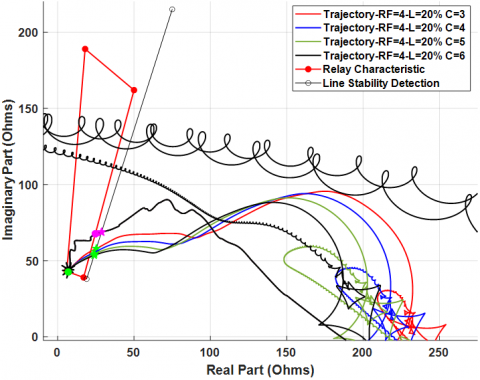
Figure 4 illustrates the time-domain designed impedance relay characteristics of a 700 km transmission line, red colour, which extends from 20% to 80% of the total length of the line and has a quadrilateral shape. The slanted black line represents the proposed stability limit (boundary), which is a key indicator of whether the system is heading toward stable or unstable swing oscillation immediately after the fault occurs. The impedance trajectory response (violet colour) during a fault is the reference signal for the proposed method to detect the fault and whether the system will go to a stable or unstable region. The purple star indicates the first time (T1) crossing the proposed stability line, which is not significant in this analysis. The purple point represents the entry time (T2) of the distance relay characteristics, while the green point represents the exit time (T3) of the distance relay characteristics. The difference between T3 and T2 represents the sensitivity of the distance relay to faults. The green star represents the second intersection time with the proposed stability limit line, and the difference between T4 and T2 will be used to determine the swing oscillation state of the system, whether it is heading towards stable or unstable swing oscillation.
Figure 4. Distance relay characteristic and impedance trajectory with stability limitation
This work investigated in several scenarios the impact of fault resistance (RF) and location on the system responses. Measuring the moment of route entrance (trajectory) inside the relay characteristics reveals that the fault location and resistance affect the fault entry time that is acquired. The proposed scenarios can be summarized in the following points:
Table 1 summarizes the fault analysis results across different locations, showing the impact of fault resistance, location, and duration on system response. The last cycle for each case in this table refers to the cycle where the loss of synchronism occurs.
Table 1. Fault trajectory timing analysis
|
Fault Resistive and Location |
Fault Duration in Cycle |
T4-T2 msec |
T2 msec |
T3 msec |
T4 msec |
T3-T2 msec |
|
4Ω, 20% |
3 |
41.9 |
11.7 |
16.9 |
53.6 |
5.2 |
|
4 |
58.4 |
70.1 |
||||
|
5 |
75 |
86.7 |
||||
|
6 |
91.6 |
103.3 |
||||
|
4Ω, 40% |
3 |
42.2 |
12.2 |
15.9 |
54.4 |
3.7 |
|
4 |
59 |
71.2 |
||||
|
5 |
75.6 |
87.8 |
||||
|
6 |
92.2 |
104.4 |
||||
|
4Ω , 60% |
3 |
42 |
13.1 |
17.3 |
55.1 |
4.2 |
|
4 |
58.7 |
71.8 |
||||
|
5 |
75.4 |
88.5 |
||||
|
6 |
92 |
105.1 |
||||
|
4Ω, 80% |
3 |
20.3 |
35.1 |
35.2 |
55.4 |
0.1 |
|
4 |
37 |
72.1 |
||||
|
5 |
53.6 |
88.7 |
||||
|
6 |
70.3 |
105.4 |
||||
|
7 |
86.9 |
122 |
||||
|
8Ω, 20% |
3 |
40 |
13 |
16.7 |
53 |
3.7 |
|
4 |
56.5 |
69.5 |
||||
|
5 |
73.1 |
86.1 |
||||
|
6 |
89.7 |
102.7 |
||||
|
7 |
106.3 |
119.3 |
||||
|
8Ω, 40% |
3 |
40.1 |
13.9 |
19.7 |
54 |
5.8 |
|
4 |
56.9 |
70.8 |
||||
|
5 |
73.4 |
87.3 |
||||
|
6 |
90.1 |
104 |
||||
|
7 |
106.8 |
120.7 |
||||
|
8Ω, 60% |
3 |
41.1 |
13.7 |
21.2 |
54.8 |
7.5 |
|
4 |
57.7 |
71.4 |
||||
|
5 |
74.4 |
88.1 |
||||
|
6 |
91.1 |
104.8 |
||||
|
8Ω, 80% |
3 |
38.1 |
16.8 |
20.9 |
54.9 |
4.1 |
|
4 |
54.8 |
71.6 |
||||
|
5 |
71.5 |
88.3 |
||||
|
6 |
88.1 |
104.9 |
||||
|
7 |
104.8 |
121.6 |
||||
|
12Ω, 20% |
3 |
37.3 |
14.8 |
15.7 |
52.1 |
0.9 |
|
4 |
53.9 |
68.7 |
||||
|
5 |
70.6 |
85.4 |
||||
|
6 |
87.2 |
102 |
||||
|
|
7 |
103.8 |
118.6 |
|||
|
12Ω, 40% |
3 |
38.7 |
14.9 |
22.8 |
53.6 |
13.9 |
|
4 |
55.3 |
70.2 |
||||
|
5 |
71.9 |
86.8 |
||||
|
6 |
88.6 |
103.5 |
||||
|
7 |
105.3 |
120.2 |
||||
|
12Ω, 60% |
3 |
38.9 |
15.4 |
53.9 |
54.3 |
38.5 |
|
4 |
55.5 |
70.6 |
70.9 |
55.2 |
||
|
5 |
72.2 |
87.3 |
87.6 |
71.9 |
||
|
6 |
89 |
104 |
104.4 |
88.6 |
||
|
7 |
105.7 |
120.8 |
121.1 |
105.4 |
||
|
12Ω, 80% |
3 |
38.7 |
17 |
21 |
54.6 |
4 |
|
4 |
55.5 |
71.3 |
||||
|
5 |
72.2 |
88 |
||||
|
6 |
88.9 |
104.8 |
||||
|
7 |
105.7 |
121.5 |
The following Figures 5-15 show impedance relay characteristics, its trajectories, and the proposed stability limit line for all cases that are explained in Table 1.
Figure 5. Distance relay characteristic and impedance trajectory for 4 Ω fault resistive at 20% from line fault
Figure 6. Distance relay characteristic and impedance trajectory for 4 Ω fault resistive at 40% from line fault
Figure 7. Distance relay characteristic and impedance
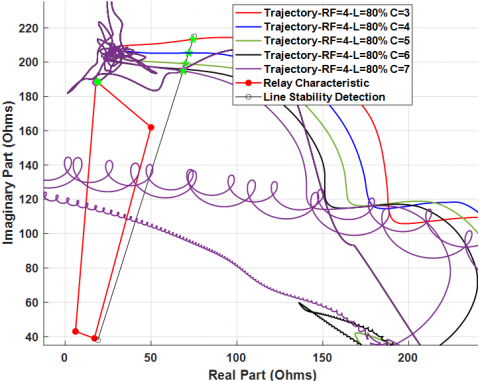
Figure 8. Distance relay characteristic and impedance trajectory for 4 Ω fault resistive at 80% from line fault
Figure 9. Distance relay characteristic and impedance trajectory for 8 Ω fault resistive at 20% from line fault
Figure 10. Distance relay characteristic and impedance trajectory for 8 Ω fault resistive at 40% from line fault
Figure 11. Distance relay characteristic and impedance trajectory for 8 Ω fault resistive at 60% from line fault
Figure 12. Distance relay characteristic and impedance trajectory for 8 Ω fault resistive at 80% from line fault
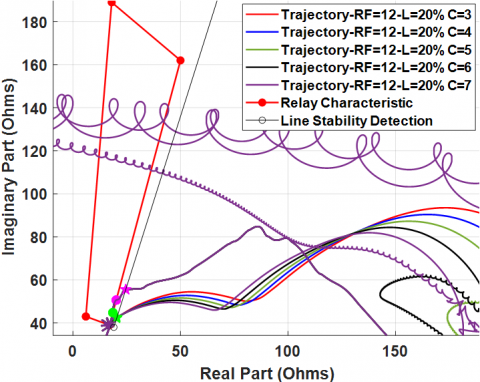
Figure 13. Distance relay characteristic and impedance trajectory for 12 Ω fault resistive at 20% from line fault
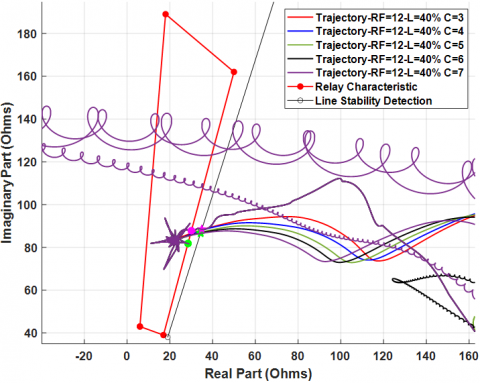
Figure 14. Distance relay characteristic and impedance trajectory for 12 Ω fault resistive at 40% from line fault
Figure 15. Distance relay characteristic and impedance trajectory for 12 Ω fault resistive at 60% from line fault
In all scenarios cases, a quick system response was observed upon fault occurrence. "The appropriate times for transitioning between the different stages within the relay characteristics were determined based on measuring the moments of entry and exit from these characteristics, as well as measuring the dwell times within them. This analysis allows for evaluating the effectiveness of the system's response to the fault, where it is determined whether the times spent by the system within the relay characteristics are sufficient to detect the fault and interact with it correctly. The time associated with the stability detection factor was observed to have different values for each cycle, with this value increasing as the time of failure approached. Therefore, based on the readings, the type of ability power swing, whether stable or unstable, could be predicted. In specific cases, such as at 80% location with 4 Ω resistance, the correct response was not obtained due to the short dwell time.
Figure 16. Distance relay characteristic and impedance trajectory for 12 Ω fault resistive at 80% from line fault, including the new stability-boundary detecting curve
In the case of the 80% site with a fault resistance of 12 Ω, it was found that the intersection with the distortion in the stability detection line resulted in erroneous readings, therefore failing any appropriate reaction for stability detection. In order to avoid any erroneous readings, the stability detection limits in this area were modified, and the ideal scenario was embraced. Figure 16 shows the modified stability-limit line to a new stability-boundary detecting curve, therefore guaranteeing correct readings. No appreciable variations were found; the revised measurements were found to match the predicted results prior to the change. Table 2 describes these readings.
Table 2. Fault trajectory timing analysis for 12 Ω fault resistive at 80%-line fault location before and after modified
|
Adj. Case |
Fault Duration in Cycle |
T4-T2 msec |
T2 msec |
T3 msec |
T4 msec |
T3-T2 msec |
|
Before the modified |
3 |
|
17 |
21 |
27.4 |
4 |
|
4 |
|
|||||
|
5 |
10.4 |
|||||
|
6 |
|
|||||
|
7 |
|
|||||
|
After the modified |
3 |
38.7 |
17 |
21 |
54.6 |
4 |
|
4 |
55.5 |
71.3 |
||||
|
5 |
72.2 |
88 |
||||
|
6 |
88.9 |
104.8 |
||||
|
7 |
105.7 |
121.5 |
This paper presents a new fast protection strategy used to clear faults and dampen the swing oscillations to maintain system stability after a fault occurs based on the follow-the-path of the impedance trajectory response that is associated with the proposed stability curve limits and relay impedance characteristics. The proposed method is based on recording the time of the first touch with relay characteristics during fault occurrence, T2, which is considered an indicator for fault detection. Through the characteristics of the stability boundary curve, the time of the second intersection with the impedance trajectory T4 is recorded, and then the time difference between T4 and T2 is found, which is considered an indicator of system stability. These indicators are fully capable of distinguishing between fault conditions and system stability. Synchronization losses occur between the sixth and seventh cycles, and these losses vary depending on the fault resistance and its location. Loss occurs in the sixth cycle with a fault resistance of 4 ohms between 20% and 60% of the line length and with a resistance of 8 ohms near 60%. And the other cases occur in the seventh cycle. A malfunction occurs at a fault resistance of 4 ohms at 80% of the line length due to the longer time taken to detect the fault, which is 35.1 milliseconds. This requires improving the relay characteristics in this area. Classifying power fluctuations is challenging because the values of R and X are similar throughout the fault period, making it difficult to distinguish between stable and unstable fluctuations. Adjustments to the stability detection limits in certain areas, such as at 80% with a resistance of 12 ohms, improved the accuracy of detecting stability limits. The results after the adjustment were very close to the readings that were expected before the adjustment. The simulation results demonstrated the effectiveness of the proposed strategy method in detecting faults, and if the swing oscillation takes the system to stable or unstable after fault clearing.
The authors would like to express their gratitude to the University of Mosul for their significant support and help throughout this work.
[1] Hamzeh, A., Al-Omari, Z. (2019). Improved model for investigating transient stability in multimachine power systems. Indonesian Journal of Electrical Engineering and Computer Science, 13(1): 368-376. https://doi.org/10.11591/ijeecs.v13.i1.pp368-376
[2] Gunasegaran, M.K., Tan, C., Bakar, A.H.A., Mokhlis, H., Illias, H.A. (2015). Progress on power swing blocking schemes and the impact of renewable energy on power swing characteristics: A review. Renewable and Sustainable Energy Reviews, 52: 280-288. https://doi.org/10.1016/j.rser.2015.07.066
[3] Esmaeilian, A., Kezunovic, M. (2016). Impact of electromechanical wave oscillations propagation on protection schemes. Electric Power Systems Research, 138: 85-91. https://doi.org/10.1016/j.epsr.2016.01.002
[4] Zheng, T., Zhang, R., Lv, W., Liu, S. (2024). Improved time-domain distance protection based on fault active control for long transmission lines of PV/BES hybrid power generation system. International Journal of Electrical Power & Energy Systems, 159: 110049. https://doi.org/10.1016/j.ijepes.2024.110049
[5] Lee, Y.J., Heo, J.Y., Kwon, O.S., Kim, C.H. (2020). A study on an out-of-step detection algorithm using the time variation of complex power: Part I, mathematical modeling. Energies, 13(16): 4065. https://doi.org/10.3390/en13164065
[6] Sorrentino, E., Navas, G., Orea, E. (2018). Effect of an additional large disturbance during power swings on the impedance seen by the out-of-step blocking function. International Journal of Electrical Power & Energy Systems, 99: 79-84. https://doi.org/10.1016/j.ijepes.2017.12.026
[7] Ghalesefidi, M.M., Ghaffarzadeh, N. (2021). A new phaselet-based method for detecting the power swing in order to prevent the malfunction of distance relays in transmission lines. Energy Systems, 12: 491-515. https://doi.org/10.1007/s12667-019-00366-8
[8] Nasser, A., Arkan, S. (2019). Enhancement effects of the STATCOM on the distance relay protection. International Journal of Computer Application, 182(40): 10-14. https://doi.org/10.5120/ijca2019918461
[9] Al-Kaoaz, H.N.A., Alsammak, A.N.B. (2023). Performance enhancement of distance relay in presence of unified power flow controller. International Journal of Power Electronics and Drive Systems (IJPEDS), 14(3): 1577-1588. https://doi.org/10.11591/ijpeds.v14.i3.pp1577-1588
[10] Salleh, Z.M., Alsammak, A.N.B., Mohammed, H.A. (2024). Enhancing power system transient stability using static VAR compensator based on a fuzzy logic controller. Journal Européen des Systèmes Automatisés, 57(6): 1565-1572. https://doi.org/10.18280/jesa.570603
[11] Sriram, C., Somlal, J., Goud, B.S., Bajaj, M., Elnaggar, M.F., Kamel, S. (2022). Improved deep neural network (IDNN) with SMO algorithm for enhancement of third zone distance relay under power swing condition. Mathematics, 10(11): 1944. https://doi.org/10.3390/math10111944
[12] Al-Kaoaz, H.N.A., Alsammak, A.N.B. (2024). The impact of hybrid power generations on a power system's voltage stability. Journal Européen des Systèmes Automatisés, 57(2): 541-549. https://doi.org/10.18280/jesa.570223
[13] Mohammed, H.A., Alsammak, A.N.B. (2023). An intelligent hybrid control system using ANFIS-optimization for scalar control of an induction motor. Journal Européen Des Systèmes Automatisés, 56(5): 857-862. https://doi.org/10.18280/jesa.560516
[14] Alsammak, A.N.B., Al-Kaoaz, H.N.A. (2023). Design of a fuzzy distance relay taking into consideration the impact of using a unified power flow controller. Eastern-European Journal of Enterprise Technologies, 122(5): 6-19. https://doi.org/10.15587/1729-4061.2023.277343
[15] Stepanova, D.A., Naumov, V.A., Antonov, V.I. (2019). Deep learning in relay protection of digital power industry. In 2019 2nd International Youth Scientific and Technical Conference on Relay Protection and Automation (RPA), Moscow, Russia, pp. 1-17. https://doi.org/10.1109/RPA47751.2019.8958378
[16] Hamid, S.F., Alsammak, A.N.B. (2023). The influence of using multi-mass steam turbines on the frequency stability in IEEE 9-bus system. In American Institute of Physics Conference Series, 2834(1): 060007. https://doi.org/10.1063/5.0165912
[17] Al-Kaoaz, H.N.A., Alsammak, A.N.B. (2023). Utilizing hybrid renewable energy systems for enhancing transient stability in power grids: A comprehensive review. Journal Européen des Systèmes Automatisés, 56(4): 687-696. https://doi.org/10.18280/jesa.560418
[18] Çapar, A., Ünverdi, E., Arsoy, A.B. (2020). Performance evaluation of power swing blocking in compensated transmission lines. Journal of Physics: Conference Series, 1457(1): 012005. https://doi.org/10.1088/1742-6596/1457/1/012005
[19] Hou, D., Benmouyal, G., Tziouvaras, D.A. (2005). Zero-setting power-swing blocking protection. In 3rd IEE International Conference on Reliability of Transmission and Distribution Networks (RTDN 2005), Stevenage UK, pp. 249-254. https://doi.org/10.1049/cp:20050047
[20] Taheri, B., Salehimehr, S., Razavi, F., Parpaei, M. (2020). Detection of power swing and fault occurring simultaneously with power swing using instantaneous frequency. Energy Systems, 11(2): 491-514. https://doi.org/10.1007/s12667-018-00320-0
[21] Alsyoufi, Y.R., Hajjar, A.A. (2019). A high-speed algorithm to discriminate between power swing and faults in distance relays based on a fast wavelet. Electric Power Systems Research, 172: 269-276. https://doi.org/10.1016/j.epsr.2019.03.021
[22] Mohamad, N.Z., Abidin, A.F., Musirin, I. (2019). Detection of fault during power swing in test system interconnected with DG. Indonesian Journal of Electrical Engineering and Computer Science, 16(2): 577-585. https://doi.org/10.11591/ijeecs.v16.i2.pp577-585
[23] Ananbeh, O.A., Feilat, E.A., Al Nadi, D.A. (2022). ANFIS based DC offset removal technique for numerical distance relaying. In 2022 International Engineering Conference on Electrical, Energy, and Artificial Intelligence (EICEEAI), Zarqa, Jordan, pp. 1-6. https://doi.org/10.1109/EICEEAI56378.2022.10050497
[24] So, A.Tp., Chan, W.L. (1999). A Review on Artificial Intelligence Methods. In Intelligent Building Systems. Springer, Boston, MA. https://doi.org/10.1007/978-1-4615-5019-8_10
[25] Morais, A.P., Júnior, G.C., Mariotto, L., Marchesan, G. (2015). A morphological filtering algorithm for fault detection in transmission lines during power swings. Electric Power Systems Research, 122: 10-18. https://doi.org/10.1016/j.epsr.2014.12.009
[26] Hari, V., Kumar, D.S., Savier, J.S. (2018). Phasor measurement based fault detection and blocking/de-blocking of distance relay under power swing. In 2018 International CET Conference on Control, Communication, and Computing (IC4), Thiruvananthapuram, India, pp. 134-139. https://doi.org/10.1109/CETIC4.2018.8531024
[27] Chougule, M., Gajjar, G., Soman, S.A. (2019). PMU supervised secure backup protection of distance relays. In 2019 IEEE PES Innovative Smart Grid Technologies Europe (ISGT-Europe), Bucharest, Romania, pp. 1-5. https://doi.org/10.1109/ISGTEurope.2019.8905433
[28] Raza, A., Benrabah, A., Alquthami, T., Akmal, M. (2020). A review of fault diagnosing methods in power transmission systems. Applied Sciences, 10(4): 1312. https://doi.org/10.3390/app10041312
[29] Ouadi, A., Bentarzi, H., Chafai, M. (2016). A new PMU based power swing detector to prevent mal-operation of distance relay. Russian Electrical Engineering, 87(10): 572-578. https://doi.org/10.3103/S1068371216100059
[30] Eissa, M.M. (2019). Developing three-dimensional-phase surface-based wide area protection centre in a smart grid with renewable resources. IET Energy Systems Integration, 1(2): 65-73. https://doi.org/10.1049/iet-esi.2018.0025
[31] Eissa, M.M. (2018). Developing wide area phase plane primary protection scheme “WA4PS” for complex smart grid system. International Journal of Electrical Power & Energy Systems, 99: 203-213. https://doi.org/10.1016/j.ijepes.2018.01.002
[32] Alnaib, I.I., Alsammak, A.N.B., Sabry, S. (2022). Protection relay performance comparison for faults detection and classification based on ANN and ANFIS. In Control, Instrumentation and Mechatronics: Theory and Practice. Singapore: Springer Nature Singapore, pp. 545-555. https://doi.org/10.1007/978-981-19-3923-5_47