Mohammed S. Jarjees*![]() | Basma MK. Younis
| Basma MK. Younis![]() | Ahmed Kh. Younis
| Ahmed Kh. Younis![]()
© 2025 The authors. This article is published by IIETA and is licensed under the CC BY 4.0 license (http://creativecommons.org/licenses/by/4.0/).
OPEN ACCESS
COVID-19 pandemic has caused a global crisis, with widespread loss of life and severe health issues, including lungs damage. COVID-19 diagnosis typically obtains by either chest X-ray images, which require a precise diagnosis, or a polymerase chain reaction test, which needs long-time. Rapid and precise diagnosis is crucial for preserving lives. This study aims to present an efficiently and accurately system that is capable to identify edges in X-ray images, allowing prompt and precise diagnosis. The fuzzy image processing methods is utilized in MATLAB to identify edges of the images. This stage is performed for verification purposes and to compare the findings with hardware platform outcomes. The hardware platform is implemented by High-Level Synthesis technology as a software-platform and the ZYNQ-7000 kit as a hardware-platform. Software and hardware platforms combination produce precise edges and faster processing time compared with the results obtained by MATLAB. Higher degree of similarity between the two proposed approaches for healthy images (87%-98.8%) compared to those for infected images (80%-98.2%) have been obtained. Significant contribution of this study is the inclusion of the PS component on the ZC702 board which enabled the use of floating-point data representation and allowed for fast implementation with minimal resource usage.
chest X-ray images, COVID-19, edge detection, FPGA implementation, fuzzy image processing
The COVID-19 is a transmittable illness arise from "severe acute respiratory syndrome coronavirus2" (SARS-CoV-2) series. COVID-19 causes of closing all daily activities around the world, the request for restrain the epidemic is to be more demand [1, 2]. Therefore, the design and development of computer aided artificial intelligence (AI) algorithms [3] for medical images diagnosis of COVID-19 in a fast and efficient way have been a crucial need for fighting this disease. Radiologists have discovered that by identifying the lung's boundaries on chest X-rays, they can find lung abnormalities linked to COVID-19 and assist physicians in deciding how to treat high-risk COVID-19 patients [4]. To identify the edges of the lung X-rays images, edge detection algorithms which are an important image processing is used to find the boundaries of lung X-rays images. They are distinguished by local or significant changes in the image, and edges typically occur on the boundary between two distinct sections in an image.
Edge is one of the important features that are used to analyse digital images [5, 6]. Various edge detection techniques are available like Robert, Sobel, Prewitt, they are, however, sensitive to noise situations and did not give sharp edges [7]. Studies focus on Fuzzy logic-based edge detection technique due to its immunity to noise and its accurate edges [8, 9]. Fuzzy logic has been effectively applied to edge detection in medical imaging, providing robust techniques for identifying object boundaries in noisy or low-contrast images. A study introduced an edge detection algorithm based on Fuzzy logic utilizing a 3×3 mask guided by a fuzzy rule set, which demonstrated superior performance in detecting edge pixels in both noise-free and noisy clinical images compared to traditional [8].
The study [8] proposes algorithm for smooth and noisy images, while that in the study [9] focus on real time implementation that can be achieved using special hardware implementation on ARTIX-7 FPGA. The paper [10] also illustrates the use of a contour detection filter using field programmable gate array (FPGA) combining hardware and software components.
The Fuzzy logic technique is widely used in many image processing applications [11-13] and the Fuzzy logic technique for edge detection in digital images can be used without determining the threshold value [14]. Large amounts of logic can be integrated onto a single integrated circuit (IC) using higher-density programmable logic devices such as FPGA, which are ideal for real-time operations at the high speeds expected by numerous fuzzy applications [11, 15, 16].
Authors in the study [17] evaluate the current studies of FPGA technology, focusing on FPGA-based Fuzzy logic controllers. They also presented the results of the simulation and the experiment, drawing conclusions on the primary differences between FPGA-based and software-based systems. Researchers use MATLAB to implement edge detection using Fuzzy logic [18-21].
This paper aims to identify the edges of the lung X-rays images to obtain accurate diagnosis of COVID-19. It offers significant clinical advantages, such as enhanced diagnostic accuracy, real-time processing, and reduced errors in analysing COVID-19 X-ray images. Various edge detection techniques, such as Robert, Prewitt, and Sobel, are widely available for use. However, these existing methods exhibit sensitivity to noise, which affects their performance in noisy environments. As a result, they struggle to produce well-defined and sharp edges, leading to less accurate edge detection in certain conditions [6]. Therefore, the Fuzzy logic technique which is widely used in many image processing applications implemented in FPGA has been proposed in this study. In addition to its technical contributions, this study aligns with global initiatives, supporting Sustainable Development Goals 3 (Good Health and Well-Being) and 9 (Industry, Innovation, and Infrastructure) by improving healthcare diagnostics through advanced technology.
There are five sections in this study. Section 1 gave an introduction; Section 2 covered the theory of edge detection using fuzzy image processing techniques and earlier related works; Section 3 described the design of the suggested hardware and how it was implemented on the ZYNQ board; and Section 4 presented the analysis and useful results following the implementation. This paper is concluded with a number of conclusions in Section 5.
One of the crucial phases in image processing, along with image registration, segmentation, and identification, is edge detection. There are some techniques for edge detection such as Sobel, Preweitt, Laplacian and Laplacian of Gaussian. However, they have some limitation, such as, fixed edge thickness and difficulty in threshold implementation. The Fuzzy based method does not have such limitation, as the edge thickness can be changed simply by changing rules and output parameters [22, 23]. Several studies have been conducted to identify and detect COVID-19 using virous methods and approaches. Salau, for example, introduced a new technique using the SVM methodology for the early detection and classification of computed tomography (CT) scan images of COVID-19 [24]. The method involved the use of a discrete wavelet transform (DWT) algorithm to extract distinctive characteristics. Subsequently, the SVM was employed to classify the extracted features. The proposed SVM approach achieved a detection rate of 98.2%.
Moreover, Huergo and Thanh [25] evaluated various cutting-edge techniques employed for the detection of COVID-19, focusing on the immunological response. The study of seroconversion using immunomes reveals the complex nature of the immunological reaction to COVID-19. Identifying anti-SARS-CoV-2 antibodies can also aid in identifying patients who were previously infected but did not show symptoms, despite having negative reverse transcription polymerase chain reaction (RT-qPCR) test results. Ayalew et al. [26] also proposed a chest X-ray based COVID-19 detection and classification method for fast diagnosis. This study proposed a CNN and HOG approach. The hybrid model achieved an accuracy of 99.67%, respectively, for COVID-19 identification and classification, exceeding the accuracies of CNN and HOG by 1.37% and 1.17%, respectively.
In addition, Frimpong et al. [27] developed an Internet of Things (IoT) system that utilises temperature and heart rate sensors to detect COVID-19 at an early stage. The system uses both normal and abnormal temperature and heart rate as relay-identifying features. The significance of the paper lies in the sophisticated programming of the microcontroller and the sensor's operation through the mobile application, which enables the early and affordable identification of cardiac problems and abnormal temperatures. The development of a coronavirus patient by analysing the virus' biological characteristic has been also attempt by Deriba et al. [28] for identification purposes. Three machine learning algorithms: Artificial Neural Network, Naïve Bayes, and Support Vector Machine were used in this study. This study shows that, the Artificial Neural Network outperforms the Support Vector Machine by 4.75% and the Naïve Bayes classifier by an average of 8.3%.
Furthermore, Prasad et al. [29] proposed a now algorithm to detect COVID-19 positives and identify its locations which can be used to distribute vaccines and reduce disease impact. The algorithm uses machine learning, deep learning, digital image processing, and cloud technology to identify COVID-19 cases and priorities immunizations. Finally, Gheisari et al. [30] proposed a technique for identifying the initial signs of COVID-19. The goal was to identify valuable COVID-19 detection patterns. The expert system receives the patterns as rules after consulting with a domain expert. It used a PART rule-based method to identify COVID-19 cases, achieving a 92.47% accuracy rate during a 10-fold cross-validation test.
Additionally, Ayalew et al. [31] classified chest X-rays as normal or COVID-19-positive. They used CNN, activation function dropout, batch normalisation, and Keras parameters. The Rectified Linear Unit (ReLU) is turned on by the sigmoidal function. The ReLU feeds images of convolutional, max pooling, and dense layer neurons. Using learning model data, SVM identified COVID-19 and normal images. Learning improves model accuracy and minimises loss. All models performed well, but augmentation, imagine segmentation, and image cropping had the highest training and test accuracy at 99.8% and 99.1%, respectively. Table 1 shows the comparison of related studies. While previous state-of-the-art studies have used a variety of approaches and techniques to detect and identify COVID-19, none of them have considered the importance of real-time and high-speed operation, which are the primary objectives of the proposed approaches in this paper.
Table 1. The comparison of cutting-edge studies
|
Ref. |
Year |
Method |
Data Type |
Accuracy |
|
[24] |
2021 |
SVM and DWT algorithms |
Chest CT-Scan/X-Ray scan images |
98.20% |
|
[25] |
2021 |
Real time RT-PCR |
Extracted RNA |
--------- |
|
[26] |
2022 |
The hybrid CNN and HOG algorithm |
Chest X-ray Image |
99.67% |
|
[27] |
2022 |
Comparative based Threshold method |
Temperature and Heart-Rate |
--------- |
|
[28] |
2023 |
Artificial Neural Network algorithm |
COVID-19 biological traits |
96.05% |
|
[29] |
2023 |
Cloud based deep learning algorithm |
Chest CT-Scan/X-Ray scan images |
--------- |
|
[34] |
2023 |
PART rule-based algorithm |
COVID-19 Symptoms |
92.47% |
|
[31] |
2023 |
CNN and SVM |
Chest X-ray Image |
99.10% |
In addition to the previously mentioned approaches utilized for detecting COVID-19, several other methods based on different underlying principles have also been employed for both the detection and prevention of the virus. Yadessa and Salau [32], for example, proposed a touch-free ultrasound based hand washing system to prevent the infection of the COVID-19. Natnael et al [33]. also conducted a cross sectional study to study people's (taxi drivers as a case sample) commitment to wearing masks during COVID-19 pandemic.
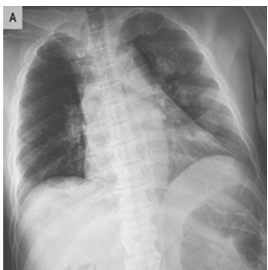
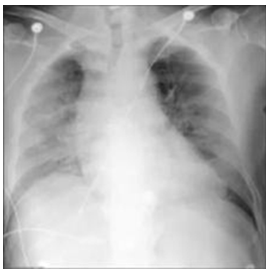
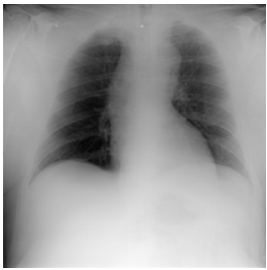
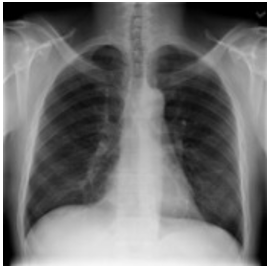
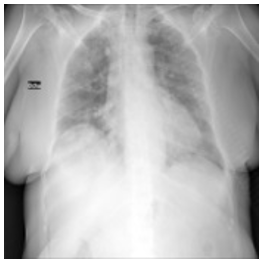
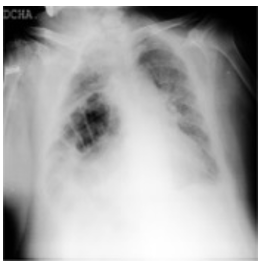
The study's data set comprised chest X-ray images of both viral and normal pneumonia, as well as those for COVID-19-positive [35, 36]. A total of 21165 chest X-ray images have been included in this dataset which are 3616 COVID-19 positive, 10,192 Normal, 6012 Lung Opacity, and 1345 Viral Pneumonia images. Fuzzy image processing encompasses a collection of techniques designed to interpret, represent, and manipulate images, segments, and functions using fuzzy set theory [13].
Hamid Tzhooch has expanded his understanding of Fuzzy logic to include image processing. Fuzzy image processing is a collection of different fuzzy methods to image processing. Figure 1 illustrates the general structure of fuzzy “image processing [16]”. It consists of three main steps: Image data encoding “fuzzification” and results decoding “defuzzification” are the stages that enable fuzzy techniques to be used to process images. In the middle stage, the main strength of fuzzy image processing is "modification of membership values" [13, 37].
Figure 1 and Figure 2 illustrate a Fuzzy logic-based image processing, where an input image undergoes fuzzification, transforming pixel values into fuzzy sets using membership functions to handle uncertainty. Expert knowledge plays a role in modifying these memberships, guided by Fuzzy logic and fuzzy set theory, to refine the processing. This modified fuzzy representation is then converted back into a clear image through defuzzification, resulting in an enhanced edge-detected output.
3.1 Image fuzzification
In this step fuzzification the gray level intensity is converted by the use of different types of membership functions to a fuzzy level from 0 to 1 [13, 38].
Figure 1. General structure of fuzzy image processing
Figure 2. Steps of fuzzy image processing
3.2 Membership functions and fuzzy inference system
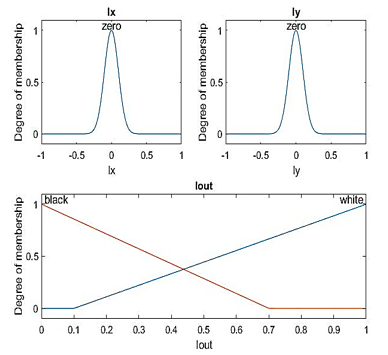
Fuzziness is represented by its membership functions [39-41]. Triangular, Gaussian, and trapezoidal methods can be utilized to construct membership functions in fuzzy systems. Among these, the Gaussian membership function has been specifically employed in this study. Within the designed fuzzy inference system, the Gaussian membership function, as represented by Eq. (1), is utilized to detect both vertical and horizontal input edges. Meanwhile, the trapezoidal membership function, as described in Eq. (2), is applied to determine the colour of the output image. The membership functions that have been practically implemented in this study are illustrated in Figure 3.
${Gaussian}(x ; m, \sigma)=e^{-\left(\frac{(x-m)^2}{2 \sigma^2}\right)}$ (1)
${ Trapezoidal }(I x, I y)= \begin{cases} { white } & { if } \,I x \,{ and }\, I y=0 \\ { black } & { if } \,I x \, { or } \,I y \neq 0\end{cases}$ (2)
Figure 3. Membership functions used in practical work
3.3 Image defuzzification
The defuzzification of the image is the opposite of the fuzzification [42, 43]. The weighted average method is the most frequently used method for defuzzification since it is one of the more computationally efficient methods It is used in this work and it is given by the algebraic expression, Eq. (3):
$z^*=\frac{\sum \mu c(\bar{z}) \cdot \bar{z}}{\sum \mu c(\bar{z})}$ (3)
Here, the algebraic sum is represented by $\sum$, and the centroid of each symmetric membership function is denoted as $\bar{Z}$ The "weighted average method" is formulated by assigning weights to each membership function in the output based on its respective maximum membership value. For example, if the two functions illustrated in Figure 4 are applied, the defuzzified value would generally take the form presented in Eq. (4):
$z^*=\frac{a(0.5)+b(0.9)}{0.5+0.9}$ (4)
Figure 4. Weighted average method of defuzzification
The values a and b stand for the means (centroids) of the respective forms for symmetrical membership functions alone. In this case, the Fuzzy logic edge-detection technique finds breaks in homogenous areas by using the gradient of the image. To extract features, the image gradient has been calculated along the x- and y-axes, or Gx and Gy, which are simple gradient filters. The conv2 function was then used to convolve the matrix holding the x-axis gradients of I with Gx. The range of the gradient values is [-1, 1]. Likewise, I was convolved with Gy to yield its y-axis gradients. The suggested system's feature extraction sequence is depicted in Figure 5.
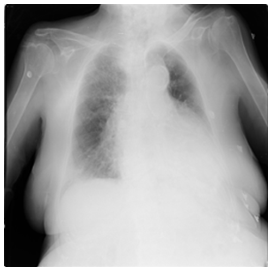
In the first stage, the system receives the chest X-ray images. To guarantee uniformity, images are resized to 299×299 pixels. The images are then converted to grayscale with OpenCV. Before using the convolution technique, the pixel value of the grayscale images is normalized using the Min-Max Scaler. Finally, convolution is performed on the grayscale image using the predefined gradient filters to extract edge features.
Figure 5. Feature extraction sequence of the proposed system
3.4 Hardware implementation of the proposed fuzzy edge detection system
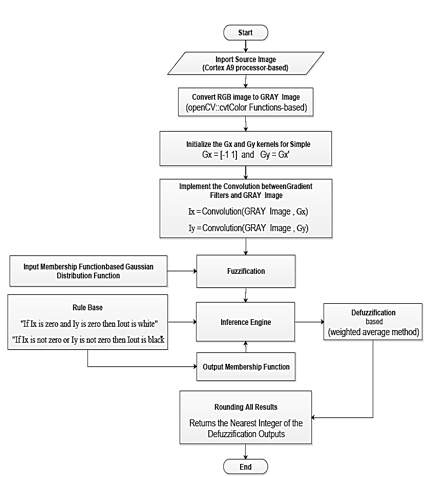
The overall steps of the algorithm used in hardware design are illustrated in the flowchart of Figure 6. The program of this algorithm has been written in C language using Vivado HLS. The design was implemented using the Zynq-7000 ZC702 Evaluation Board as the hardware platform. This board, known as the ZedBoard, serves as an evaluation and development platform built on the Xilinx Zynq™-7000 All Programmable System on Chip (AP SoC). Combining a dual Corex-A9 Processing System (PS) with 85,000 Series-7 Programmable Logic (PL) cells.
It consists of an SoC-style combined processing system (PS) and programmable logic (PL) on a single chip [44]. The design reads the COVID-19 radiography dataset [35, 36] as input images, these images are read by PS part using the dual-core ARM Cortex-A9 processor there directly without using PL part since the Fuzzy values in this work are floating-point for efficient results as the next section prove. Figure 7 illustrates the proposed design for fuzzy edge detection system using this platform. The proposed system leverages FPGA technology to meet clinical requirements for real-time analysis and accurate diagnosis.
Figure 6. Flowchart of fuzzy edge detection system
Figure 7. Fuzzy based edge detection ZYNQ system
The Zynq xc7z020 evaluation kit comprise 53200-Lookup Table (LUT), 106400- Flip-Flop (FF), 140- RAM Lookup Table (BRAM), 32-BUFG and 220- Digital Signal Processor (DSP) block. The hardware resource usage to implement of the proposed system are 13.9% (7396) of LUT and 1.63% (283) of LUTRAM. It is also used 6.24% (6635) of FF and 1.43% (2) of BRAM as well as 10.91% (24) of DSP Block as shown in Figure 8.
Figure 8. Hardware resource of the proposed system
The following findings demonstrate the successful testing of the fuzzy edge detection technique proposed in this study. These results show how fuzzy image processing procedures based on fuzzy edge detection algorithms are carried out, and the resulting images are displayed using MATLAB and an FPGA device.
The differences between the designs are also presented with their timing analysis, speedup, and performance metrics etc. In this study, all processes of the proposed system have been performed through the Vivado Design Suite (ver.2018.3).
First: the performance metrices for the proposed edge detection technique is measured for healthy sample images using MATLAB and Zynq702 FPGA. The results of these performances are shown in Table 2 for 299×299 size images.
Second: the performance metrices for the proposed edge detection technique is measured for infected sample images using MATLAB and Zynq702 FPGA. The results of these performances are shown in Table 3.
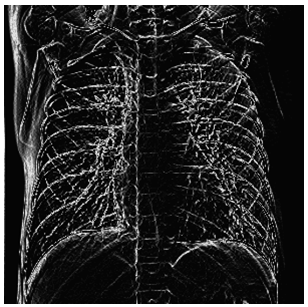
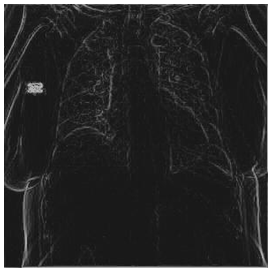
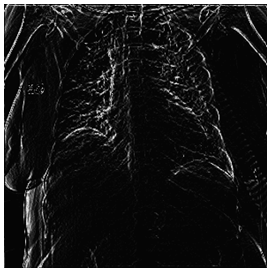
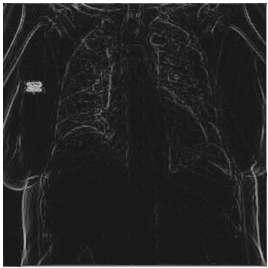
Third: the performance of the hardware system is evaluated to perform the ground truth edge detection technique, which is a method to accurately determine the boundary edges in an image by measuring the local and global structural similarity between any two images, as illustrated in Table 4 and Table 5 as well as Figure 9. In this technique, (1) represents perfect similarity, (0) represents no similarity, while (-1) represents complete dissimilarity.
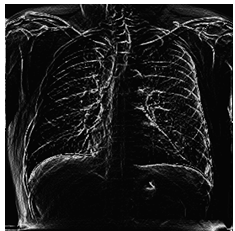
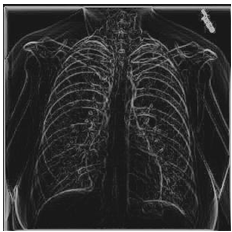
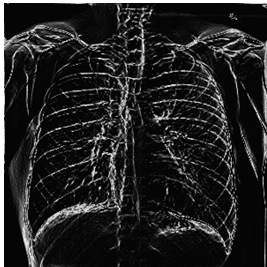
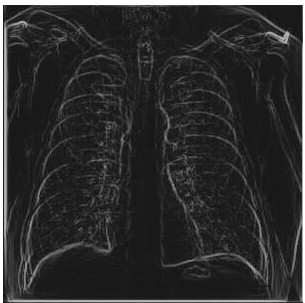
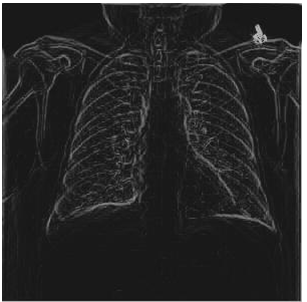
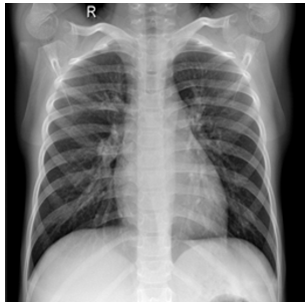
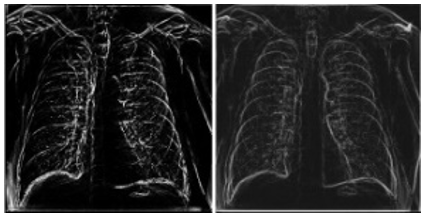
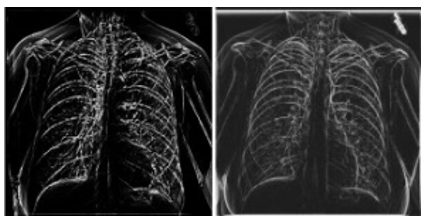
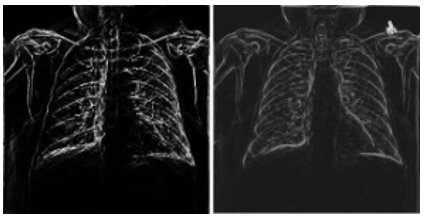
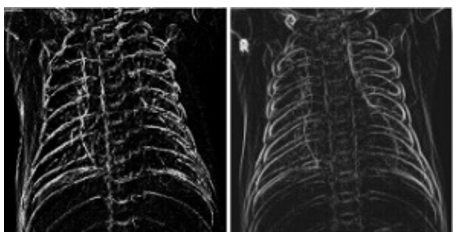
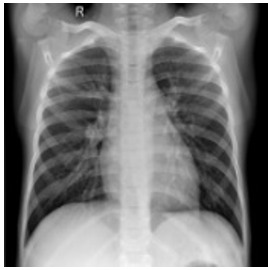
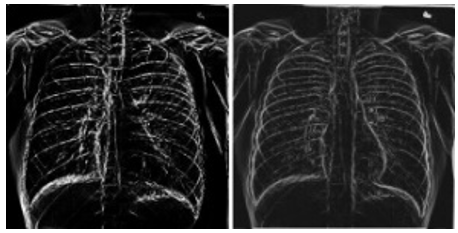
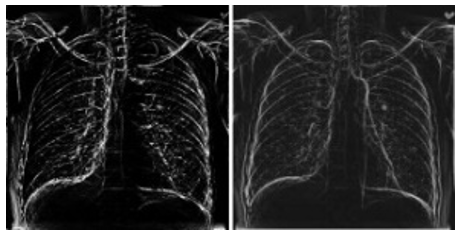
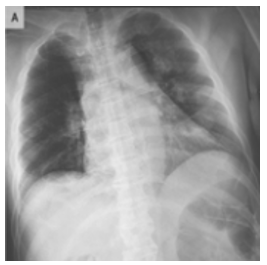
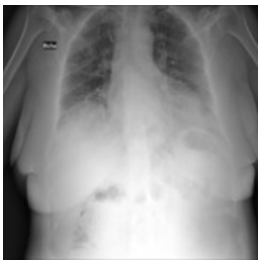
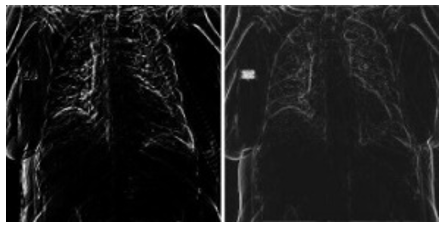
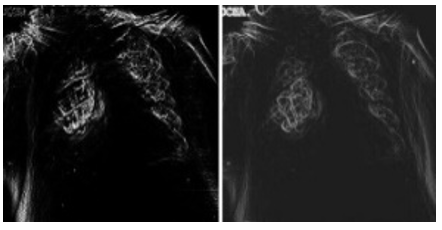
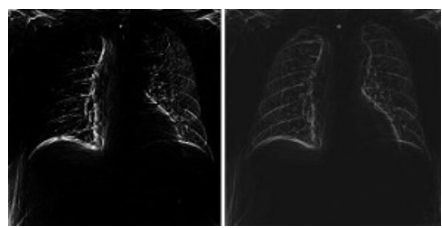
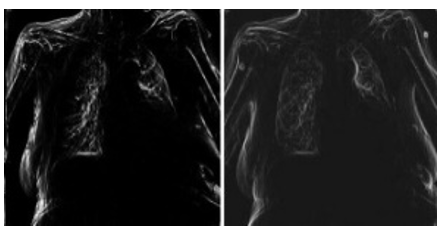
Table 2 and Table 3 illustrate both the healthy and infected images, respectivly, the clarity of edges is observed. The tables indicate that using the proposed method with MATLAB led to a significant improvement in edge clarity in the Infected images compared to the healthy ones. This is due to the characteristics of the COVID-19 disease present in the infected images, which increase the complexity of the edges and make them less clear. They also indicate that the images produced by the proposed method are clearer than those from MATLAB, as the proposed method employs fixed-point arithmetic to represent numbers that are closer to edge values than the numbers used by MATLAB, which relies on floating-point arithmetic.
Table 2. Results for normal images
|
Input Image |
MATLAB Result |
FPGA Result |
Table 3. Results for COVID-19 infected images
|
Input Image |
MATLAB Result |
FPGA Result |
Table 4 and Table 5 demonstrate the similarity between the two methods for both types of images and Peak Signal-to-Noise Ratio (PSNR) as well as Quality Factor. They illustrate the similarity of the methods for healthy images (0.8711-0.9885) is higher than that for infected images (0.8010-0.9825). As previously explained, the reason lies in the nature of the COVID-19, which increases the complexity of the edges and makes them less clear.
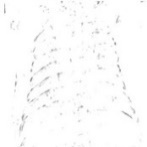
Table 4. Comparison with ground truth edge detection
|
Normal Results |
|||
|
Input Image |
Differences |
Similarity |
PSNR dB
Quality Factor |
|
|
|
0.9032 |
41.23
65 |
|
|
|
0.8904 |
37.89
48 |
|
|
|
0.8711 |
36.85
44 |
|
|
|
0.9391 |
43.67
80 |
|
|
|
0.9006 |
40.12
60 |
|
|
|
0.8986 |
38.76
52 |
|
|
|
0.9885 |
44.99
89 |
|
|
|
0.9304 |
42.56
73 |
Table 5. Comparison with ground truth edge detection
|
Infected Results |
|||
|
Input Image |
Differences |
Similarity |
PSNR dB
Quality Factor |
|
|
|
0.8010 |
33.05
33 |
|
|
|
0.9001 |
40.10
59 |
|
|
|
0.8073 |
33.78
36 |
|
|
|
0.9130 |
42.34
72 |
|
|
|
0.8051 |
33.45
35 |
|
|
|
0.8986 |
38.76
52 |
|
|
|
0.9825 |
44.89
88 |
|
|
|
0.9007 |
40.12
60 |
Figure 9. Normal and infected ground truth edge detection similarity results
Several edge detections system based on FPGA platform have been implemented by state of art studies. Table 6 illustrates the comparison of these studies with the proposed system. it can be noticed that artificial intelligence and machine learning employ two distinct methodologies: Fuzzy logic and deep learning. Elements in the Fuzzy logic system have varying degrees of membership. Rather than fixed and definite reasoning, it works on approximative reasoning. Fuzzy logic addresses imprecision and uncertainty by utilizing fuzzy sets and fuzzy rules. Instead of using binary true/false rules, it uses if-then rules with degrees of truth. Deep learning algorithms, on the other hand, model complex patterns and correlations in data using neural networks.
Table 6. Comparison between the sate-of-art system based on FPGA and proposed system
|
Ref. No. |
Year |
Method |
FPGA Board |
Results |
|
[45] |
2021 |
Deep learning CNN |
Xilinx Zynq Ultrascale+ MPSoC ZCU102 |
Accuracy was 92.7% on 128*128 image size |
|
[46] |
2022 |
Deep learning CNN |
Xilinx Basys3 FPGA |
Accuracy was 95% |
|
[47] |
2022 |
Laplacian Vector Median Filter |
Xilinx Zynq FPGA |
PSNR was 5.5% and Normalized Color Difference was 18.2%. |
|
[48] |
2023 |
Deep learning CNN |
Zynq-7000 Development FPGA |
CNN with Mean–Variance Softmax-Rescale accuracy was 96.16% |
|
Proposed System |
2024 |
Fuzzy logic |
Zynq-7000 ZC702 Evaluation Board |
Accuracy was 98% |
Deep learning algorithms are made up of multiple layers of networked nodes that process and alter data through weighted connections.
As a result, fuzzy systems have less computational operation and complexity than deep learning. Consequently, compared to deep learning algorithms, Fuzzy logic, which has been selected in the propose system, requires less hardware resources when implementing them on an FPGA. The suggested system made use of the Zynq-7000 ZC702 Evaluation Board, an FPGA board that is more affordable and user-friendly than the Xilinx Zynq Ultrascale+ MPSoC ZCU102.
The system's enhanced edge clarity directly supports early detection of pulmonary abnormalities, critical for timely intervention in COVID-19 patients. Although the proposed system has been showing a satisfying and encouraging results to work with different types of medical imaging, it is difficult to use DICM extension of the medical imaging that are produce by other medical image modalities such as CT scan and MRI system.
Fuzzy image processing is a valuable technology used in the creation of an edge detection system for detection of COVID-19-infected patients using chest X-ray images. The results of the proposed method demonstrate effective image detection, particularly in medical images where achieving accurate edge detection is the primary goal of the procedure. Furthermore, this approach employed fuzzy set theory to establish image thresholds, resulting in improved image quality as seen by the displayed images. Additionally, using the ZYNQ (PS) component provided greater adaptability to the design, allowing for the use of floating-point numbers. This resulted in improved speed and accuracy of the results compared to using the ZYNQ (PL) component, which requires the use of fixed-point numbers and leads to approximations in the defuzzification stage. The output images and performance metrics of Fuzzy-based edge detection images achieved using the Zynq702 FPGA exhibited superior quality compared to the performance metrics of fuzzy-based edge detection images obtained using MATLAB. However, there are several types of difficulties when using FPGA-based fuzzy edge detection for X-ray images in medical applications. These include the computational complexity needed for real-time processing and handling image noise and low contrast, which might impact edge detection accuracy. More images from different imaging modalities (such as CT scan and MRI images) can be tested as an input of the proposed system as well as various lung disorders can be targeted on the same system. The proposed system not only advances computational methods but also offers practical clinical benefits, such as improved diagnostic precision and accessibility for resource-limited settings.
The authors sincerely express their appreciation to the Ministry of Higher Education and Scientific Research, along with Northern Technical University, for their invaluable support and commitment in facilitating the necessary infrastructure for the successful execution of this study.
|
m |
mean |
|
z∗ |
fuzzy mean (fuzzy centroid) |
|
Greek symbols |
|
|
σ |
standard deviation |
|
μc |
membership function |
|
Subscripts |
|
|
x |
x axis direction (horizontal) |
|
y |
y axis direction (vertical) |
[1] Pham, T.D. (2021). Classification of COVID-19 chest X-rays with deep learning: New models or fine tuning? Health Information Science and Systems, 9: 1-11. http://doi.org/10.1007/s13755-020-00135-3
[2] Khan, S.H., Sohail, A., Khan, A., Lee, Y.S. (2022). COVID-19 detection in chest X-ray images using a new channel boosted CNN. Diagnostics, 12(2): 267. http://doi.org/10.3390/diagnostics12020267
[3] Jarjees, M.S., Sheet, S.S.M., Ahmed, B.T. (2022). Leukocytes identification using augmentation and transfer learning based convolution neural network. Telkomnika (Telecommunication Computing Electronics and Control), 20(2): 314-320. http://doi.org/10.12928/TELKOMNIKA.v20i2.23163
[4] Ahsan, M., Based, M.A., Haider, J., Kowalski, M. (2021). COVID-19 detection from chest X-ray images using feature fusion and deep learning. Sensors, 21(4): 1480. http://doi.org/10.3390/s21041480
[5] Wang, K., Zhao, Y., Dou, Y., Wen, D., Gao, Z. (2021). COVID Edge-Net: Automated COVID-19 lung lesion edge detection in chest CT images. In Joint European Conference on Machine Learning and Knowledge Discovery in Databases, pp. 287-301. http://doi.org/10.1007/978-3-030-86514-6_18
[6] Ameen, R.H.M., Basheer, N.M., Younis, A.K. (2023). Breast cancer diagnosis based on support vector machine techniques. Indonesian Journal of Electrical. Engineering and Computer. Science, 32(1): 236-243. http://doi.org/10.11591/ijeecs.v32.i1.pp236-243
[7] Hwa, S.K.T., Bade, A., Hijazi, M.A. (2020). Enhanced Canny edge detection for Covid-19 and pneumonia X-Ray images. IOP Conference Series: Materials Science and Engineering, 979(1): 012016. http://doi.org/10.1088/1757-899X/979/1/012016
[8] Haq, I., Anwar, S., Shah, K., Khan, M.T., Shah, S.A. (2015). Fuzzy logic based edge detection in smooth and noisy clinical images. PloS One, 10(9): e0138712. http://doi.org/10.1371/journal.pone.0138712
[9] Ummer, S., Sreekumar, R. (2017). Real time implementation of EDE detection technique for angiogram images on FPGA. International Research Journal Engineering Technology, 4(6): 4-7.
[10] Bouganssa, I., Sbihi, M., Zaim, M. (2016). Implementation on a FPGA of edge detection algorithm in medical image and tumors characterization. In 2016 5th International Conference on Multimedia Computing and Systems (ICMCS), pp. 59-64. http://doi.org/10.1109/ICMCS.2016.7905655.
[11] Abdullah, H.A.T., Younis, B.M. (2020). FPGA based bone fracture detector. IOP Conference Series: Materials Science and Engineering, 745(1): 012052. http://doi.org/10.1088/1757-899X/745/1/012052
[12] Mathur, S., Ahlawat, A. (2008). Application of fuzzy logic on image edge detection. Information Science and Computing, Book 5, Intelligent Technologies and Applications, pp. 24-28.
[13] Younis, B.M.K., Younis, D.B. (2020). Fuzzy image processing based architecture for contrast enhancement in diabetic retinopathy images. International Journal of Computer Engineering and Information Technology, 12(4): 26-30. http://doi.org/10.47277/ijceit/12(4)1
[14] Alshennawy, A.A., Aly, A.A. (2009). Edge detection in digital images using fuzzy logic technique. World Academy of Science, Engineering and Technology, 51: 178-186.
[15] Huang, X., Oda, T. (2011). Comparison of Extended fuzzy logic models of A-IFS and HLS: Detailed analysis of inclusion in the A-IFS of the data sets for implication operations. Aichi Institute of Technology, pp. 1-6.
[16] Kaur, E.M. (2011). A new approach to edge detection using rule based fuzzy logic. Journal of Global Research in Computer Science, 2(9): 15-19.
[17] Sulaiman, N., Obaid, Z.A., Marhaban, M.H., Hamidon, M.N. (2009). FPGA-based fuzzy logic: Design and applications-A review. International Journal of Engineering and Technology, 1(5): 491-03. http://doi.org/10.7763/ijet.2009.v1.90
[18] Khaire, P.A., Thakur, N.V. (2012). A fuzzy set approach for edge detection. International Journal of Image Processing (IJIP), 6(6): 403-412.
[19] Suryakant, N.K. (2012). Edge detection using fuzzy logic in Matlab. International Journal of Advanced Research in Computer Science and Software Engineering, 2(4): 38-40.
[20] Verma, O.P., Jain, V., Gumber, R. (2013). Simple fuzzy rule based edge detection. Journal of Information Processing Systems, 9(4): 575-591. https://doi.org/10.3745/JIPS.2013.9.4.575
[21] Kavitha, C., Denis Ashok, S. (2013). Edge detection of images using fuzzy logic technique. International Journal of Applied Engineering Research, 8(19 SPEC.ISSUE): 2475–2478.
[22] Lakshmi, B. G., Hemalatha, B. (2014). Edge detection using fuzzy logic. International Journal of Engineering Research and Applications, 4(9): 165-167. https://www.ijera.com/papers/Vol4_issue9/Version%201/Y4901165167.pdf.
[23] Lakshmi, B.G., Hemalatha, B. (2012). Edge detection using fuzzy logic and thresholding. In national conference on signal and image processing (NCSIP-2012), pp. 165-167.
[24] Salau, A.O. (2021). Detection of corona virus disease using a novel machine learning approach. In 2021 International Conference on Decision Aid Sciences and Application (DASA), pp. 587-590. http://doi.org/10.1109/DASA53625.2021.9682267
[25] Huergo, M.A.C., Thanh, N.T.K. (2021). Current advances in the detection of COVID-19 and evaluation of the humoral response. Analyst, 146(2): 382-402. http://doi.org/10.1039/d0an01686a
[26] Ayalew, A.M., Salau, A.O., Abeje, B.T., Enyew, B. (2022). Detection and classification of COVID-19 disease from X-ray images using convolutional neural networks and histogram of oriented gradients. Biomedical Signal Processing and Control, 74: 103530. http://doi.org/10.1016/j.bspc.2022.103530
[27] Frimpong, S.A., Salau, A.O., Quansah, A., Hanson, I., Abubakar, R., Yeboah, V. (2022). Innovative IoT-based wristlet for early COVID-19 detection and monitoring among students. Mathematical Modelling of Engineering Problems, 9(6): 1557-1564. http://doi.org/10.18280/mmep.090615
[28] Deriba, F.G., Salau, A.O., Tefera, B.T., Demilie, W.B. (2023). Artificial intelligence assisted decision making in predicting COVID-19 patient’s path. Journal of Pharmaceutical Negative Results, 14: 1250-1255. https://www.pnrjournal.com/index.php/home/article/view/8283/11153.
[29] Prasad, V.K., Dansana, D., Patro, S.G.K., Salau, A.O., Yadav, D., Bhavsar, M. (2023). CIA-CVD: Cloud based image analysis for COVID-19 vaccination distribution. Journal of Cloud Computing, 12(1): 163. http://doi.org/10.1186/s13677-023-00539-y
[30] Gheisari, M., Ghaderzadeh, M., Li, H., Taami, T., Fernández-Campusano, C., Sadeghsalehi, H., Afzaal Abbasi, A. (2024). Mobile apps for COVID-19 detection and diagnosis for future pandemic control: Multidimensional systematic review. JMIR mHealth and uHealth, 12: e44406. http://doi.org/10.2196/44406
[31] Ayalew, A.M., Salau, A.O., Tamyalew, Y., Abeje, B.T., Woreta, N. (2023). X-Ray image-based COVID-19 detection using deep learning. Multimedia Tools and Applications, 82(28): 44507-44525. http://doi.org/10.1007/s11042-023-15389-8
[32] Yadessa, A.G., Salau, A.O. (2021). Low cost sensor based hand washing solution for COVID-19 prevention. In 2021 International Conference on Innovation and Intelligence for Informatics, Computing, and Technologies (3ICT), pp. 93-97. http://doi.org/10.1109/3ICT53449.2021.9581821
[33] Natnael, T., Alemnew, Y., Berihun, G., Abebe, M., Andualem, A., Ademe, S., Tegegne, B., Adane, M. (2021). Facemask wearing to prevent COVID-19 transmission and associated factors among taxi drivers in Dessie City and Kombolcha Town, Ethiopia. PloS One, 16(3): e0247954. http://doi.org/10.1371/journal.pone.0247954
[34] Wubineh, B.Z., Salau, A.O., Braide, S.L. (2023). Knowledge based expert system for diagnosis of COVID. Journal of Pharmaceutical Negative Results, 14(3): 1242. https://www.pnrjournal.com/index.php/home/article/view/8282/11151.
[35] Chowdhury, M.E., Rahman, T., Khandakar, A., Mazhar, R., Kadir, M.A., Mahbub, Z.B., Islam, K.R., Khan, M.S., Iqbal, A., Emadi, N.A., Reaz, M.B., Islam, M.T. (2020). Can AI help in screening viral and COVID-19 pneumonia? IEEE Access, 8: 132665-132676. https://doi.org/10.1109/ACCESS.2020.3010287
[36] Rahman, T., Khandakar, A., Qiblawey, Y., Tahir, A., Kiranyaz, S., Kashem, S.B.A., Islam, Maadeed, S.A., Zughaier, S.M., Khan, M.S., Chowdhury, M.E. (2021). Exploring the effect of image enhancement techniques on COVID-19 detection using chest X-ray images. Computers in Biology and Medicine, 132: 104319. https://doi.org/10.1016/j.compbiomed.2021.104319
[37] Muhammad, A.H., Akbar, H.S. (2015). Algorithms for edge detection by using fuzzy logic technique. Kirkuk University Journal-Scientific Studies, 10(1): 173-190. http://doi.org/10.32894/kujss.2015.101966
[38] Zhang, Y. H., Li, X., Xiao, J. Y. (2017). A digital fuzzy edge detector for color images. arXiv preprint arXiv:1701.03364. https://doi.org/10.48550/arXiv.1701.03364
[39] Iliadis, L., Skopianos, S., Tachos, S., Spartalis, S. (2010). A fuzzy inference system using Gaussian distribution curves for forest fire risk estimation. In IFIP International Conference on Artificial Intelligence Applications and Innovations, pp. 376-386. http://doi.org/10.1007/978-3-642-16239-8
[40] Kurdi, A.H., Grantner, J.L., Abdel-Qader, I.M. (2017). Fuzzy logic based hardware accelerator with partially reconfigurable defuzzification stage for image edge detection. International Journal of Reconfigurable Computing, 2017(1), 1325493. http://doi.org/10.1155/2017/1325493
[41] Gonzalez, C.I., Melin, P., Castillo, O. (2017). Edge detection method based on general type-2 fuzzy logic applied to color images. Information, 8(3): 104. http://doi.org/10.3390/info8030104
[42] Kumar, E.B., Thiagarasu, V. (2017). Comparison and evaluation of edge detection using fuzzy membership functions. International Journal on Future Revolution in Computer Science & Communication Engineering (IJFRCSCE), 3(8). http://www.ijfrcsce.org/index.php/ijfrcsce/article/view/195/195.
[43] Alawad, A.M., Rahman, F.D.A., Khalifa, O.O., Malek, N.A. (2018). Fuzzy logic based edge detection method for image processing. International Journal of Electrical and Computer Engineering, 8(3): 1863. http://doi.org/10.11591/ijece.v8i3.pp1863-1869
[44] Younis, B.M., Younis, A.K. (2021). Hardware accelerator for anti-aliasing Wu's line algorithm using FPGA. TELKOMNIKA (Telecommunication Computing Electronics and Control), 19(2): 672-682. http://doi.org/10.12928/telkomnika.v19i2.18158
[45] Yuuki, O., Wang, J., Ikechukwu, O.M., Abdallah, A.B. (2021). Hardware acceleration of convolution neural network for ai-enabled realtime biomedical system. SHS Web of Conferences, 102: 04019. http://doi.org/10.1051/shsconf/202110204019
[46] Ghani, A., Aina, A., See, C.H., Yu, H., Keates, S. (2022). Accelerated diagnosis of novel coronavirus (COVID-19)—Computer vision with convolutional neural networks (CNNs). Electronics, 11(7): 1148. http://doi.org/10.3390/electronics11071148.
[47] Rashid, N., Berriri, K., Albekairi, M., Kaaniche, K., Ben Atitallah, A., Khan, M.A., El-Hamrawy, O.I. (2022). New real-time impulse noise removal method applied to chest X-ray images. Diagnostics, 12(11): 2738. http://doi.org/10.3390/diagnostics12112738
[48] Yaman, S., Karakaya, B., Erol, Y. (2023). A novel normalization algorithm to facilitate pre-assessment of COVID-19 disease by improving accuracy of CNN and its FPGA implementation. Evolving Systems, 14(4): 581-591. http://doi.org/10.1007/s12530-022-09419-3