Ammar T. Namel*![]() | Mouayad A. Sahib
| Mouayad A. Sahib![]()
© 2024 The authors. This article is published by IIETA and is licensed under the CC BY 4.0 license (http://creativecommons.org/licenses/by/4.0/).
OPEN ACCESS
Target-controlled infusion systems require accurate anesthetic effect prediction. Manually choosing model parameters for bispectral index (BIS) prediction in the classic (PK-PD) models can be challenging in clinical situations. The recently proposed transformer-based method has a poor performance in predicting depth of hypnosis (DOH) during maintenance phases with a large sample size. We suggest a regression-based approach to predicting the depth of anesthesia (DOA) by utilizing patient data and propofol drug infusions to resolve these concerns. The study tests five learning methods: least squares regression kernel, support vector machine (SVM) kernel, ensemble learning, regression tree, and neural network. We performed training and testing using separate datasets of 115 and 50 cases from the VitalDB database. It was found that the least squares regression kernel model was the best way to predict BIS (95 % CI) with a concordance correlation coefficient of 0.860 [0.851 to 0.864]. This is a lot higher than the values for the traditional PK-PD method (0.560 [0.540 to 0.570]) and the transformer-based model (0.680 [0.670 to 0.690]. The results show that this methodology improves on PK-PD models and previous transformer-based approaches for BIS prediction, making it suitable for control anesthesia applications.
general anesthesia, machine learning, BIS prediction, PK-PD model, DOH, regression learning models
During general anesthesia, one of the responsibilities of an anesthesiologist is to consistently adjust the intravenous medication rates in order to achieve the required degrees of sedation while keeping the hemodynamic and respiratory variables steady. Various models have been presented to anticipate the impact of fast-acting injectable medications, such as propofol, on a patient's physiological state [1, 2]. These models take into account reliable indications of hypnosis based on EEG data, such as the bispectral Index (BIS) [3]. The objective of medication dosage models is to enhance patient recovery by assisting practitioners in optimizing medication administration. Currently, the usual method of administering anesthesia involves the use of Target-Control-Infusion (TCI) pumps [4]. These pumps enable the anesthesiologist to select a specific concentration of the effect-site drug concentration (Ce) for each medication [5]. The TCI algorithm determines the rate at which a medication is infused to achieve the target concentration effect (Ce) based on a predefined model, without taking into account any feedback or adjustments. The anesthesiologist then closes the loop to achieve the required hypnotic levels. The main source of difficulty in this field of study is the uncertainty that affects the models used to describe the impact of drugs on vital signs [6]. Currently, infusion pumps use the traditional pharmacokinetic-pharmacodynamic (PK-PD) model extensively to determine the effect-site concentration of hypnotic medicines [7]. Nevertheless, the conventional pharmacokinetic-pharmacodynamic (PK-PD) model has a noteworthy constraint. The selection of a variety of parameters is essential in clinical practice because of the differences between individual organisms [8]. This is because the ambiguity arises due to the uncertain relationship between the dosage of the medicine and its impact on a particular organism. Despite administering the same amount of an anesthetic medication simultaneously, individuals exhibit varying physiological responses. Therefore, conventional PK-PD models may not consistently possess the ability to appropriately anticipate the impact of drugs. The development of a precise predicting medication efficacy model is crucial for intravenous target-controlled infusion devices [9]. As a result, machine learning techniques have been explored in recent years to tackle this issue. Machine learning methods offer an advantage over traditional PK-PD prediction models due to their ability to perform complex nonlinear dynamic computations. This leads to accurate predictions even in scenarios involving complicated environment data, insufficient expertise, and ambiguous inference rules.
Lee et al. [10] introduced a technique in their study that integrates the PK-PD model framework with the long short-term memory (LSTM) network. This approach is used to extract relevant information from the history of drug injections. Additionally, it incorporates various human physiological characteristics, including age, gender, height, and weight, to accurately predict the Bispectral Index (BIS). While this method demonstrates notable enhancement in predicting the degree of anesthesia compared to earlier PK-PD based methods, it exhibits subpar performance when dealing with samples that have substantial changes in BIS. Consequently, the prediction strategy based on deep learning suggested by Lee et al. [10] is not as effective in predicting the level of unconsciousness (LOU) in unforeseen circumstances. Furthermore, certain studies have successfully computed the BIS value by utilizing Electroencephalogram (EEG) data. Li et al. employed the Butterworth filter to extract several features, including column entropy, sample entropy, wavelet entropy, and band power, from EEG data. These features were subsequently fed into a sparse denoising autoencoder and long short-term memory (SDAE-LSTM) network to forecast the direction of arrival (DOA) [11]. Integrating deep learning and signal processing methods, this approach achieves a notable degree of accuracy in predicting the DOA. Nevertheless, the prediction approach based on EEG is less feasible compared to the PK-PD-based prediction method due to its reliance on a substantial volume of EEG signal data and its susceptibility to electromagnetic interference. Aubouin-Pairault et al. [12] introduced a data-driven methodology for predicting the impact of propofol and remifentanil on BIS and Mean Arterial Pressure (MAP) during total intravenous anesthesia. The study evaluates five learning approaches, namely linear models, support vector machine, Kernel, k-neighbors regressors, and neural-network. Learning and testing are conducted on a specific subset of 150 surgery cases that have been extracted from the VitalDB database. The results indicate that this methodology enhances the traditional surface-response methods for predicting BIS and MAP and can be applied to anesthesia control applications. Although this method shows a significant improvement over previous PK-PD based methods in predicting the level of anesthesia, the prediction strategy suggested by the study [12] is not transitioned smoothly from induction phase to maintenance phase, this means that the infusion rate is not adjusted accurately during transition. He et al. [13] presented a transformer architecture-based deep learning method for predicting the DOA in patients based on propofol and remifentanil infusion histories. The suggested method utilizes the integration of human factors, drug injection history, and derived multimodal features to improve the accuracy of prediction. In order to give pseudo-historical information, the PK-PD model is incorporated at the beginning of the network. This information is corrected during the training phase by the LSTM network and bottleneck layer. The module for the gate residual network (GRN) is then used to combine patient context with multidimensional characteristics information, eliminate unnecessary variables, and compile physiological traits at every time interval. In order to solve the issue of imbalance of data, the suggested approach employs label distribution smoothing and reweighting losses. This helps to avoid overfitting in areas with a large amount of data and demonstrates strong predictive capabilities in other areas. Although this method shows a significant improvement over previous PK-PD based methods in predicting the degree of anesthesia, the prediction strategy suggested by He et al. [13] is not as successful in predicting the depth of anesthesia (DOA) in maintenance periods with a large sample size. It is worth noting that Gambús et al. [14] have previously investigated hybrid modelling, which involves the integration of learning techniques to model the output and a linear system for system dynamics. In their study, an Adaptive Neuro Fuzzy Inference System was employed to forecast the BIS based on effect-site concentrations. However, this method does not take into account the inclusion of patient specific data as input in order to generate an individual model. This paper aims to utilize machine-learning techniques and measurable data to develop a PD output function that accurately represents the combined impact of uncertainty. Since PK models are already established and acknowledged by professionals, we have decided to utilize the PK outputs and concentrate solely on modelling the PD aspect. The model that has been developed is verified and can be utilized to forecast BIS (Bispectral Index) levels during general anesthesia. More specifically, five distinct regression techniques use patient personal data and PK results as features. These techniques include neural networks, ensemble learning, regression trees, support vector machines (SVM) kernel regression, and least squares regression kernel. The primary contributions of this study are, in brief, as follows:
• Regression learning was used to construct an empirical model from propofol infusion histories and demographic data for predicting the bispectral index during target-controlled infusions of total intravenous anesthesia.
• The regression model exhibited lower error in predicting bispectral index during anesthesia periods compared to the response surface model.
The subsequent sections of this paper are structured as follows: Section 3 describes the mathematical PK-PD model, while Section 4 describes the utilized materials and procedures. The results obtained are presented in Section 5, followed by concluding remarks in Section 6.
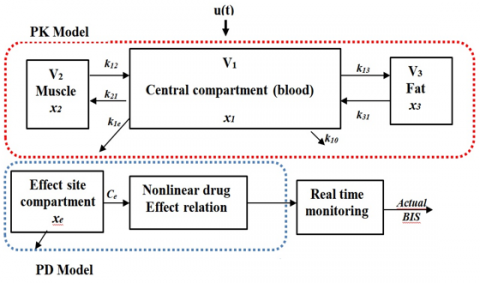
The administration of anesthesia dosage is governed by a mathematical model that integrates pharmacokinetic (PK) and pharmacodynamic (PD) elements. The direction and rate of dosage are determined by the PK model, which takes into account patient characteristics such as age, weight, height, and gender Conversely, the PD model delineates the correlation between the administered dose and the resultant response captured by the monitoring apparatus, thereby providing insight into the manner in which the dose impacts the patient. The PK/PD model is shown in Figure 1 [15].
The development of the mathematical expressions for the PK/PD model is centered on the application of the propofol medication [16]:
$\begin{gathered}x_1^{\prime}=\frac{u(t)}{v_1}-k_{12} x_1-k_{13} x_1-k_{10} x_1+k_{21} x_2 \\ x_2^{\prime}=k_{12} x_1-k_{21} x_2 \\ x_3^{\prime}=k_{13} x_1-k_{31} x_3\end{gathered}$ (1)
x1 indicates the dosage quantity in the central compartment, which is considered critical in this particular context (blood). The dosage quantities for the muscle and fat compartments are denoted by the remaining two components, x2 and x3, respectively. The coefficients kij, with i ≠ j, represent the transfer rate of drug from the ith compartment to the jth compartment. The variable k10 represents the metabolism of the dosage, while u(t) is the rate at which the propofol medication infused into the main compartment (blood). Out of the various models that have been developed, the Schnider model is the best appropriate for three specific body compartments [17]. The reason for this differentiation is from its ability to define the necessary factors inside relationships that accurately reflect the patient's traits, as demonstrated in Eqs. (2)-(4):
$\begin{gathered}\mathrm{V}_1=4.27 \\ \mathrm{~V}_2=18.9-0.391 \text { (age-53) } \\ \mathrm{V}_3=238 \\ \mathrm{CL}_1=1.89+0.0456 \text { (weight }-77 \text { ) }-0.0681 \text { (lbm-59) }+0.0264 \text { (height-177) } \\ \mathrm{CL}_2=1.29-0.024 \text { (age- } 53 \text { ) }, \mathrm{CL}_3=0.836 \mathrm{~min}^{-1} \\ \mathrm{k}_{10}=\mathrm{CL}_1 / \mathrm{V}_1, \mathrm{k}_{12}=\mathrm{CL}_2 / \mathrm{N}_1, \mathrm{k}_{21}=\mathrm{CL}_2 / \mathrm{V}_2, \\ \mathrm{k}_{\mathrm{le}}=0.456, \mathrm{k}_{13}=\mathrm{CL}_3 /\mathrm{V}_1, \mathrm{k}_{31}=\mathrm{CL}_3 / \mathrm{v}_3 \mathrm{~min}^{-1}, \\ \mathrm{k}_{\mathrm{e} 0}=0.456 \mathrm{~min}^{-1}\end{gathered}$ (2)
The factors k10, k12, k13, k21, and k31 are generated from unique patient features such as gender, age, height, and weight. CL1represents the rate at which a drug is removed from the body, whereas CL2 and CL3measure the amount of a drug that is transferred from the central compartment to the peripheral compartments during administration. Following is a detailed explanation of how lean body mass (lbm) is calculated for both males (M) and females (F) [18]:
Figure 1. PK/PD model
$lbm_{-m}=1.1$ weight $-128 \frac{\text { weight }^2}{\text { height }^2}$ (3)
$l b m_{-f}=1.07$ weight $-148 \frac{\text { weight }^2}{\text { height }^2}$ (4)
As illustrated in (5), the pharmacodynamic segment is dependent on Cp, which is the propofol concentration in the blood plasma of the central compartment (5):
$x_{e}^{\prime}(t)=k_{1 e} x_1^{\prime}(t)-k_{e 0} x_{e}(t)$ (5)
The variables Ke0 and k1e have predetermined values, while xe represents the delivery rate in the pharmacodynamic component, which clarifies the effect segment. Due to its considerably reduced magnitude in comparison to ke0, k1e may be deemed inconsequential. To determine the concentration in the effect site compartment, one may utilize Eq. (6) which is presented below:
$C_{\varepsilon}^{\prime}(t)=k_{e 0}\left(c_p(t)-c_{e}(t)\right)$ (6)
Ce denotes the concentration within the body's effect site compartment. A variety of medical devices are capable of performing Ce calculations while operative. The BIS monitoring index is the preferred instrument utilized to assess the degree of unconsciousness (LOU), which is also referred to as the Depth of Hypnosis (DOH) or Depth of Anesthesia (DOA). The index is a direct reflection of the patient's sensory state, and it is measured on a scale of 0 to 100. A score of zero denotes complete absence of brain activity in the patient's body, whereas a value of 100 signifies that the patient is unaffected by medicine and completely conscious. The intended BIS value is established at 50 at the onset of surgery, with the goal of preferably sustaining it within the interval of 40 to 60. This range signifies the attainment of an optimal degree of hypnosis, as clinicians have desired. The relationship between the BIS value and the concentration of the dosage effect (Ce) in the effect site compartment is determined by the Eq. (7). The relationship between the BIS value and its characteristics, such as variability over time and nonlinearity, is emphasized, which corresponds to the properties of the Sigmoid Hill equation [19]:
$\operatorname{BIS}(\mathrm{t})=\mathrm{E}_0-\mathrm{E}_{\max } \frac{C_e^\gamma}{c_e^\gamma+E C_{50}^\gamma}$ (7)
In this case, E0 denotes the outcome in the absence of any dosage and is established at 100. Emax represents the highest value attained due to the dosage rate, whereas EC50 signifies the minimum concentration of the medication required to induce a half-maximal effect. The parameter γ represents the patient response to medication, which corresponds to the slope of the equation. Eq. (8) represents the Hill equation in its reciprocal form [20]:
$C_e(t)=E C_{50}\left(\frac{E 0-B I S(t)}{E \max -E 0+B I S(t)}\right) \frac{1}{\gamma}$ (8)
4.1 Dataset creation and preparation
The comma-separated values (CSV) format raw data file is available for download from the publicly accessible data repository (https://osf.io/y5kcx). The data was analysed from individuals who had general surgeries performed between June and September in 2016. The data was analyzed from individuals who had general surgeries on Seoul National University Hospital performed between June and September in 2016. During the study period, the registry recorded 1,223 cases, of which 417 (34.1%) were performed with TIVA.
The authors of [21] utilized the Vital Recorder program, which was designed to capture time-synchronized data from various anesthesia devices such as the cardiac output monitor, patient monitor, anesthesia device, BIS monitor, and TCI pumps (the program can be downloaded for free from the website, https://vitaldb.net). The program was utilized to record the vital signs data in the registry. The dataset contains patient's demographic information (age, weight, height, and gender), BIS data, and a history of propofol infusions. The BIS data consisted of signal quality index and BIS values collected at 1s intervals. The data related to propofol comprised a data obtained from target-controlled infusion pump that is Ce and cumulative infusion volumes. In order to facilitate the research, target-controlled infusion history and BIS data were visually examined throughout the entire duration of propofol infusion. This interval encompasses both the induction phase (from beginning of propofol infusion until 10 minutes later) and maintenance phase (from the end of propofol infusion to recovery phase). For simplicity and ease of computation, we decide to use 900 seconds only from maintenance phase. It is unnecessary to model the recovery phase, as propofol administration is normally discontinued during this phase. The cases listed below were excluded: (1) instances involving inhalation drugs, (2) certain drugs administered via bolus injection as a result of their significant influence on BIS, (3) BIS below 80 prior to propofol infusion, (4) BIS below 50 following to propofol injection, and (5) samples experiencing data loss exceeding 30 seconds. After performing exclusion, 165 cases were selected. These 165 cases are chosen by a visual assessment in order to maintain an acceptable size for the dataset. This is done in order to eliminate cases that are either incoherent or suffer from a lack of data collection. The attributes of the acquired dataset are presented in Table 1 and expressed as mean ± standard deviation (confidence interval). From selected 165 cases two sets were generated at random. 115 cases (70 %) were designated as a training data and 50 cases (30 %) were utilized as a testing data. The total number of data points was 247,500 samples (165 cases each with 1500 sample). 172500 samples used for training data set (70%), and 75000 for testing data set (30%). To ensure that the dataset aligns with our intended purpose, it is imperative that the desired features are incorporated. Patient personal information (age, weight, height, and gender), propofol TCI data, and BIS are required for this purpose.
Table 1. Descriptive statistics of the selected 165 patients
|
Item |
Description |
|
N |
165 |
|
Sex ratio |
79 Male (48%), 86 (52%) Female |
|
Age (mean ± SD) (CI) year |
57.30 ± 14.47 (0.0985) |
|
Weight (mean ± SD) (CI) cm |
61.10 ± 9.93 (0.0677) |
|
Height (mean ± SD) (CI) cm |
161.97 ± 8.56 (0.0577) |
|
BIS (mean ± SD) (CI) |
52.67 ± 8.07 (0.0547) |
|
Propofol total dose (mg) |
1.15 ± 0.41 (0.0027) |
To expedite network convergence, the drug injection history and other static covariates are normalized. Additionally, the training set BIS values are smoothed, and to reduce computational error during the training phase, smoothing of BIS values was performed prior to modeling using locally weighted scatter plot smoothing (LOWESS) with a smoothing parameter of 0.03.
4.2 Regression learning models
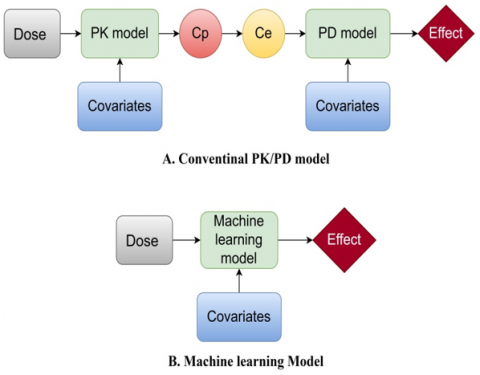
We employ five distinct regression learning models to forecast BIS based on various parameters, which we will elaborate on later. The models included are the least squares regression kernel, support vector machine kernel, ensemble learning, decision tree, and neural network. The term least squares regression kernel refers to a particular approach in regression analysis that combines the concepts of least squares regression with the utilization of kernel functions for the purpose of smoothing [22]. Within this particular context, the term kernel commonly denotes a weighting function employed to allocate weights to observations according to their closeness to a specific point of interest. Support vector machine (SVM) kernel regression, or Support vector regression (SVR), is a versatile and robust method for regression tasks, especially when handling non-linear relationships or complex data distributions. SVR utilizes the ideas of SVM and the kernel technique to accurately model and forecast continuous target variables based on input data [23]. Ensemble learning is a method in machine learning that enhances the predicted accuracy and resilience of a system by combining numerous regression models. The primary concept is to exploit the variety of distinct models in order to collectively generate more precise predictions than any single model could accomplish independently [24]. A regression tree is a supervised machine learning model that is specifically designed to predict continuous numeric values. The algorithm constructs a hierarchical structure like a tree, with core nodes representing decisions based on distinct features, and leaf nodes providing predictions for the desired parameter [25]. A regression neural network is a very effective machine learning model capable of discerning intricate patterns in data and providing precise predictions for continuous target variables. It utilizes the adaptability and expandability of neural networks to address a diverse set of regression problems in various fields [26]. The five selected models were chosen for their balance between performance, interpretability, and computational efficiency, providing a comprehensive analysis of BIS prediction using patient data and PK outputs which were suitable for the dataset size and study constraints. Other regression models were not considered in this study due to their limitations in handling continuous outcome prediction, computational inefficiency, and high data and resource requirements. Figure 2 shows the block diagram of the regression learning model. As illustrated in (A), in order to apply the conventional PK-PD model, a PK–PD intermediary such as plasma concentration (Cp) or effect-site concentration (Ce) is necessary, while PD part illustrating the mapping of Ce to final effect relationship. The regression learning model is specifically developed to compute computational intermediaries using the infusion histories of propofol and patient covariates such as age, sex, weight, and height. The resulting output of this model is the bispectral index (BIS). Figure 3 demonstrates the average prediction performance results of PK_PD model, baseline model (transformer based model), proposed regression model, and the original BIS index of the test cases (50 patients).
Figure 2. The block diagram of the regression model
(a) Induction phase
(b) Maintenance phase
(c) Induction and maintenance phase
Figure 3. Comparison of the proposed model's efficacy with that of other compared methods (the transformer-based method [13] and the PK-PD method [27]
4.3 Performance evaluation
The performance of proposed models is assessed using evaluation metrics such as median performance error (MDPE), median absolute performance error (MDAPE), and root mean square error (RMSE). The formula for calculating performance error (PE) was ([measured BIS - predicted BIS]/predicted BIS. The median of PE and the median of absolute of PE are known as median performance error (MDPE) and median absolute performance error (MDAPE) during anesthesia phases, respectively. The square root of the mean square error is known as the root mean square error, or RMSE. Furthermore, to assess the effectiveness of the proposed models with that of other methods that were compared, a paired t-test is employed. The experimental outcomes are reported as mean ± standard deviation. The statistical analysis is conducted utilizing SPSS 21 (IBM, USA), and a significance level of P < 0.05 is established for the paired t-test.
The PK-PD model's parameters used in the suggested technique are shown in Table 2. The MATLAB R2023a software package was utilized to train the five algorithms. Grid search and 5-fold cross-validation were employed to adjust the primary hyperparameters. The ultimate outcomes are presented in Table 3.
Table 2. PK/PD parameters of propofol
|
V1,V2,V3 |
V1 = 4.27, V2 = 18.9 - 0.391(age-53), V3 = 238 |
|
CL1 |
CL1 = 1.89 + 0.0456 (weight - 77) - 0.0681 (lbm - 59) + 0.0264 (height - 177) |
|
CL2 |
CL2 = 1.29 - 0.024(age - 53) |
|
CL3 |
CL3 = 0.836 min -1 |
|
Ke0 |
0.456 min-1 |
|
E0-Emax |
0-98 |
|
EC50(µg/mL) |
4.47 |
|
γ |
1.43 |
|
$\begin{gathered}l b m_{-m}=1.1 \,\,{ weight}-128 \frac{\text { weight }{ }^2}{\text { height}^2}, l b m_{-f}=1.07\,\,{ weight}-148\frac{\text { weight}^2}{\text { height}^2}\end{gathered}$, lbm=lean body mass, Age(years), weight(kg), height(cm) |
|
Table 3. Different models prediction performances on the test cases
|
Model |
RMSE |
MDPE (%) |
MDAPE (%) |
|
PK/PD [27] |
15.64 ± 5.19 |
21.75 ± 12.65 |
24.23 ± 10.16 |
|
Transformer based [13] |
9.52 ± 2.35 |
-02.08 ± 14.91 |
15.51 ± 6.87 |
|
Least squares regression kernel |
5.5 ± 7.40 |
-1.5 ± 2.1 |
12 ± 1.2 |
|
Support vector regression (SVR) |
10 ± 6.87 |
-3.15 ± 5.23 |
16.2 ± 3.4 |
|
Ensemble learning |
9.75 ± 6.9 |
4.371 ± 4.56 |
16.5 ± 2.24 |
|
Regression tree |
10.33 ± 8.63 |
-3.06 ± 8.25 |
16.8 ± 3.75 |
|
Neural network |
11.2 ± 10.756 |
6.54 ± 6.88 |
17.20 ± 4.33 |
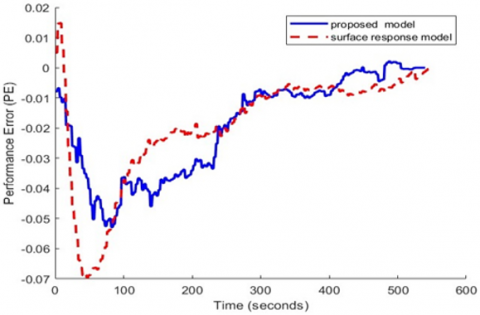
Table 3 presents the experimental outcomes of a comparison between our proposed model, the transformer-based technique [13], and the PK-PD method [27]. The evaluation metrics indicate that the proposed model exhibits superior performance compared to both the baseline method and the PK-PD method, as shown in Table 3. Figure 4 shows the average performance error (PEs) of both the proposed regression model and the response surface model during the induction and maintenance phases of general anesthesia for 50 test cases. Furthermore, we employ the concordance correlation coefficient (CCC) to quantify the correlation between predicted and the actual BIS values. The proposed model's CCC (95% confidence interval) is 0.860 [0.851 to 0.864], which is considerably greater than those of the PK-PD method (0.560 [0.540 to 0.570]) and the transformer-based method (0.677 [0.665 to 0.691]). Practical applications often configure the DOA prediction to forecast the BIS value at one-second intervals. The proposed approach consistently predicts the BIS value in a just 0.0471 seconds. It means that our model is suitable for the use of real-time monitoring and closed loop control in anesthesia.
The proposed regression model architecture offers significant advantages in terms of its versatility and adaptability. Firstly, the requirement for regular blood samples and drug concentration analysis, which is a significant constraint in standard PK-PD investigations due to financial or ethical considerations, is not necessary. Second, the proposed regression model enables rapid testing of the effects of numerous covariates. Instead of using PK-PD parameters, our model establishes a direct link between covariates and effect, which eliminates the high dimensionality problem that comes with traditional covariate modeling. Lastly, it is an excellent extensibility option for machine learning algorithms, hardware, and software that are undergoing rapid development. The improved BIS prediction accuracy achieved with the least squares regression kernel model has significant clinical implications. It allows for more precise control of anesthetic depth, enhancing patient safety by minimizing the risks of under- or over-dosing. Accurate BIS prediction facilitates better intraoperative monitoring, leading to more stable hemodynamic and respiratory conditions, quicker patient recovery, and potentially shorter hospital stays. Additionally, the model's reliability supports anesthesiologists in making more informed decisions, thus improving overall anesthesia management and patient outcomes.
(a) Performance error of induction phase
(b) Performance error of maintenance phase
Figure 4. Performance errors of proposed regression model and response surface model during induction and maintenance phases during general anesthesia for test cases (50 patients)
In order to assist in determining the most effective dosage of an injected drug, the target-controlled infusion pump's display may include the BIS prediction curve. In contrast to learning processes, the application of regression model results to current target controlled infusion devices is immediate due to the fact that calculating the BIS from inputs requires only a low level of computational performance. It is challenging to resolve conflicts of interest between ease of comprehension and performance enhancement in empirical modeling. Second, the dataset used in this study has several limitations that may affect the generalizability of the results. For example, the data was collected exclusively from June to September, which may not capture seasonal variations in patient responses to anesthesia. In addition, all cases were sourced from a single institution, limiting the diversity of the patient population and clinical practices. These constraints mean that the findings might not be representative of other time periods or settings, potentially reducing the applicability of the model to broader and more varied clinical environments. Third, data-driven models can suffer from a lack of compatibility with actual physiological processes. Fourth, we cannot assert that our proposed model completely resolves the issue of serial correlation between the predicted BIS values. Fifth, unanticipated clinical circumstances, such as a modification in the rate of carrier fluid infusion or the interruption of the fluid line, could have potentially compromised the performance of the proposed model. Ultimately, future research should focus on expanding the dataset to include cases from different sources and across all seasons to enhance the model's generalizability. Additionally, incorporating a more diverse patient population with varying demographics and clinical conditions could improve the robustness of the model. Exploring the integration of additional machine learning techniques and hybrid models could further optimize BIS prediction accuracy. Validating the model in real-world clinical settings and examining its performance in various anesthetic protocols would be beneficial for practical application.
This study presents a novel method for predicting the Bispectral Index (BIS) during general anesthesia using regression models that incorporate pharmacokinetic (PK) model outputs and patient-specific data. The five regression learning demonstrated superior performance in predicting BIS compared to traditional PK-PD models and transformer-based approaches. Among these, the least squares regression kernel model emerged as the most accurate, showing a significant improvement in prediction accuracy with a concordance correlation coefficient (CCC) of 0.860 [0.851 to 0.864]. The key findings indicate that regression-based models can effectively predict BIS values, providing a viable alternative to existing methods. This has significant implications for enhancing closed-loop control applications and optimizing anesthetic management during surgeries.
Future work should focus on expanding the dataset to include more diverse patient populations and different clinical settings, as well as exploring additional machine learning techniques to further improve prediction accuracy. Validating the model in real-world clinical environments will be crucial for ensuring its practical applicability and effectiveness in enhancing patient care during general anesthesia.
|
BIS |
dimensionless bispectral index |
|
PK |
pharmacokinetic |
|
PD |
pharmacodynamic |
|
DOH |
dimensionless depth of hypnosis |
|
DOA |
dimensionless depth of anesthesia |
|
SVM |
suport vector machine |
|
SVR |
support vector regression |
|
CI |
confidence interval |
|
EEG |
electroencephalogram |
|
TCI |
target controlled infusion |
|
Ce |
concentration efectsite |
|
CP |
plasma concentration |
|
LSTM |
long short term memory |
|
SDAE |
sparse denoising autoencoder |
|
GRN |
gate residual network |
|
lbm |
lean body mass |
|
LOU |
level of unconsciousness |
|
LOWESS |
locally weighted scatter plot smoothing |
|
RMSE |
root mean square error |
|
MDAPE |
median absolute performance error |
|
MDPE |
median performance error |
|
PE |
performance error |
|
CCC |
concordance correlation coefficient |
|
TIVA |
total intravenous anesthesia |
|
SD |
standard deviation |
[1] Fahruzi, I., Purnama, E., Ketut, I., Yoshimoto, K., Takahashi, H., Purnomo, M.H. (2021). A new approach to predict potential sleep disorder based on fractal analysis from non-overlapping single lead ECG using support vector machine. International Journal of Intelligent Engineering & Systems, 14(2): 361-376. https://doi.org/10.22266/ijies2021.0430.33
[2] Namel, A.T., Sahib, M.A. (2023). Optimized intelligent PID controller for propofol dosing in general anesthesia using coati optimization algorithm. In National Conference on New Trends in Information and Communications Technology Applications, pp. 223-237. https://doi.org/10.1007/978-3-031-62814-6_16
[3] Schamberg, G., Badgeley, M., Brown, E.N. (2020). Controlling level of unconsciousness by titrating propofol with deep reinforcement learning. In Artificial Intelligence in Medicine: 18th International Conference on Artificial Intelligence in Medicine, AIME 2020, Minneapolis, MN, USA, pp. 26-36. https://doi.org/10.1007/978-3-030-59137-3_3
[4] Maciąg, T.T., van Amsterdam, K., Ballast, A., Cnossen, F., Struys, M.M. (2022). Machine learning in anesthesiology: Detecting adverse events in clinical practice. Health Informatics Journal, 28(3): 14604582221112855. https://doi.org/10.1177/14604582221112855
[5] van Heusden, K., Soltesz, K., Cooke, E., Brodie, S., West, N., Görges, M., Dumont, G.A. (2019). Optimizing robust PID control of propofol anesthesia for children: Design and clinical evaluation. IEEE Transactions on Biomedical Engineering, 66(10): 2918-2923. https://doi.org/10.1109/TBME.2019.2898194
[6] Eleveld, D.J., Colin, P., Absalom, A.R., Struys, M.M.R.F. (2018). Pharmacokinetic–pharmacodynamic model for propofol for broad application in anaesthesia and sedation. British Journal of Anaesthesia, 120(5): 942-959. https://doi.org/10.1016/j.bja.2018.01.018
[7] Gonzalez-Cava, J.M., Reboso, J.A., Calvo-Rolle, J.L., Mendez-Perez, J.A. (2020). Adaptive drug interaction model to predict depth of anesthesia in the operating room. Biomedical Signal Processing and Control, 59: 101931. https://doi.org/10.1016/j.bspc.2020.101931
[8] Lee, J., Woo, J., Kang, A.R., Jeong, Y.S., Jung, W., Lee, M., Kim, S.H. (2020). Comparative analysis on machine learning and deep learning to predict post-induction hypotension. Sensors, 20(16): 4575. https://doi.org/10.3390/s20164575
[9] Eleveld, D.J., Proost, J.H., Vereecke, H., Absalom, A.R., Olofsen, E., Vuyk, J., Struys, M.M. (2017). An allometric model of remifentanil pharmacokinetics and pharmacodynamics. Anesthesiology, 126(6): 1005-1018. https://doi.org/10.1097/ALN.0000000000001634
[10] Lee, H.C., Ryu, H.G., Chung, E.J., Jung, C.W. (2018). Prediction of bispectral index during target-controlled infusion of propofol and remifentanil: A deep learning approach. Anesthesiology, 128(3): 492-501. https://doi.org/10.1097/ALN.0000000000001892
[11] Li, R., Wu, Q., Liu, J., Wu, Q., Li, C., Zhao, Q. (2020). Monitoring depth of anesthesia based on hybrid features and recurrent neural network. Frontiers in Neuroscience, 14: 26. https://doi.org/10.3389/fnins.2020.00026
[12] Aubouin-Pairault, B., Fiacchini, M., Dang, T. (2023). Data-based pharmacodynamic modeling for BIS and mean arterial pressure prediction during general anesthesia. In 2023 European Control Conference (ECC), Bucharest, Romania, pp. 1-6. https://doi.org/10.23919/ECC57647.2023.10178214
[13] He, Y., Peng, S., Chen, M., Yang, Z., Chen, Y. (2023). A transformer-based prediction method for depth of anesthesia during target-controlled infusion of propofol and remifentanil. IEEE Transactions on Neural Systems and Rehabilitation Engineering. 31: 3363-3374. https://doi.org/10.1109/TNSRE.2023.3305363
[14] Gambús, P.L., Jensen, E.W., Jospin, M., Borrat, X., Pallí, G.M., Fernández-Candil, J., Troconiz, I.F. (2011). Modeling the effect of propofol and remifentanil combinations for sedation-analgesia in endoscopic procedures using an Adaptive Neuro Fuzzy Inference System (ANFIS). Anesthesia & Analgesia, 112(2): 331-339. https://doi.org/10.1213/ANE.0b013e3182025a70
[15] Caiado, D.V., Lemos, J.M., Costa, B.A., Silva, M.M., Mendonça, T.F. (2013). Design of depth of anesthesia controllers in the presence of model uncertainty. In 21st Mediterranean Conference on Control and Automation, Platanias, Greece, pp. 213-218. https://doi.org/10.1109/MED.2013.6608724
[16] Naşcu, I., Oberdieck, R., Pistikopoulos, E.N. (2015). An explicit hybrid model predictive control strategy for intravenous anaesthesia. IFAC-PapersOnLine, 48(20): 58-63. https://doi.org/10.1016/j.ifacol.2015.10.115
[17] Ionescu, C.M., De Keyser, R., Torrico, B.C., De Smet, T., Struys, M.M., Normey-Rico, J.E. (2008). Robust predictive control strategy applied for propofol dosing using BIS as a controlled variable during anesthesia. IEEE Transactions on Biomedical Engineering, 55(9): 2161-2170. https://doi.org/10.1109/TBME.2008.923142
[18] Schnider, T.W., Minto, C.F., Shafer, S.L., Gambus, P.L., Andresen, C., Goodale, D.B., Youngs, E.J. (1999). The influence of age on propofol pharmacodynamics. The Journal of the American Society of Anesthesiologists, 90(6): 1502-1516. https://doi.org/10.1097/00000542-199906000-00003
[19] Schiavo, M., Consolini, L., Laurini, M., Latronico, N., Paltenghi, M., Visioli, A. (2021). Optimized robust combined feedforward/feedback control of propofol for induction of hypnosis in general anesthesia. In 2021 IEEE International Conference on Systems, Man, and Cybernetics (SMC), Melbourne, Australia, pp. 1266-1271. https://doi.org/10.1109/SMC52423.2021.9658702
[20] Schamberg, G., Badgeley, M., Meschede-Krasa, B., Kwon, O., Brown, E.N. (2022). Continuous action deep reinforcement learning for propofol dosing during general anesthesia. Artificial Intelligence in Medicine, 123: 102227. https://doi.org/10.1016/j.artmed.2021.102227
[21] Lee, H.C., Jung, C.W. (2018). Vital recorder—A free research tool for automatic recording of high-resolution time-synchronised physiological data from multiple anaesthesia devices. Scientific Reports, 8(1): 1527. https://doi.org/10.1038/s41598-018-20062-4
[22] Wijaya, A., Adji, T.B., Setiawan, N.A. (2021). Logistic regression based feature selection and two-stage detection for EEG based motor imagery classification. International Journal of Intelligent Engineering & Systems, 14(1): 134-146. https://doi.org/10.22266/IJIES2021.0228.14
[23] Amanuel, O., Alazzawi, Y. (2023). Design and implementation of EEG-based smart structure. International Journal of Intelligent Engineering & Systems, 16(1): 314-327. https://doi.org/10.22266/ijies2023.0228.28
[24] Shinde, S.B., Lahari, K., Garimella, K.C., Sree, V.S., Pikle, N.K., Bhavekar, G.S., Raghuwanshi, M. (2023). Experimental analysis of heart disease prediction using machine learning with emphasis on hyper parameter tuning and recursive feature elimination. International Journal of Intelligent Engineering & Systems, 16(6): 85-100. https://doi.org/10.22266/ijies2023.1231.08
[25] Deepak, H.A., Vijayakumar, T. (2021). ECG signal classification with hybrid features using bayesian optimized knearest neighbors classifier. International Journal of Intelligent Engineering & Systems, 14(6): 50-65. https://doi.org/10.22266/ijies2021.1231.06
[26] Jayashekar, V., Pandian, R. (2022). Hybrid feature extraction for EEG motor imagery classification using multi-class SVM. International Journal of Intelligent Engineering & Systems, 15(4): 20-30. https://doi.org/10.22266/ijies2022.0831.03
[27] Short, T.G., Hannam, J.A., Laurent, S., Campbell, D., Misur, M., Merry, A.F., Tam, Y.H. (2016). Refining target-controlled infusion: An assessment of pharmacodynamic target-controlled infusion of propofol and remifentanil using a response surface model of their combined effects on bispectral index. Anesthesia & Analgesia, 122(1): 90-97. https://doi.org/10.1213/ANE.0000000000000386