Hiba Nadhim A. Al-Kaoaz*![]() | Ahmed Nasser B. Alsammak
| Ahmed Nasser B. Alsammak![]()
© 2024 The authors. This article is published by IIETA and is licensed under the CC BY 4.0 license (http://creativecommons.org/licenses/by/4.0/).
OPEN ACCESS
One of the main selling features of the hybrid power generating system, which is driving its growing popularity, is the integration of renewable energy sources into the conventional power grid. This integration is one of the main reasons behind the growing popularity of the hybrid power-generating system. These generations provide the necessary power during transient disturbances and steady-state demand to maintain the system within the voltage stability boundaries. This study will provide a hybrid energy system and conduct an in-depth investigation into the stability of the voltage. A solar photovoltaic array (SPVA), wind turbine (WT), and distribution generators (DGs) are the components of the hybrid energy system that has been described. This study aims to analyze the system and support the weakest regions. ETAP software will be utilized to model the IEEE 42 bus standard system, including the hybrid system that will be constructed. The entirety of the system will also be investigated and simulated for a variety of case studies. During this process, consideration will be given to the effect of adopting techniques, such as capacitor bank (Cb), SPVA, WT, DGs, and hybrid energy system (HES), which consist of all these components to maintain a high power margin for voltage stability. The results show that injecting a 5MW plus optimal Cb using HES on two of the five weakest regions (WRs) of the IEEE 42 bus system reduces the overall system losses and increases the power margin for all WRs, which increases voltage stability.
voltage stability, hybrid energy system, ETAP, V-Q sensitivity, P-V curves, solar photovoltaic array, wind turbines, capacitor bank, RES
The issue of voltage stability has become a primary topic of concern in the electric utility industry, as electric power utilities today face many difficulties due to the increasing complexity of their operations and organizational structures [1]. Voltage instability has also attracted attention recently. Competitive bidding and poor generation scheduling cause voltage instability in an unregulated power market. Thus, many electrical utilities and academics have focused on static voltage stability system studies to reduce or eliminate voltage instability. Static voltage stability with continuation power flow (CPF) studies and optimization methods are used to determine the system voltage stability margin or load margin (LM) [2]. Facilities and academics create programs using these methods of study. Load flow calculations, including forecast and corrector phases, are solved using CPF. Based on an objective function and constraint, the optimization solves equations for necessary conditions, where breakdown voltages and excessively high or low voltages affect several sizeable interconnected power systems [3].
Transmission line load, insufficient local reactive supply, and long-distance power charging cause these voltage problems. Voltage breakdown is a significant voltage instability caused by a power system voltage drop under load [4]. This causes the voltage on the power system buses to decrease slowly and rapidly during a voltage breakdown. If they are located in low-voltage locations, small generator tripping can increase the transmission network's reactive power losses, leading to severe voltage drops and stability problems [5]. Voltage stability is a local phenomenon affected by load characteristics, "Voltage stability refers to the ability of a power system to maintain a constant voltage on all buses in the system after being perturbed from a certain initial operating condition", according to the IEEE/CIGRE joint working group study [6]. There are numerous approaches to voltage stability analysis, including static and dynamic voltage stability assessments. The voltage stability analysis approach can be chosen according to the microgrid stability mechanism. Static analysis methodologies use static operational parameters of micro grids to discover the primary elements influencing voltage stability. Static analysis methodologies solely address the static functioning of micro grid systems, with the real-time variable differential equation set to zero. Static analysis methodologies are currently mostly based on load flow assessments, such as P-V, V-Q, and V-Q sensitivity analysis. Dynamic voltage stability analysis methods are useful for analyzing voltage collapse and measuring the effect of a control approach. Dynamic analysis methods are related to transient analyses of power systems, which use a set of differential equations to model the systems. Most dynamic voltage stability studies still rely on the system's static operational characteristics due to the slow dynamic influence on stability [7]. These disturbances can be processed and controlled in many ways to improve voltage stability and rebalance the system, such as reactive power control with the use of flexible alternating current transmission system (FACTS) equipment, such as STATCOM, D STATCOM, UPQC, and so on, these will be instrumental in controlling the power and its quality [8, 9]. The majority of renewable energy sources (RES) technologies are intermittent due to their reliance on climatic conditions, fluctuating environmental factors, and/or time limitations. This leads to demand generation imbalances, which have a detrimental impact on the voltage and frequency of the power grid, hence compromising its stability due to a shortage of generation units that can supply reserve power. Furthermore, the inertia constant of modern power systems is reduced since the renewable energy sources (RESs) are disconnected from the alternating current (AC) grid through the use of power converters. Thus, under normal circumstances, RESs are unable to engage in frequency regulation alongside traditional generation sources [10, 11].
Variable-speed wind turbines do better as they grow. The ability of a variable wind turbine to operate at varying wind speeds and the isolation of the power electronic device from the mechanical and electrical parts of a wind power plant are significant factors, as mechanical unpredictability does not affect the electrical or grid side of wind power. Variable-speed wind power systems use double-feed induction generators and fully rated-transformers. Reactive wind power injection increases system voltage and load ability [12, 13]. Wind power plants can meet load demand and improve voltage stability. However, power injection and its unpredictable features may increase the difficulties of power system operation and control [14-16].
The integration of wind power plants requires the stability of the energy system [16, 17]. Photovoltaic sources generate intermittent electricity because clouds, fog, rain, dust storms, etc., affect solar radiation and temperature, and there is no night solar energy, so grid injection will be intermittent with high photovoltaic penetration. Cloud cover can significantly reduce the photovoltaic system's output, which affects generation [18]. Voltage stability, the ability of the grid for a power system to maintain stable voltages throughout the grid after a grid disturbance occurs under nominal operation, is a serious challenge with the high penetration of intermittent PV power sources. To ensure the power grid's reliability with increasing penetration of intermittent power sources such as solar PV systems, the voltage stability of the electrical grid needs to be evaluated [19-21].
Previous research has predominantly focused on utilizing FACTS devices and individual hybrid energy systems to enhance voltage stability. In contrast, this study individually examines the impact of hybrid energy systems on voltage stability. As a collective group. this study also uses a genetic algorithm to find the optimal size and location of capacitor banks in a hybrid system.
This paper proposes and represents the IEEE 42 bus system using the ETAP program. Voltage stability analysis was done, and the weakest regions were identified using P-V and Q-V curves. Most voltage security estimates use those curves. Power-flow solutions generate those curves to calculate a power system's loading margin [22]. The V-Q sensitivity method is also used to identify the weakest regions where the power flow Jacobian matrix is essential to the V-Q sensitivity. In complicated power systems, it can predict voltage instability [23, 24]. After identifying the weakest regions, DG, SPVA, WT, and HES, Cb are added individually to different locations in these weakest regions to improve the voltage stability in this work. The results compare the effect of adding these systems with traditional devices, such as Cb, to improve voltage stability.
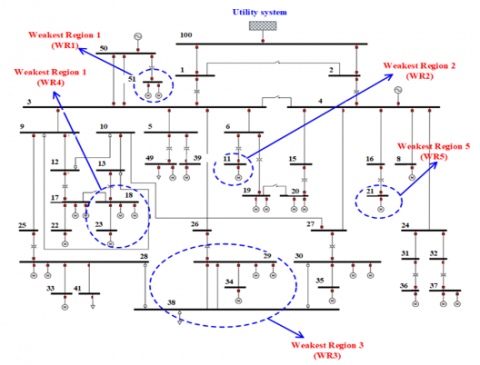
Figure 1. IEEE 42 bus proposed system
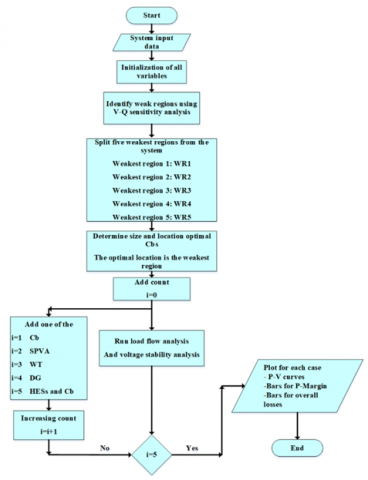
Figure 2. Overall flow chart for the proposed procedures
In this study, the IEEE 42 Bus system was simulated, replicating the model distribution system shown in Figure 1. A 13.8 kV, 60 Hz three-feeder distribution subsystem communicates via a 69 kV radial line with a more extensive network. The 13.8 kV substation bus is connected to the utility grid via a transformer and a 69 kV wire. The network at the end of the 69 kV line is represented by a 69 kV bus with a 1000 MVA short-circuit capacity. Conventional generators are connected to a voltage of 13.8 kV. The conventional generators are coupled to a voltage of 13.8 kV each. Only a few motors are linked to the 2.4 kV buses; the rest are attached to the 0.48 kV buses. As a result, the system is suitable for investigating stability. The weakest regions (WRs) were determined and fixed, as shown in Figure 1 [25].
This paper uses ETAP to investigate the weakest regions in the proposed system; where IEEE 42 bus standard system was used as a case study because it has different voltage levels and loads in addition to may connection transmission lines, so it is suitable for voltage stability study [26-28].
The work in this paper is divided into six parts. The first one is a normal case, and the other five include adding Cb, SPVA, WT, DGs, and HESs in addition Cb; Figure 2 shows the flow chart for the proposed procedures.
V-Q sensitivity evaluates the relationship between voltage change and reactive power change, and is one of the main methods used to analyse voltage stability [29]. The eigenvalues relate to a voltage and reactive power change type that can provide a relative measure of voltage instability [30]. The participation factor values can be used to identify the system's weakest bus [31]. The power voltage equations for a linearized steady-state system are as follows:
$\left[\begin{array}{l}\Delta P \\ \Delta Q\end{array}\right]=\left[\begin{array}{ll}J_{p \delta} & J_{p V} \\ J_{q \delta} & J_{q V}\end{array}\right]\left[\begin{array}{l}\Delta \delta \\ \Delta V\end{array}\right]$ (1)
where: $\Delta \mathrm{P}=$ Incremental change in bus real power, $\Delta \mathrm{Q}=$ Incremental change in bus reactive power, $\Delta \delta=$ Incremental change in bus voltage angle and $\Delta \mathrm{V}=$ the incremental change in bus voltage. The Jacobian matrix in (1) is identical to the Jacobian matrix used when the power flow equations are solved using the Newton-Raphson technique when the standard power flow model is utilized for voltage stability analysis [30].
$P$ and $Q$ both have an impact on system voltage stability. However, hold $\mathrm{P}$ at a constant value at each operational point and assess voltage stability by considering the incremental relationship between $\mathrm{Q}$ and $\mathrm{V}$. Based on these arguments, the expression (1) if $\Delta \mathrm{P}=0$, gives:
$\left[\begin{array}{c}0 \\ \Delta Q\end{array}\right]=\left[\begin{array}{ll}J_{p \delta} & J_{p V} \\ J_{q \delta} & J_{q V}\end{array}\right]\left[\begin{array}{c}\Delta \delta \\ \Delta V\end{array}\right]$ (2)
$\Delta Q=\left(-J_{q \delta} \cdot J_{p \delta}^{-1} \cdot J_{p V}+J_{q V}\right) \cdot \Delta V=J_R \cdot \Delta V$ (3)
$J_R=J_{q V}-J_{q \delta} \cdot J_{p \delta}^{-1} \cdot J_{p V}$ (4)
$J_R$ is the system's reduced Jacobian matrix (2). It is the linearized relationship between $\Delta V$ and $\Delta Q$.
The system is voltage stable if the smallest eigenvalue of JR is more significant than zero. The critical mode's left and right eigenvectors can determine bus participation factors. Critical buses in the connected power network have high participation factors [32].
It is essential to use JRto carry out voltage stability analysis. The V-Q sensitivity at the bus is the diagonal element. This is the slope of the QV curve at a specific operating point. The following criteria are used in V-Q sensitivity studies to determine the impact of reactive power on voltages [33].
The V-Q sensitivity value is the normalized ∂V/∂Q component in the reduced V-Q Jacobian matrix. The normalization is based on the system buses' most significant ∂V/∂Q component. This method involves using a reduced Jacobian matrix, system modes, and the participation factor of each load bus. The technique is used to determine the minimum eigenvalue and the associated eigenvectors of the reduced Jacobian matrix of the power system. The eeigenvalues are linked to a mode encompassing voltage and reactive power fluctuations. A system is deemed voltage stable if all its voltage eigenvalues are positive. If any of the eigenvalues is negative, the system is said to be voltage unstable, as demonstrated below [33]:
3.2 P-V curve
The P-V curves are often used to characterize system-stable operating zones. Moreover, it provides sufficient data on active power margin and voltage magnitude due to different disturbances. The p-v curve provides data about the system's operation zones. At the same time, v-q sensitivity identifies the weak bus so it can describe the two methods as complementary to each other. A circuit model can describe a power system, where generators are the source and loads are the sink. To generate the $\mathrm{P}-\mathrm{V}$ curve depicted in Figure 3, the power transfer between the source and sink is increased. The voltage on a specific bus is determined by the absolute power transferred, line reactance, and load power factor. As the load increases, the voltage falls and approaches a critical threshold; any further increase in load causes system instability. Consider a basic system consisting of a power source with voltage $\mathrm{E} \angle \delta$ and a load at voltage $\mathrm{V} \angle 0$ fed by an infinite bus transmission system [34]. The active and reactive powers are obtained by Eqs. (5) and (6) when the transmission line resistance is neglected [22,35].
$P=\frac{E V}{X} \operatorname{Sin} \delta$ (5)
$Q=\frac{E V}{X} \operatorname{Cos} \delta-\frac{V^2}{X}$ (6)
P-V curves illustrate the correlation between the load inside a specific region and the bus voltage at various power factors.
Where $\tan \varphi=\frac{Q}{P}$. Since this study does not consider the load angle, it can be eliminated. Let $p=\frac{P X}{E^2}, q=\frac{Q X}{E^2}$ and $v=$ $\frac{V}{E}$. Normalizing Eqs. (5) and (6) using short circuit power.
$S=\frac{E^2}{X}$ (7)
$p=v \operatorname{Sin} \delta$ (8)
$q=v \operatorname{Cos} \delta-v^2$ (9)
Figure 3. Receiving end voltage vs real power loading curve [35]
After determining the weakest regions, the work in this paper is divided into six parts described below. Part I: normal case heavy load; Part II adding Cb; Part III adding SPVA; Part IV adding WT; Part V adding DG; Part VI adding HES in addition Cb. All additional systems were added in different weakest regions.
Part I:
The loads were increased in this part for the purpose of the study, reaching the maximum rating for the main transformers. Table 1 depicts the weakest regions in the proposed system, representing the weakest buses prone to voltage collapse if disturbed. Figure 4 shows that the ranking for each bus is determined via sensitivity analysis. The bus with a rank equal to one has the greatest sensitivity to changes in reactive power. Figure 5 shows the results of the analysis of the proposed system in a normal case.
Table 1. V-Q sensitivity normal case
|
Bus ID: Bus Name |
Rank # |
V-Q Sensitivity |
Weakest Regions No. |
|
23: T6MCC |
1 |
1.000 |
WR4 |
|
51: AUX |
2 |
0.930 |
WR1 |
|
38: 480TIE |
3 |
0.926 |
WR3 |
|
18: T6SEC |
4 |
0.919 |
WR4 |
|
21: T9SEC |
5 |
0.914 |
WR5 |
|
11: T4SEC |
6 |
0.896 |
WR2 |
Figure 4. V-Q sensitivity in normal case
Figure 5. Nose curves for the proposed system are in normal case
Part II:
As shown in Figure 4 there are five weakest regions that have V-Q sensitivity between 0.9 and 1. In this part study was done on the optimal size and location for capacitor bank as shown in Table 2, where these optimal capacitor bank were added in the weakest regions, individually.
Table 2. Location of optimal capacitor bank and its values
|
Weakest Regions No. |
Capacitor Bank No. |
Weakest Bus No. |
Rated Mvar/Bank |
|
WR1 |
5 |
Bus 51 |
0.1 |
|
WR2 |
7 |
Bus 11 |
0.2 |
|
WR3 |
6 |
Bus 29 |
0.1 |
|
WR4 |
6 |
Bus 18 |
0.18 |
|
WR5 |
7 |
Bus 21 |
0.1 |
The results for P margin versus adding Cb are shown in Figure 6, where the bus will be closer to the collapse point by decreasing the power margin. Adding Cb in any one of the weakest regions results in an increased power margin in the other regions, which allows the system to avoid voltage collapse.
Figure 6. P margin vs addition capacitor banks are in the weakest regions
It is noted from Figure 6 that the highest increase in the value of power margin is when adding Cb to WR3, but the most effective addition in more than one region is when adding Cb to WR4 and WR5.
Part III:
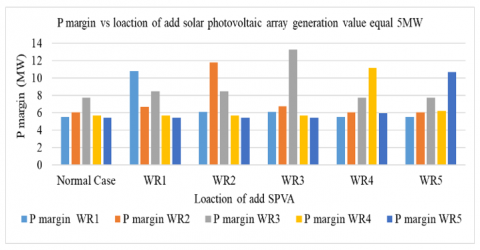
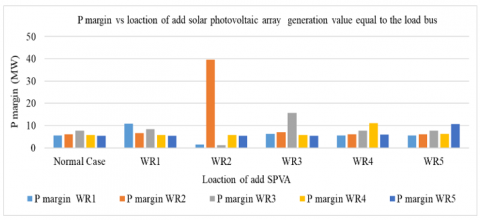
In this part, SPVA was added with a two-generation value, one of 5 MW and the other equal to the load bus (power load compensation); individually, the results of this case are shown in Figures 7 and 8, respectively.
Figure 7. P margin vs additional solar photovoltaic array at WRs generation equal 5MW
Figure 8. P margin vs addition solar photovoltaic array at WRs generation equals the load bus
As illustrated in Figures 7 and 8, adding SPVA in the WR4 and WR5 is the optimal situation for minimizing overall losses and boosting the power margin in the weakest regions, allowing the system to avoid voltage collapse. While adding SPVA to the WR2 is the worst case since the P margin is reduced and increasing overall losses. Although the highest increase in power margin is at WR2 as shown in Figure 8, it includes a huge decrease in power margin to represent the worst case.
Part IV:
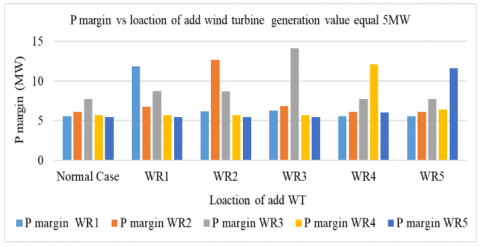
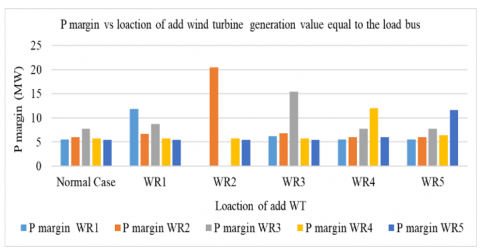
In this part, WT was added with a two-generation value, one of 5 MW and the other equal to the load bus (power load compensation), individually, the results are shown in Figures 9 and 10, respectively.
Figure 9. P margin vs addition wind turbine at WRs generation equal 5MW
As illustrated in Figures 9 and 10, adding WT in the WR4 and WR5 is the optimal situation for minimizing overall losses and boosting power margin in the weakest regions, allowing the system to avoid voltage collapse. While adding WT to the WR2 is the worst case since the P margin is reduced and increasing overall losses. Although the addition to WR2 includes the highest increase in power margin, it also includes a significant decrease in power margin in more than one region, and for this reason, this case is considered the worst case.
Figure 10. P margin vs addition wind turbine at WRs generation equal to the load bus
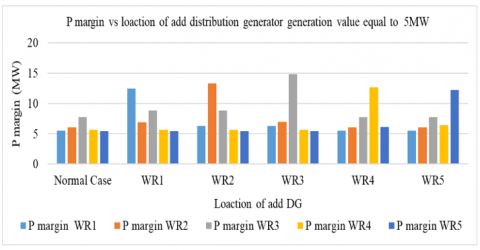
Part V:
In this part, DG was added with a two-generation value, one of 5 MW and the other equal to the load bus (power load compensation), individually; the results of this case are shown in Figures 11 and 12, respectively.
Figure 11. P margin vs addition distribution generator at WRs generation equal 5MW
Figure 12. P margin vs addition distribution generator at WRs generation equal to the load bus
As illustrated in Figures 11 and 12, adding DG in the WR4 and WR5 is the optimal situation for minimizing overall losses and boosting the power margin in the weakest regions, allowing the system to avoid voltage collapse. At the same time, adding DG to the WR2 is the worst case since the P margin is reduced and overall losses are increased. In spit of WR2, it experienced the most significant value in power margin with the addition.
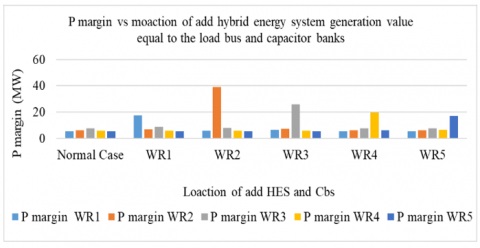
Part VI:
In this part, HES and Cb were added with a two-generation value, one of 5 MW and the other equal to the load bus (power load compensation), individually. The results of this case are shown in Figures 13 and 14, respectively.
Figure 13. P margin vs addition hybrid energy system and capacitor banks at WRs generation equal 5MW
Figure 14. P margin vs addition hybrid energy system and capacitor banks at WRs generation equal to the load bus
As illustrated in Figures 13 and 14, adding HES and Cb in the WR4 and WR5 is optimal for minimizing overall losses and boosting the power margin in the weakest regions, allowing the system to avoid voltage collapse. Adding HES and Cb to the WR2 is the worst case since the P margin is increased for this region and reduced for others with increasing overall losses. Although the addition to WR2 includes the highest increase in power margin, it does not represent the optimal case because the increase in power margin is limited to one region, while the addition to WR4 and WR5 includes an increase in power margin in more than one region.
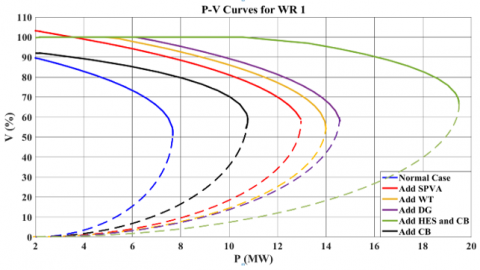
Figure 15. P-V curves for WR1 with added HES and Cb individually at WR1 generation equal 5MW
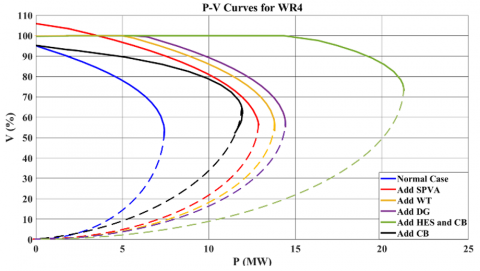
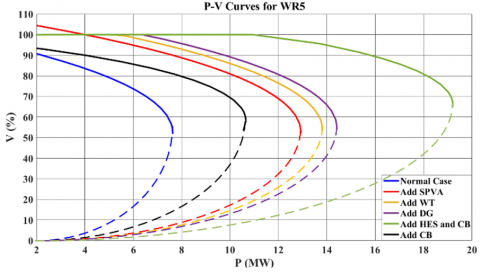
Figures 15 to 21 represent the P-V curves for all cases. These figures show that integrating the HES and Cb greatly improved the P-V curves by increasing the power margin in the WRs.
Figure 16. P-V curves for WR2 with added HES and Cb individually at WR2 generation equal 5MW
Figure 17. P-V curves for WR2 with added HES and Cb individually at WR2 generation equal to the load bus
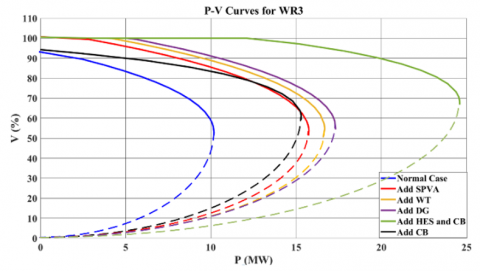
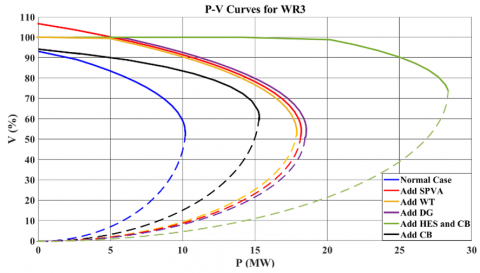
Figure 18. P-V curves for WR3 with added HES and Cb individually at WR3 generation equal 5MW
Figure 19. P-V curves for WR3 with added HES and Cb individually at WR3 generation equal to the load bus
Figure 20. P-V curves for WR4 with added HES and Cb individually at WR4 generation equal 5MW
Figure 21. P-V curves for WR5 with added HES and Cb individually at WR5 generation equal 5MW
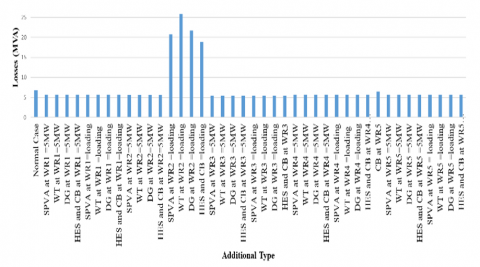
Figure 22. Overall system losses in the normal case and in cases of adding traditional support generation to WRs
Figure 23. Overall system losses in the normal case and in cases of adding HES support generation to WRs individually
It is noted from Figures 15-21 that the most significant increase in power margin is when adding the hybrid generation system and capacitors, as the system moved away from the voltage collapse point significantly compared to the other additions. Therefore, this case is considered the optimal case of addition, and this is what was highlighted in this study. The greatest support. For weak regions, when adding the hybrid system and capacitor banks.
Figures 22 and 23 show that the voltage of all weakest regions is about 0.9 p.u. This value reaches about 1.05 p.u. at the initial load when adding SPVA. The P Margins of the weakest regions are increased when using the Hybrid system compared to normal and other additional systems.
Real power loss, cost, and voltage stability index have more priority among power objectives. Several methods can be used to inject (add) electrical energy into the power system to solve the voltage instability problem and reduce the total losses. But, these methods can't be applied directly using any type, value, or location.
In this work, A capacitor bank (Cb) is used for the reactive power compensation, in addition to solar photovoltaic array (SPVA), wind turbines (WTs), distributed generators (DGs), and hybrid energy system (HES) are used as energy source systems (ESS) for the weakest regions of the proposed system (IEEE- 42 bus) to improve the voltage stability. Two stability indexes are used to determine the optimal placement of supported Cb and ESS: V-Q sensitivity and P-V curves, which are employed to identify the weakest regions within the power system based on voltage stability analysis, which gives the five weakest regions in the system.
The results demonstrate that HES outperforms others in terms of increasing the P margin and lowering active power losses. The results showed that the best locations for addition are WR4 and WR5, which resulted in the lowest total losses and the greatest increase in power margin for all WRs, while the worst position for addition is WR2, which resulted in an increase in total losses and a decrease in power margin for other regions.
On the other hand, the optimal value of the injection power of 5 MW gives good results when compared with the injection power that is equal to the load power, which provides more P margin and large voltage incremental for the injection bus but on the same time limited effect on the other bus with increasing in the system overall loss. The proposed methodology is certainly limited with the utility decision-makers, which can resize and relocate the inserting number of SPVA, WT, and DG.
The authors thank the University of Mosul College of Engineering for cooperating with this research.
[1] Thannimalai, P., Raman, R.R., Nair, P., Nithiyananthan, K. (2015). Voltage stability analysis and stability improvement of power system. International Journal of Electrical Computer Engineering, 5(2): 189-197. https://doi.org/1011591/ijece.v5i2.pp189-197
[2] Sreedharan, S., Joseph, T., Joseph, S., Chandran, C.V., J, V., P, V.D. (2020). Power system loading margin enhancement by optimal STATCOM integration - A case study. Computers and Electrical Engineering, 81: 106521. https://doi.org/10.1016/j.compeleceng.2019.106521
[3] Villa-Acevedo, W.M., López-Lezama, J.M., Colomé, D.G. (2020). Voltage stability margin index estimation using a hybrid kernel extreme learning machine approach. Energies, 13(4): 857. https://doi.org/10.3390/en13040857
[4] Eleschová, Ž., Cintula, B., Cenký, M., Beláň, A., Bendík, J., Janiga, P. (2022). Analysis of voltage stability of the Slovak Republic's power system. Processes, 10(12): 2613. https://doi.org/10.3390/pr10122613
[5] Samuel, I.A., Katende, J., Awosope, C.O.A., Awelewa, A.A. (2017). Prediction of voltage collapse in electrical power system networks using a new voltage stability index. International Journal of Applied Engineering Research, 12(2): 190-199.
[6] Hatziargyriou, N., Milanovic, J., Rahmann, C., Ajjarapu, V., Canizares, C., Erlich, I., Vournas, C. (2020). Definition and classification of power system stability–revisited & extended. IEEE Transactions on Power Systems, 36(4): 3271-3281. https://doi.org/10.1109/TPWRS.2020.3041774
[7] Liang, X., Chai, H., Ravishankar, J. (2022). Analytical methods of voltage stability in renewable dominated power systems: A review. Electricity, 3(1): 75-107. https://doi.org/10.3390/electricity3010006
[8] Alhattab, A.S., Alsammak, A.N.B., Mohammed, H.A. (2023). An intelligent mitigation of disturbances in electrical power system using distribution static synchronous compensator. Indonesian Journal of Electrical and Computer Science, 30(2): 633-642. https://doi.org/10.11591/ijeecs.v30.i2.pp633-642
[9] Alhatim, A., Tahir, F., Alsammak, A.N. (2022). Optimization of power quality using the unified power quality conditioner (UPQC) with unbalanced loads. Al-Rafidain Engineering Journal, 27(2): 101-109. https://doi.org/10.33899/rengj.2022.133962.1175
[10] Dreidy, M., Mokhlis, H., Mekhilef, S. (2017). Inertia response and frequency control techniques for renewable energy sources: A review. Renewable and Sustainable Energy Reviews, 69: 144-155. https://doi.org/10.1016/j.rser.2016.11.170
[11] Khan, K.A., Khalid, M. (2021). Improving the transient response of hybrid energy storage system for voltage stability in DC microgrids using an autonomous control strategy. IEEE Access, 9: 10460-10472. https://doi.org/10.1109/ACCESS.2021.3051144
[12] Rosini, A., Labella, A., Bonfiglio, A., Procopio, R., Guerrero, J.M. (2021). A review of reactive power sharing control techniques for islanded microgrids. Renewable and Sustainable Energy Reviews, 141: 110745. https://doi.org/10.1016/j.rser.2021.110745
[13] Adetokun, B.B., Muriithi, C.M. (2021). Impact of integrating large-scale DFIG-based wind energy conversion system on the voltage stability of weak national grids: A case study of the Nigerian power grid. Energy Reports, 7: 654-666. https://doi.org/10.1016/j.egyr.2021.01.025
[14] Li, Y., Ni, Z., Zhao, T., Yu, M., Liu, Y., Wu, L., Zhao, Y. (2020). Coordinated scheduling for improving uncertain wind power adsorption in electric vehicles - wind integrated power systems by multiobjective optimization approach. IEEE Transactions on Industrial Applications, 56(3): 2238-2250. https://doi.org/10.1109/TIA.2020.2976909
[15] Ghanim, A.S., Alsammak, A.N.B. (2020). Modelling and simulation of self-excited induction generator driven by a wind turbine. Eastern-European Journal of Enterprise Technologies, 6(8): 6-16. https://doi.org/10.15587/1729-4061.2020.213246
[16] Adetokun, B.B., Muriithi, C.M., Ojo, J.O. (2020). Voltage stability assessment and enhancement of power grid with increasing wind energy penetration. International Journal of Electrical Power and Energy Systems, 120: 105988. https://doi.org/10.1016/j.ijepes.2020.105988
[17] Al-Kaoaz, H.N.A., Alsammak, A.N.B. (2023). Utilizing hybrid renewable energy systems for enhancing transient stability in power grids: A comprehensive review. Journal of European Systems and Automations, 56(4): 687-696. https://doi.org/10.18280/jesa.560418
[18] Kumar, D.S., Gandhi, O., Rodríguez-Gallegos, C.D., Srinivasan, D. (2020). Review of power system impacts at high PV penetration Part II: Potential solutions and the way forward. Solar Energy, 210: 202-221. https://doi.org/10.1016/j.solener.2020.08.047
[19] Al-Kaoaz, H.N.A., Al-Yozbaky, O.S.A.Y. (2023). Influence of natural clouds on the performance of solar cell systems in Iraq. Bulletin of Electrical Engineering and Informatics, 12(4): 1867-1880. https://doi.org/10.11591/eei.v12i4.4703
[20] Eftekharnejad, S., Vittal, V., Heydt, G.T., Keel, B., Loehr, J. (2012). Impact of increased penetration of photovoltaic generation on power systems. IEEE Transactions on Power Systems, 28(2): 893-901. https://doi.org/10.1109/TPWRS.2012.2216294
[21] Alam, M.J.E., Muttaqi, K.M., Sutanto, D. (2014). An approach for online assessment of rooftop solar PV impacts on low-voltage distribution networks. IEEE Transactions on Sustainable Energy, 5(2): 663-672. https://doi.org/101109/TSTE.2013.2280635
[22] Chary, D.V.M., Subramanyam, M., Kishor, P. (2017). P-V curve method for voltage stability and power margin studies. International Journal of Engineering & Science, 7(5): 11867-11869.
[23] Nor, A.F.M., Sulaiman, M., Kadir, A.F.A., Omar, R. (2016). Voltage instability analysis for electrical power system using voltage stability margin and modal analysis. Indonesian Journal of Electrical Engineering and Computer Science, 3(3): 655-662. https://doi.org/10.11591/ijeecs.v3.i2.pp655-662
[24] Hosseinzadeh, N., Aziz, A., Mahmud, A., Gargoom, A., Rabbani, M. (2021). Voltage stability of power systems with renewable-energy inverter-based generators: A review. Electronics, 10(2): 1-27. https://doi.org/10.3390/electronics10020115
[25] Al-Talaq, M., Al-Muhaini, M. (2022). Optimal coordination of time delay overcurrent relays for power systems with integrated renewable energy sources. Energies, 15(18): 6749. https://doi.org/10.3390/en15186749
[26] Natkar, K., Kumar, N. (2015). Design analysis of 220/132 KV substation using ETAP. International Research Journal of Engineering and Technology, 2(3): 2322-2326.
[27] Oputa, O., Madueme, T.C. (219). Fault analysis on Nigeria 330kV transmission system using ETAP. Nigerian Journal of Technology, 38(1): 202. https://doi.org/10.4314/njt.v38i1.25
[28] Younis, S.A., Alyousif, O.M.M. (2022). Electrical power system harmonics elimination using ETAP. Al-Rafidain Engineering Journal, 27(1): 99-109. https://doi.org/10.3389/rengj.2022.132721.1155
[29] Prabha, K. (1994). Power System Stability and Control. McGraw-Hill, Inc.
[30] Enemuoh, F.O., Onuegbu, J.C., Anazia, E.A. (2013). Modal based analysis and evaluation of voltage stability of bulk power system. International Journal of Engineering Research and Development, 6(12): 71-79.
[31] Ibrahim, M.H., Jasim, A.H. (2021). Voltage collapse prediction of IEEE 30-Bus system. Tikrit Journal of Engineering Sciences, 28(1): 98-112. https://doi.org/10.25130/tjes.28.1.10
[32] Pan, J., Dong, A., Fan, J., Li, Y. (2020). Online static voltage stability monitoring for power systems using PMU data. Mathematics Problems in Engineering, 2020: 6667842. https://doi.org/10.1155/2020/6667842
[33] Djari, M.A., Benasla, L. (2023). Voltage stability assessment using different methods. Elektrotehničeskij vestnik/Electrotechnical Review, 90(4): 206-213.
[34] Hilawie, A., Shewarega, F. (2022). Static voltage stability assessment of Ethiopian power system using normalized active power margin index. EAI Endorsed Transactions on Energy Web, 9(40): 1-14. https://doi.org/10.4108/ew.v9i40.141
[35] Manno, D.G., Sexauer, J.M. (2021). Use of voltage stability assessment and transient stability assessment tools at PJM Interconnection. In 2021 Power Systems Computation Conference (PSCC), Switzerland, pp. 1-8. https://doi.org/10.1007/978-3-030-67482-3_7