Meri Prasetyawati*![]() | Mutmainah
| Mutmainah![]() | Wiwik Sudarwati
| Wiwik Sudarwati![]() | Renty Anugerah Mahaji Puteri
| Renty Anugerah Mahaji Puteri![]() | Umi Marfuah
| Umi Marfuah![]() | Nelfiyanti
| Nelfiyanti![]() | Andreas Tri Panudju
| Andreas Tri Panudju![]()
© 2024 The authors. This article is published by IIETA and is licensed under the CC BY 4.0 license (http://creativecommons.org/licenses/by/4.0/).
OPEN ACCESS
This study aims to design a transportation network in a fresh banana supply chain to minimize the distance, route, and vehicles. The design of the network is based on graph theory, which is the Cheapest Insertion Heuristic Algorithm for Traveling Salesman Program, and is expected to guarantee fresh banana products in a supply chain starting from a supplier of seed, compound fertilizer, PTPN VIII, distribution center (ripening stage), retailers, and consumers. Design of the transportation system in the supply chain of fresh bananas. There are two distribution centers and 26 retail locations in the two cities that must guarantee the availability of fresh bananas to meet the demands of the community in West Java Province. The distribution of fresh bananas in a transport system uses the cheapest insertion heuristic algorithm. Optimization of a fresh banana transportation system will streamline supply chain activities in PTPN VIII, thus ensuring the fulfillment of the demand and availability of fresh banana products in West Java Province. This research has implications for the performance of PTPN VIII in improving the optimization of fresh banana supply chain systems. This study will explicitly describe the distance, routes and optimum vehicle types in order to minimize transportation costs, resulting in a transportation cost reduction of 25.24%.
heuristic algorithm, demand, route, distance, supply chain, transportation
Bananas are the most widely consumed fruit in Indonesian society. This is shown in Figure 1, which presents data on fresh banana consumption by Indonesians. In the figure, the demand for fresh bananas tends to be stationary because the demand is already considered to be the same as the needs of the nine basic commodities consumed daily.
Figure 1. Fresh banana consumption in 2002-2015 [1]
The fresh fruit supply chain is characterized by long supply lead-times combined with significant supply and demand uncertainties and relatively thin margins [2]. To meet the demand for fresh bananas, several governments and private agencies have started competing to provide fresh bananas to the people of Indonesia. Figure 2 presents the fresh banana productivity in Indonesia for the period 2015-2019 [3]. Fresh bananas are produced in Lampung, West Java, and East Java. One state company produced fresh bananas in West Java.
Figure 2. Fresh banana productivity (BPS, 2020)
Thus, sustainability of the availability of fresh banana products must be maintained. It relies on the results of local producers without relying on imported fresh banana products. To anticipate this situation, the availability of fresh bananas must be considered from a supply chain perspective. Supply chains are related to transportation and distribution.
The role of transportation has become increasingly significant in global supply chains [4]. Logistics and transportation managers face a very different environment today than they did a few years ago [5]. Various inventory management methods are typically employed for different types of products based on demand patterns, product attributes, and supply networks [6].
The Cheapest Insertion Heuristic Algorithm is a technique employed to address the Traveling Salesman Problem, which entails determining the most economical route that covers a certain set of sites and returns to the initial point. This algorithm begins by initializing a partial tour, and thereafter inserts the remaining vertices in an iterative manner, selecting the option with the lowest cost. The objective is to reduce the overall distance covered while visiting each location precisely once [7].
The algorithm begins by establishing an initial tour that encompasses two vertices. Subsequently, it chooses a vertex that has not been included in the tour and inserts it into the tour at a position that minimizes the overall increase in the total distance. This procedure is iterated until all vertices are incorporated into the tour. The Cheapest Insertion Heuristic Algorithm is a technique employed for solving the Traveling Salesman Problem. The algorithm is greedy because it consistently chooses the best option at each step to create a tour [8].
The objectives of this study are to (1) analyze forecasts of fresh banana demand and estimate the deviation of demand forecast results, (2) establish the schedule and quantity of product delivery from the Distribution Center, and (3) design a network of transportation systems in a fresh banana supply chain.
Transportation services play a central role in seamless supply chain operations by moving inbound materials from supply sites to manufacturing facilities, repositioning inventories among different plants and distribution centers, and delivering finished products to customers [9].
Almouhanna et al. [10] conducted research to optimize the route in the supply chain to minimize the cost of vehicles owing to their limited availability.
Previous research related to transportation optimization of the Traveling Salesman Program has been conducted. The limitations experienced in the industry have highlighted the importance of identifying the best route with the least distance, while also considering the capacity of the vehicle being used. One potential method to address this issue is to apply the cheapest insertion heuristic algorithm, a model approach for solving the Travelling salesman problem (TSP), to obtain the optimal solution for the TSP problem. This algorithm considers factors such as travel route, cost, and time to determine the most efficient delivery route [11, 12].
Previous research has measured the logistics performance of SME and their derivative products using the SCOR approach [13, 14]. This study highlights the importance of logistics performance associated with distribution and transportation in a supply chain. Moreover, the supply chain transportation system that is designed is commodity-based and perishable; in this case, it is a fresh banana.
The Supply Chain Operations Reference approach has been widely used to fully analyze the logistics performance of small and medium-sized firms and their derivative products.
Nevertheless, there is a lack of research on the precise operational efficiency related to the distribution and transportation of goods throughout a supply chain, specifically for poverty-based and perishable items such as fresh bananas. The significance of this research gap lies in the fact that the transportation of fresh bananas requires specific handling and temperature control to guarantee their arrival at the destination in the best possible state. Prior studies have mostly concentrated on the overall efficiency of logistics and the utilization of generic logistics operational and strategic systems. To fill this void in research, it is imperative to analyze the distinct obstacles and prerequisites related to transportation in the fresh banana supply chain. This involves investigating cutting-edge transportation options, such as cold chain logistics and streamlined last-mile delivery, to boost the overall logistics efficiency of the fresh banana supply chain and optimize the quality and freshness of the bananas upon arrival. The need for precise weather forecasts in today's dynamic environment cannot be overemphasized. Hence, additional investigation is warranted to examine the influence of weather conditions on the transportation of perishable bananas and to efficiently incorporate weather forecasting into logistics planning and operations to mitigate the risks and uncertainties associated with weather-induced disruptions in the supply chain.
Fresh banana produced by government companies in West Java is a fresh banana plantation harvest located in the Parakan Village Sukabumi District. Fresh bananas were immediately sent to two distribution centers: Serpong in Tangerang City and Cibiru in Bandung Regency. As a perishable product, bananas should be treated immediately to maturation conditions, ready to ship to seven retail retailers from DC Serpong and seven retailers from DC Cibiru Bandung.
Plan an optimal transportation system for fresh banana supply chains. Transport system planning begins with the collection of customer request data for 13 periods from January 2021 to January 2022. The demand forecast used the Single Exponential Smoothing (SES) method.
The SES method, which incorporates quantitative prediction techniques utilizing historical data patterns, is characterized by its instability and reliance on time-series analysis. The exponential term in this method is obtained using a weighting factor, which is determined by the smoothing parameter from previous periods that influenced the exponential value [15]. The SES technique is a procedure that enhances prediction accuracy by calculating the average of previous values in time series data using a declining (exponential) approach. The characteristics of this method include the analysis of time-series data and its suitability for detecting horizontal patterns [16]. In addition, the method employs several parameters for historical data, with the parameter values decreasing exponentially from the most recent observations to the longest observed values. The SES approach is more suitable for anticipating random fluctuations in irregular patterns. The SES method is suitable for demand conditions because historical data trends do not have trends or lead to stationary data. Single Exponential Smoothing is appropriate for forecasting fresh banana demand using time series data because it effectively captures trends and patterns. The utilization of this forecasting technique is advantageous for perishable commodities such as fresh bananas because it places greater emphasis on the most recent demand data. This enables prompt adaptation to short-term fluctuations in demand [17], as presented in Table 1.
Prasetyo et al. [18] calculates demand forecasts, using SES with the Artificial Neural Network (ANN). The SES calculation is tested at 5 alpha values (a), namely: 0.1; 0.3; 0.5; 0.7; and 0.9. The formulations used in the SES were as follows:
$F_{t+1}=\alpha. X_t+(1-\alpha) F_{t-1}$ (1)
where:
Ft+1 = the result of demand forecast in period t+1
α= SES parameter
Xt = demand in periode ke-t
Ft-1 = the result of demand forecast in period t-1
The mean absolute percentage error (MAPE) method was used to define the deviation of the error values from five values [17, 19]. The formulation used is as follows:
MAPE $=\frac{1}{n} \sum_{t=1}^n\left|P E_t\right|$ (2)
where:
n = number of periods of times
PEt = percentage error in t period
The formulation used in the DRP [20] is as follows:
$\mathrm{NR}_{\mathrm{t}}=\left[\mathrm{GR}_{\mathrm{t}}+\mathrm{SS}_{\mathrm{t}}\right]-\left[\mathrm{SR}_{\mathrm{t}}+\mathrm{POH}_{(\mathrm{t}-1)}\right]$ (3)
where:
NRt = Net requirement t period
GRt = Gross requirement t period
SSt = Safety stock t period
SRt = Scheduled receipt t period
POH(t-1) = Production on hand t-1 period
$\mathrm{POH}_{\mathrm{t}}=\mathrm{POH}_{\mathrm{t}-1}+\mathrm{SR}_{\mathrm{t}}+\mathrm{POR}_{\text {eceipt }}-\mathrm{GR}_{\mathrm{t}}$ (4)
where:
POHt = Production on hand t period
POHt-1 = Production on hand t-1 period
SRt = Scheduled receipt t period
POReceipt = Planned order receipt
GRt = Gross requirement t period
The determination of the distance and route continues after the value and scheduling of fresh banana deliveries are known. The steps taken were finding two DC locations and 26 retail stores by creating a distance matrix using the cheapest insertion heuristic algorithm [21, 22].
Let G be a completed undirected edge-weighted graph denoted by G = (V, E), where V = {v1, ..., vn} and V = {1, ..., n}. The value cij represents the length of edge (i, j) in E. A tour refers to a cycle in G that includes all n vertices. A partial tour is a pair of parallel edges in G with a maximum of n–1 vertices. Given a partial tour T and vertex k that are not in T, the operation insert (T, k) creates a cycle by removing edge (i, j) from T and replacing it with two edges, (i, k) and (k, j). We say that k is inserted into T. The term c (T, k) denotes the increase in length caused by inserting k into T, which is calculated as c(insert(T, k)) − c(T).
The Cheapest Insertion algorithm, a heuristic method used in the traveling salesman problem, was employed to find an optimal solution. In our version of the algorithm, the initial partial tour is a 2-edge cycle with minimum cost. Alternatively, it can begin with an arbitrary vertex as the initial partial tour. Given a partial tour T and vertex k in T, the operation delete(T, k) forms a cycle by removing the two edges connected to k, denoted as (i, k) and (k, j), and replacing them with edges (i, j). We refer to this process as deleting k from T and denote the resulting subtour as deleted (T, k). Thus, deletion serves as an inverse insertion operation. The term c–(T, k) represents the reduction in length achieved by deleting k from T, which is calculated as c(T)–c(delete(T, k)).
Input
A weight graph G = (V, E)
Begin,
K, 1: arg, min $\left\{c_{i j} c_{j i}: I, j \in V, I \neq j\right\}$,
T:=(k, l, k).
While T is a partial tour
v: arg min {c (TK): k¢T}
T:=insert (T, v).
and while
end cheapest insertion
$Insertion =\mathrm{C}_{\mathrm{ik}}+\mathrm{C}_{\mathrm{ki}}-\mathrm{C}_{\mathrm{ij}}$ (5)
Cik is distance from node i to node k;
Ckj is distance from node k to node j;
Cij is distance from node i to node j.
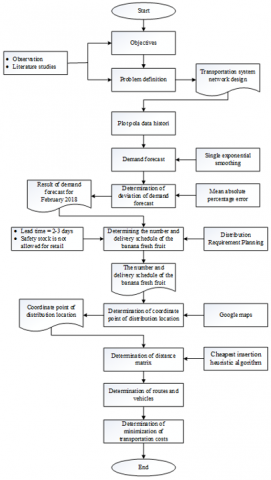
After obtaining the optimal route, the number of vehicles and optimal transportation cost were determined to achieve an optimal network design for the transportation system in the supply chain of fresh bananas. A flowchart of the methodology used in this study is shown in Figure 3.
Figure 3. Research methodology
Bananas are perishable products; therefore, they cannot be stored for extended periods. Therefore, production planning should be performed as well as possible to anticipate the decay and loss of plantations and retail stores. Fresh bananas produced by government companies in West Java include banana barangans, maskirana, and cavendishes.
The use of Single Exponential Smoothing for fresh banana demand forecasting is justified for multiple reasons, despite the availability of different forecasting methodologies.
Single Exponential Smoothing is a widely employed forecasting technique for time-series data, especially when the data exhibit a smooth or progressive trend.
The demand for fresh bananas is expected to have a smooth and stable trend over time rather than sudden fluctuations. Moreover, Single Exponential Smoothing is well suited for making predictions when there is a scarcity of past data available. When it comes to fresh bananas, which are a type of product that can easily spoil, there may be a lack of historical data due to seasonal changes, variances in agricultural practices, and market patterns. Single Exponential Smoothing is suitable for such scenarios as it assigns greater significance to current data points, enabling precise prediction even when there is a scarcity of historical data.
Moreover, Single Exponential Smoothing is a straightforward and comprehensible technique, which makes it feasible for consumers to apply and comprehend without needing much statistical expertise. This is especially advantageous for supply chain managers and stakeholders, who may lack considerable expertise in intricate forecasting methodologies but still require well-informed decisions based on demand estimates.
Furthermore, Single Exponential Smoothing offers a method to effectively account for and integrate the influence of unpredictable variations and temporary anomalies in the demand for fresh bananas. This is essential for ensuring optimal inventory levels and reducing stockouts or overstock situations. In general, choosing Single Exponential Smoothing to predict the demand for fresh bananas is appropriate because it takes into account the unique features of the data and the practical aspects of implementing and interpreting it in the supply chain context.
The data on the demand for fresh banana products from January 2021 to January 2022, presented in Table 1, are the fresh banana aggregate data of government companies in West Java.
Table 1. Demand history data for fresh banana products
|
Period |
Quantity (kg) |
|
January 2021 |
81,200 |
|
February |
82,000 |
|
March |
84,200 |
|
April |
81,750 |
|
May |
80,200 |
|
June |
82,450 |
|
July |
82,725 |
|
August |
81,764 |
|
September |
83,072 |
|
October |
81,436 |
|
November |
82,497 |
|
December |
82,764 |
|
January 2022 |
83,105 |
The calculation of the demand for fresh banana products using the Single Exponential Smoothing method was performed on request from both distribution centers. The DC Serpong is based on seven requests for the Depok area, six requests for the Tangerang region, and six requests for the Bogor region. DC Cibiru is based on seven request areas in Bandung City and Regency.
The demand forecast results for the four regions in both DCs are presented in Tables 2, 3, 4, and 5.
Table 2. Predicted results of DC Serpong demand for Depok area retail
|
Retailers |
Result of Forecast (kilograms) |
|
Pasar Induk Kramat Jati |
1,695 |
|
Carrefour Lippo Plaza Kramat Jati |
966 |
|
Pasar Agung Depok |
1,479 |
|
Hypermart Depok Town Square |
679 |
|
Carrefour Depok |
779 |
|
Hypermart Cimanggis |
559 |
|
Hypermart Plaza Pondok Gede |
559 |
Table 3. Predicted results of DC Serpong demand for Tangerang area retail
|
Retailers |
Result of Forecast (kilograms) |
|
Hypermart Cyberpark Karawaci |
1,092 |
|
Lotte Mart Meruya |
966 |
|
Lottemart Grosir Ciputat |
1,224 |
|
Pasar Serpong |
2,095 |
|
Pasar modern BSD |
1,658 |
|
Giant Pamulang |
1,250 |
Table 4. Predicted results of DC Serpong demand for Bogor area retail
|
Retailers |
Result of Forecast (Kilograms) |
|
Carrefour Lebak Bulus |
1,030 |
|
Hypermart Pejaten Village |
930 |
|
Hypermart Lippo Kemang |
1,170 |
|
Hypermart Thamrin City |
1,947 |
|
Hypermart Cinere Belleveu |
1,595 |
|
Giant Taman Yasmin, Bogor |
1,166 |
Table 5. Predicted results of DC Cibiru demand for city and regency Bandung area retail
|
Retailers |
Result of Forecast (Kilograms) |
|
Borma Setiabudhi |
262 |
|
Yomart Sariwangi |
262 |
|
Borma Cijerah |
175 |
|
Borma Dago |
262 |
|
Yomart Ciumbeleyit |
262 |
|
Yogya Junction 8 |
262 |
|
Yogya Sukajadi |
262 |
As previously mentioned, a fresh banana is a product that requires special handling because of its perishable nature, kamba, which is easily damaged. The lead time between the planned order and release and the planned order receipt should not be more than two days in each month. The maximum lead time of fresh bananas should not surpass two days owing to various significant factors. Bananas are extremely perishable fruits that are prone to rapid deterioration. If they are not promptly handled and transported, they are susceptible to overripening, softening, and acquiring mold. This can lead to a decline in product quality and potentially present health hazards to customers if ingested [23].
Furthermore, it is imperative to keep the lead time for fresh bananas as low as possible to safeguard their nutritional integrity. Bananas are a rich source of vital nutrients, including potassium, vitamin C, and dietary fiber. Over time, the degradation of these nutrients can adversely affect the overall quality and health of the fruit [24].
Moreover, a brief lead time guarantees that consumers can save bananas at their peak freshness, flavor, and texture. By reducing the duration of the transportation process from origin to consumer, the probability of delivering high-quality products to clients is significantly enhanced.
Ultimately, it is crucial to maintain a lead time of no more than two days for fresh bananas to preserve their quality, nutritional value, and meet the expectations of consumers.
The total scheduling of the distribution based on planning was set to 10 times each month, that is, at 2, 5, 7, 9, 12, 14, 16, 19, 21, and 23. 8,280 kg or 82,800 kg per month shipped to 26 retail stores.
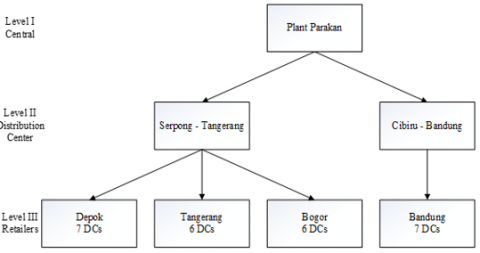
The amount to be prepared by DC Cibiru every time the delivery is as much as 1,746 kg or 1,746 kg each month, which must be sent to seven retail stores. The DRP comprises the following three levels. The first level is the center and parakan garden located in the Sukabumi District. The second level is the distribution center located in Serpong Kota Tangerang and Cibiru Regency Bandung. The third level is the location of the 22nd retail store. Figure 4 shows the DRP hierarchy.
Figure 4. DRP hierarchy
The data for the distance matrix are presented in Table 6. Nineteen retailers set their coordinates using Google Maps.
Tables 6-9 present the results of determining the matrix distance for 26 retailer locations in Serpong and seven retailers in Cibiru Bandung.
The following is an example of the calculation of optimal routes using the cheapest insertion heuristic algorithm method for the TSP with five repetitive iterations for Depok retailers from DC Tangerang.
Insertion = (33,3 + 6,3) - 39 = 0,60
Table 6. Data of distance from google maps
|
Retailers |
Coordinates |
|
Pasar modern BSD |
-6.304807, 106.684585 |
|
Pasar Serpong |
-6.321106, 106.664013 |
|
Carrefour Lebak Bulus |
-6.289384, 106.776430 |
|
Hypermart Pejaten Village |
-6.280486, 106.829258 |
|
Hypermart Lippo Kemang |
-6.260980, 106.812883 |
|
Pasar induk kramat jati |
-6.295318, 106.868751 |
|
Carrefour Lippo Plaza Kramat Jati |
-6.270670, 106.868914 |
|
Lotte Mart Meruya |
-6.193744, 106.734067 |
|
Hypermart Thamrin City |
-6.194758, 106.817469 |
|
Hypermart Cyberpark Karawaci |
-6.221582, 106.619063 |
|
Lottemart Grosir Ciputat |
-6.300864, 106.758875 |
|
Giant Pamulang |
-6.342721, 106.725155 |
|
Pasar Agung Depok |
-6.393185, 106.845036 |
|
Hypermart Cinere Belleveu |
-6.317104, 106.781959 |
|
Hypermart Depok Town Square |
-6.372430, 106.831979 |
|
Carrefour Depok |
-6.392225, 106.823146 |
|
Hypermart Cimanggis |
-6.357566, 106.860389 |
|
Hypermart Plaza Pondok Gede |
-6.283195, 106.911313 |
|
Giant Taman Yasmin, Bogor |
-6.558189, 106.771513 |
Table 7. Arc addition of subtour to 1
|
The Arc will be Replaced |
The Arc to be Added |
The Extra Distance |
|
(0,7) |
(0,1) - (1,7) |
0.60 |
|
(0,7) |
(0,2) - (2,7) |
4.00 |
|
(0,7) |
(0,3) - (3,7) |
28.70 |
|
(0,7) |
(0,4) - (4,7) |
20.00 |
|
(0,7) |
(0,5) - (5,7) |
27.30 |
|
(0,7) |
(0,6) - (6,7) |
14.60 |
|
(7,0) |
(7,1) - (1,0) |
0.60 |
|
(7,0) |
(7,2) - (2,0) |
4.00 |
|
(7,0) |
(7,3) - (3,0) |
28.70 |
|
(7,0) |
(7,4) - (4,0) |
20.00 |
|
(7,0) |
(7,5) - (5,0) |
27.30 |
|
(7,0) |
(7,6) - (6,0) |
14.60 |
Arc (0,7) is replaced with Arc (0,1) and Arc (1,7) or Arc (7,0) is replaced with Arc (7,1) and Arc (1,0). If there are two routes with the same total distance, one can be chosen. For example, if the first possibility is chosen, the new subtour becomes (0,1) → (1,7) → (7,0).
Steps 1-3 continue until the fifth iteration or the optimal condition is reached. And obtained the optimal route based on the method of Cheapest Insertion Heuristics Algorithm Method for TSP is (0,3) - (3,5) - (5,4) - (4,6) - (6-2) - (2,1) - (1.7) - (7,0) or DC Serpong - The great market Depok - Carrefour Depok - Hypermart Depok Town Square - Hypermart Cimangis - Carrefour Lippo Plaza Kramat Jati - Pasar Induk Kramat Jati - Hypermart Plaza Pondok Gede - DC Serpong travel 124 km.
The route from DC Serpong to the six Tangerang retailers is (0.11)-(11,10)-(10,12)-(12,9) - (9-8) - (8-13) - (13,0) or DC Serpong-Hypermart Cyberpark Karawaci-Lottemart Meruya-Lottemart Wholesale Ciputat-Market Serpong-Modern Market BSD-Giant Pamulang at 96.5 a distance.
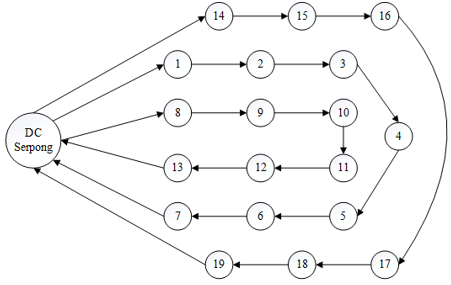
The route from DC Serpong to the six Bogor retailers is (0.17)-(17,16)-(16,15)-(15,18)-(18,14)-(14,19)-(19,0), or DC Serpong-Hypermart Thamrin City-Hypermart Lippo Kemang Village-Hypermart Pejaten Village-Carrefour Lebak Bulus-Giant Taman Yasmin-DC Serpong with mileage 148 km.
Figure 5. DC Serpong transportation route
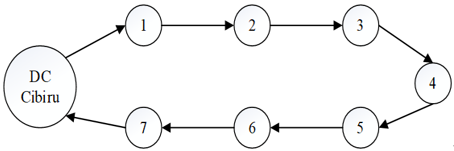
Figure 5 describes the route from DC Cibiru to the seven Bandung retailers as (0.3)-(3,9)-(9,2)-(2,1)-(1,8)-(8,5)-(5,7))-(7.0).
Figure 6. DC Cibiru transportation route
Figure 6 describes the alternative route from DC Cibiru-Borma Setiabudhi-Yomart Sariwangi-Borma Cijerah-Borma Dago-Yomart Ciumbulenyit-Yogya Junction-Yogya Sukajadi-DC Cibiru at 53.3 a distance.
The distribution of DC Serpong and Cibiru using seven vehicles and the type and capacity of the vehicles are presented in Table 8.
Table 8. Type and vehicle distribution capacity
|
Type |
Capacity (box) |
Total (unit) |
|
DC: Serpong |
|
|
|
Dyna Rino long box |
160 |
3 |
|
L300 Mitsubishi box |
110 |
2 |
|
Grand Max |
50 |
1 |
|
DC: Cibiru |
|
|
|
Dyna Rino long box |
160 |
1 |
The capacity of each box was 11 kg. Each vehicle was assumed to carry three types of fresh bananas simultaneously.
Consumption requires that the Dyna Rino long box is every 1 liter diesel travel distance of 11 km. The consumption requirements of the L300 Mitsubishi box are every 1 liter of diesel, covering a distance of 10 km. Grand Max car consumption requires every 1 liter diesel fuel to travel a distance of 13 km.
The transportation cost calculations for DC Serpong are presented in Table 9. The cost of diesel is Rp.5.150 / L, and the premium cost is Rp.6.450/ liter (bphmigas, 2017). These transportation costs do not consider the cost of vehicle depreciation, toll fees, retribution fees, cost of feeding the driver and kenek, or cost of driver and crew fees.
In Table 9, it appears that Scenario I has a low transportation cost of Rp.359,966 per day or Rp.3,599,660 per month.
Table 9. DC Serpong transportation cost
|
Retailers |
Demand |
Vehicles (unit) |
Cost |
||
|
160 |
110 |
50 |
|||
|
Scenario I |
|||||
|
Depok |
2,280 |
1 |
|
1 |
119,578 |
|
Tangerang |
2,805 |
1 |
1 |
|
94,877 |
|
Bogor |
2,685 |
1 |
1 |
|
145,511 |
|
TOTAL |
|
|
|
|
359,966 |
|
Scenario II |
|||||
|
Depok |
2,280 |
1 |
1 |
|
121,915 |
|
Tangerang |
2,805 |
1 |
1 |
|
94,877 |
|
Bogor |
2,685 |
1 |
1 |
|
145,511 |
|
TOTAL |
|
|
|
|
362,303 |
|
Scenario III |
|||||
|
Depok |
2,280 |
1 |
|
1 |
181,101 |
|
Tangerang |
2,805 |
1 |
|
2 |
140,937 |
|
Bogor |
2,685 |
1 |
|
2 |
216,152 |
|
TOTAL |
|
|
|
|
538,190 |
Transportation fee for DC Cibiru using only one vehicle. A DynaRino long box was used as the vehicle. Capacity to transport 160 boxes, equivalent to 1,760 kg. Capable of transporting requests from DC Cibiru at 1,746 kg per day, the transportation cost is Rp.49,908 per day or Rp.490,908 per month.
Supply chain efficiency, costs, and spoilage rates depend on the forecasted demand and distribution strategy. Accurate demand forecasting may optimize inventory levels and ensure that the proper quantity of products is available at the right time, thus improving supply chain efficiency. Stockouts and backorders may decrease, thus enhancing consumer happiness and loyalty.
However, inadequate demand forecasting can cause overstocking or understocking, which reduces supply chain efficiency. Overstocking increases carrying costs, storage space, and product spoilage, whereas understocking can cause lost sales, rush orders, and higher transportation expenses to hasten delivery.
Distribution planning, which determines how products are delivered to clients, also affects supply chains. Distribution planning can lower transportation costs, shorten lead times, and increase supply chain reliability. Poor distribution design can increase lead times, transportation costs, and spoiling risk owing to longer transit periods.
Demand forecasting and distribution planning can reduce product spoiling and expiration before sale. This can considerably reduce spoilage and waste costs, and improve supply chain efficiency and profitability.
Forecasted demand and distribution plans significantly affect supply chain efficiency, costs, and spoilage rates. Businesses may optimize their supply chains, decrease expenses, and reduce product spoilage by investing in precise forecasting and effective distribution techniques, thereby increasing their bottom-line and market position.
The expected demand for DC Serpong based on SES is 82,800 kg, and that for DC Cibiru is 17,460 kg per month. SES results were obtained based on the smallest MAPE values.
The SES results were derived from the analysis using the least MAPE values. This methodology enables a more precise depiction of the data by reducing the disparity between the projected and real values. To optimize the forecasting approach for the most dependable and precise forecasts, the SES model with minimum MAPE values should be chosen. Rigorous evaluation of SES data improves the accuracy and trustworthiness of forecasting outputs, offering vital insights for informed decision making.
The total number of fresh bananas that must be provided for DC Serpong to meet the demand of the 19 retail stores based on the DRP is 7,770 per day. For DC Cibiru, fulfilling the demands of the seven retailers is 1,720 per day.
The cost of transportation to be spent each month for DC Serpong was Rp.3,599,660, whereas for DC, Cibiru was Rp. 490,908. The cost incurred was based on the use of seven vehicles: six in DC Serpong and one in DC Cibiru.
After careful consideration, it is crucial to recognize the limitations of this study. The forecasting model is based on specific assumptions regarding future market trends and consumer behavior, the accuracy of which may vary. Furthermore, the analysis relied on data that were specific to the local environment and may not accurately reflect broader geographic or demographic characteristics. Moreover, the calculations of transportation costs were predicated on particular variables and may not encompass all conceivable elements that could impact swings in costs. It is important to consider these constraints while analyzing the results of this investigation.
To implement our suggested technique using alternative time series data, we have a few suggestions. The forecasting accuracy is heavily reliant on the quantity of the dataset, as the input data are derived from past years' data. Utilizing a tiny dataset to determine the input data may result in diminished forecasting accuracy. Second, it is necessary to ascertain the input that yields superior performance. This discrepancy arises owing to the distinct properties exhibited by each dataset.
[1] Statistik Pertanian 2016. Pusat Data dan Sistem Informasi Pertanian. https://repository.pertanian.go.id/items/40370269-223a-47bb-87e3-48cb5b2540f2
[2] Meidute-Kavaliauskiene, I., Yıldırım, F., Ghorbani, S., Činčikaitė, R. (2022). The design of a multi-period and multi-echelon perishable goods supply network under uncertainty. Sustainability, 14(4): 2472. https://doi.org/10.3390/su14042472
[3] Statistik, B.P. (2020). Statistik Indonesia 2020. Jakarta: Badan Pusat Statistik. https://www.bps.go.id/publication/2022/02/25/0a2afea4fab72a5d052cb315/statistik-indonesia-2022.html.
[4] Arampantzi, C., Minis, I. (2017). A new model for designing sustainable supply chain networks and its application to a global manufacturer. Journal of Cleaner Production, 156: 276-292. https://doi.org/10.1016/j.jclepro.2017.03.164
[5] Jayarathna, C.P., Agdas, D., Dawes, L., Yigitcanlar, T. (2021). Multi-objective optimization for sustainable supply chain and logistics: A review. Sustainability, 13(24): 13617. https://doi.org/10.3390/su132413617
[6] Abbaspour, S., Aghsami, A., Jolai, F., Yazdani, M. (2022). An integrated queueing-inventory-routing problem in a green dual-channel supply chain considering pricing and delivery period: A case study of construction material supplier. Journal of Computational Design and Engineering, 9(5): 1917-1951. https://doi.org/10.1093/jcde/qwac089
[7] Fargiana, F., Respitawulan, R., Fajar, Y., Suhaedi, D., Harahap, E. (2022). Implementation of cheapest insertion heuristic algorithm in determining shortest delivery route. International Journal of Global Operations and Strategic Sourcing, 3(2): 37-45. https://doi.org/10.47194/ijgor.v3i2.137
[8] Nusantara, T.B.N.K., Farikha, N.A.N., Gilang, K. (2023). Determining newspaper distribution routes using cheapest insertion heuristic algorithm with sweep clustering: A case study. In Proceedings of the International Conference on Industrial Engineering and Operations Management, Istanbul, Turkey, pp. 2918-2929). https://doi.org/10.46254/AN12.20220533
[9] Zhalechian, M., Tavakkoli-Moghaddam, R., Zahiri, B., & Mohammadi, M. (2016). Sustainable design of a closed-loop location-routing-inventory supply chain network under mixed uncertainty. Transportation Research Part E: Logistics and Transportation Review, 89: 182-214. https://doi.org/10.1016/j.tre.2016.02.011
[10] Almouhanna, A., Quintero-Araujo, C.L., Panadero, J., Juan, A.A., Khosravi, B., Ouelhadj, D. (2020). The location routing problem using electric vehicles with constrained distance. Computers & Operations Research, 115: 104864. https://doi.org/10.1016/j.cor.2019.104864
[11] Verma, S., Pant, M., Snasel, V. (2021). A comprehensive review on NSGA-II for multi-objective combinatorial optimization problems. IEEE Access, 9: 57757-57791. https://doi.org/10.1109/ACCESS.2021.3070634
[12] Yadegari, E., Alem-Tabriz, A., Zandieh, M. (2019). A memetic algorithm with a novel neighborhood search and modified solution representation for closed-loop supply chain network design. Computers & Industrial Engineering, 128: 418-436. https://doi.org/10.1016/j.cie.2018.12.054
[13] Asrol, M., Syahruddin. (2022). Supply chain performance measurement and improvement for forging industry. International Journal of Industrial Engineering Production Research, 33(3): 8-21. https://doi.org/10.22068/ijiepr.33.3.14
[14] Panudju, A.T., Marimin, Rahardja, S., Nurilmala, M. (2023). Conceptual model to manage supply chain performance (Case Study: Pangasius Sp. Agroindustry in Indonesia). Journal of Optimization in Industrial Engineering, 16(1): 197-210. https://doi.org/10.22094/JOIE.2023.1981521.2047
[15] Gustriansyah, R., Suhandi, N., Antony, F., Sanmorino, A. (2019). Single exponential smoothing method to predict sales multiple products. In Journal of Physics: Conference Series, 1175(1): 012036. https://doi.org/10.1088/1742-6596/1175/1/012036
[16] Swari, M.H.P., Handika, I.P.S., Satwika, I.K.S., Wahani, H.E. (2022). Optimization of single exponential smoothing using particle swarm optimization and modified particle swarm optimization in sales forecast. In IEEE 8th Information Technology International Seminar (ITIS 2022), Surabaya, Indonesia, pp. 292-296. https://doi.org/10.1109/ITIS57155.2022.10010034
[17] Haviluddin, H., Alfred, R. (2023). Multi-step CNN forecasting for COVID-19 multivariate time-series. International Journal of Advances in Intelligent Informatics, 9(2): 176-186. https://doi.org/10.26555/ijain.v9i2.1080
[18] Prasetyo, T.A., Sianipar, E.R., Naomi, P.L., Hutabarat, E.S., Chandra, R., Siagian, W.M., Panjaitan, G.H.A. (2023). Sales forecasting of marketing using adaptive response rate single exponential smoothing algorithm. Indonesian Journal of Electrical Engineering and Computer Science, 31(1): 423-432. https://doi.org/10.11591/ijeecs.v31.i1.pp423-432
[19] Vieira, A., Sousa, I., Dória-Nóbrega, S. (2023). Forecasting daily admissions to an emergency department considering single and multiple seasonal patterns. Healthcare Analytics, 3: 100146. https://doi.org/10.1016/j.health.2023.100146
[20] Işık, E.E., Yildiz, S.T. (2023). Optimizing the COVID-19 cold chain vaccine distribution network with medical waste management: A robust optimization approach. Expert Systems with Applications, 229: 120510. https://doi.org/10.1016/j.eswa.2023.120510
[21] Fasihi, M., Tavakkoli-Moghaddam, R., Najafi, S.E., Hajiaghaei, M. (2021). Optimizing a bi-objective multi-period fish closed-loop supply chain network design by three multi-objective meta-heuristic algorithms. Scientia Iranica. https://doi.org/10.24200/sci.2021.57930.5477
[22] Hiassat, A., Diabat, A., Rahwan, I. (2017). A genetic algorithm approach for location-inventory-routing problem with perishable products. Journal of Manufacturing Systems, 42: 93-103. https://doi.org/10.1016/j.jmsy.2016.10.004
[23] Valérie Passo Tsamo, C., Andre, C.M., Ritter, C., Tomekpe, K., Ngoh Newilah, G., Rogez, H., Larondelle, Y. (2014). Characterization of Musa sp. fruits and plantain banana ripening stages according to their physicochemical attributes. Journal of Agricultural and Food Chemistry, 62(34): 8705-8715. https://doi.org/10.1021/jf5021939
[24] Das, A., Dhua, R.S. (2021). Development of fresh and minimally processed banana inflorescence. Plant Archives, 21(1): 1561-1566. https://doi.org/10.51470/plantarchives.2021.v21.no1.213