Fouzi Ghoumah![]() | Ayşe Tansu
| Ayşe Tansu![]() | Rusul Saad Hadi
| Rusul Saad Hadi![]() | Monaem Elmnifi
| Monaem Elmnifi![]() | Mustafa Abdul Salam Mustafa
| Mustafa Abdul Salam Mustafa![]() | Hasan Shakir Majdi
| Hasan Shakir Majdi![]() | Hazim Moria | Laith Jaafer Habeeb*
| Hazim Moria | Laith Jaafer Habeeb*![]()
© 2024 The authors. This article is published by IIETA and is licensed under the CC BY 4.0 license (http://creativecommons.org/licenses/by/4.0/).
OPEN ACCESS
The development of wind turbine technology has been studied globally and has shown that energy production from wind has become one of the most balanced, advanced, and promising ways for the future and falls within clean energy generation technologies. Wind energy development has shown many positive impacts on the environment and the economy in many countries. Wind turbine manufacturers have developed modern, powerful turbines that work well in weak wind conditions. These conditions make it necessary to increase the capacity of manufacturing companies to manufacture wind turbines in all the processes and procedures involved in them. This study focuses on providing manufacturing companies with the latest developments and most efficient manufacturing processes to improve wind turbine outcomes. It also explains how certain activities and procedures in manufacturing practices can affect the overall performance of a turbine. Through the analysis, we have observed that manufacturers have responded to the demand for models with cutting speeds of 2.1 m/s to 4 m/s by preparing more models in this range for future production. Models with very high cutting speeds have also been compensated for by preparing more ranges with ultra-fast cutting speeds for future production. Analysis of the turning diameter showed that sufficient response was not achieved, as insufficient attention was paid to the diameter range of 50-100 meters. The manufacturers' response indicates that the bulk of future production will be within the power ranges between 2001 and 6000 kW.
wind energy, manufacturing, capacity, management, strategy, efficiency
Oil and nuclear energy prices have been receiving increasing attention in recent years due to their scarcity and the negative environmental impact they cause, such as greenhouse gas emissions that lead to global warming and ozone osmosis. The daily increase in demand for electrical power generation has prompted civilized societies to search for new energy sources to generate energy efficiently and in a sustainable manner without destroying our environment. This sustainable renewable energy can provide the required energy consumption, without dumping hazardous materials into the environment, and does not involve depletion of the energy source [1, 2]. One of those renewable energy sources is wind energy.
Wind energy production is considered the most beneficial and environmentally friendly energy source due to its sustainability and the fact that it does not produce any hazardous waste during operation, such as carbon dioxide emissions [3]. The overall goal of companies is to survive for a long time and be able to achieve desirable and meaningful results. By achieving such goals, customers will be satisfied and loyal to the company. Manufacturers will be available to customers at any time to provide reliable customer service, resulting in increased customers and growth in profits. One concern relates to how manufacturers use limited resources to transform inputs into useful outputs in terms of cost efficiency. This provides a structured strategy for making better decisions in order to improve economic performance. Manufacturing strategies have recently been expanded to include service activities and are usually referred to as business strategies.
Process management is defined as the planning, scheduling, and control of processes that transform inputs into final products and services [4]. This study examines the importance of renewable energy, specifically wind energy, as a sustainable alternative to oil and nuclear energy. The study aims to focus on improving wind turbine manufacturing and operations management processes with the aim of achieving economic and environmental efficiency. The study presents the general background of process management and its importance in manufacturing companies. The study also reviews previous research in the field of manufacturing strategies and their impact on competitive performance. The study stresses the need to understand the relationship between production capabilities and commercial success and searches for the factors influencing achieving competitive advantage in the wind turbine industry.
1.1 Background
The area of production strategy has had a definite status as a specific field of study and knowledge since Skinner's first publication on product strategy in 1969. Both academic and manufacturing management practices have drawn significant attention to the manufacturing process. Identifying the drivers of high performance and competitive sustainability has been one of the main goals of strategic production research in recent times [4]. In the bulk of research on manufacturing approaches, the dependent variable is on a specific type of competitive performance, whether the relationship between practice and performance (actions and results) is focused on financial aspects, such as return on investment or market share, or operational aspects (quality, livability, etc.) in relation to competition. The activities studied range from practical, hands-on approaches to more applied activities (e.g., flexible production) to more conceptual approaches (e.g., reducing setup time). It has been suggested that clusters of practices be used to understand the nature of larger, multidimensional concepts in manufacturing, such as lean production [5]. The approach planning process includes defining the goal and path and developing the means (resources and capabilities) to achieve the specified goals and their means [6]. Production strategy refers to the selection of the most necessary production capabilities for a particular business unit and the investment necessary to build those capabilities. In practical terms, managers must understand both business and production objectives and recognize how to build and develop production capacity to support these objectives [7].
Many ideas have been introduced and supported over the years as an alternative to developing critical production capabilities to achieve increased performance and a lasting competitive advantage. In addition, companies are not a homogeneous group that responds equally to specific actions, such as individual characteristics.
The area of production strategy has had a definite status as a specific field of study and knowledge since Skinner's first publication on product strategy in 1969. Both academic and manufacturing management practices have drawn significant attention to the manufacturing process. Strategic research in the field of production in general aims to identify the factors influencing the achievement of high performance and competitive sustainability, and this is what the current study focuses on [4]. In most research dealing with the manufacturing approach, the focus is on the relationship between practices and performance, whether the performance is related to financial aspects such as return on investment and market share or operational aspects such as quality and vitality, in the context of competition. The activities taught in this field vary between applied practical activities and conceptual activities, such as flexible production and reducing processing time, for example. It has been suggested that a range of practices can be used to understand the nature of broader, multi-dimensional concepts in manufacturing, such as lean production [5]. The approach-planning process includes defining goals and paths and developing the resources and capabilities necessary to achieve these goals [6]. Production strategy means choosing the production capabilities most necessary for the business unit and the investment necessary to build those capabilities. Managers must understand both business and production objectives and how to build and develop production capacity to support these objectives [7]. Many ideas and supports have been offered over the years as alternatives for developing critical production capabilities to achieve increased performance and a lasting competitive advantage. Moreover, firms are not a homogeneous group that responds equally to specific actions, such as individual characteristics. Consequently, there are no general business plans, improvement programs, or generalizable ideas in manufacturing [8-10].
1.2 Wind power
Wind power production is a renewable energy power generation technology with one of the most balanced, favorable development conditions and a bright future. However, it is unreliable, volatile, and random, primarily influenced by seasons and climates. The independent wind turbine system is not enough for constant, stable, and significant fluctuations in power output, which affect the safety of the integrated wind turbine operation [11, 12]. The following three techniques are used to manage wind turbine power: first, controlling the stable fixed-pitch, which indicates the connection of the blades to the hub and that the wind angle of the blades is fixed; and second, controlling the stable means controlling the innate blade stall features. Once wind speed exceeds the rated value, the attachment angle of the airflow increases until it reaches the standstill condition when a plume is generated on the surface of the blades to lower wind turbine capture efficiency and limit the wind turbine power value. Second, variable pitch control indicates that the wind turbine’s capacity is restricted by altering the angle of the blades installed in the center. When the generator's output power is below the rated power, the pitch angle at zero degrees is constant. When the generator's output power reaches or surpasses the valued power, the pitch angle needs to be increased based on the power change to ensure that the output power is rated [13]. The level wind turbine in the megawatt unit currently usually takes variable-pitch control. Third, with active stall control, small wind speed changes may cause large wind power fluctuations, and wind power absorption is commensurate with the wind speed cube. The variable wind turbine leads to frequent pitch adjustment mechanisms when the wind speed frequently changes at large amplitudes.
However, the wind rate change is frequently reacted to by the timing adjustment system at large amplitudes, resulting in the frequent action of the timing system. A device intended to maximize the timing of certain actions or adjustments connected to the pitch control of wind turbine blades is referred to as a "timing adjustment system" in the context of wind power. In order to maximize energy capture and guarantee the turbine runs well, the pitch control system in wind turbines is essential for adjusting the rotor blades' angle to the wind. The wind speed adjustment system's response is low, leading to a delayed pitch change in the rake case, leading to instant wind turbine overload. It combines fixed-pitch stand control with variable-point control to address the previously mentioned drawbacks and absorb reactive standstill and variable pitch benefits. such as, before the standing point, it must take variable-pitch control, namely when the power is lower than the rated power. When the output rate is above the rated rate, the stop effect of the blades can avoid instant turbine overload [14]. For a transmission system with mild wind power penetration, the variations should be reduced, or else this could lead to significant differences in the grid frequency, a voltage blinking on a grid bus, damage to equipment, or the collapse of the system at large. Therefore, the pumped storage plant can play a major role in stabilizing the differences in grid frequency and voltage fluctuation caused by the fluctuation of wind energy. The pumped storage plant has the potential to significantly reduce grid frequency and voltage fluctuations caused by wind energy fluctuations.
Accordingly, the most effective deployment has been wind power in the last twenty years, with a worldwide aggregate capacity of 370 GW by the end of 2014. The largest number of installations in Asia with 142 GW is 38% of global capacity (GP), followed by Europe with 134 GW and 36% of GP, and North America with 78 GW and 21% of GP. The contribution of developing economies has grown in recent years, from 5.5 GW in 2010, or 2.8% of global cumulative capacity, to 15.5 GW by the end of 2014. The pattern is projected to continue in the years to come. He claimed that wind power technology developed into machines with longer blades and higher rates while increasing capacity [15]. However, innovative measures were not just aimed at standardizing wind turbines because new market prospects emerge as the technology evolves. The most recent developments in blades, coverings, or thermal systems alone allow wind power in cold weather or at higher altitudes to grow lucratively in locations with low wind resources. Wind power is a plentiful resource and one primary type of clean energy for renewable energy [16]. One effective way of adapting the energy structure and mitigating the power crisis is to make reasonable and effective use of wind energy. The wind energy resources can be exploited and are rich in China, so the wind power industry could have a strong market. Wind generation has numerous benefits: it is environmentally friendly, durable, spatially effective, has incredible domestic potential, has low operating costs, reinvigorates rural economies, etc. Moreover, its intermittency and probabilistic behavior over time are the main disadvantages of wind power. Significant fluctuations in wind power can therefore be observed.
The latest trends in wind power technology are focused primarily on blade and turbine design. The wind power business has made notable progress in recent times, mostly due to the pursuit of enhanced efficiency, heightened dependability, and decreased expenses. The latest innovations in blade design include extended blade length, sophisticated materials, optimized form, and intelligent blades. Turbine design trends include higher hub heights, direct drive systems, variable-speed turbines, grid-friendly turbines, machine learning and control systems, and floating offshore wind turbines.
The wind power industry has been rapidly developing during the last ten years. In 2016, China's abandoned wind power reached up to 50 billion kWh. The aggregate wind power mounted increased from 6.1GW in 1996 to 282,6 GW by 2012 exponentially [17]. It was projected that the aggregate wind power by 2020 would reach 760 GW following the current trend. Around 45 GW of new wind energy, representing investments worth approximately EUR 56 billion, was added in 2012. The wind power sector is also a significant driver of economic growth with many direct or indirect job opportunities. The author cited that the sector has shown an excellent growth rate of over 19% and accounts for 1.9% of global net electricity generation. Eighty-three countries currently make commercial use of wind energy to produce electricity. Around 24 countries have a cumulative wind power capacity of over 1 GW, including 16 in Europe, three in North America (Canada, Mexico, USA), and one in the Asia Pacific (China, India, Japan, Australia). Some of the leading causes behind this strong growth rate are cost reduction, government financial incentives, and technological development.
I suggest looking through the most recent reports and databases from reputable sources like the Danish Energy Agency (Energistyrelsen), International Energy Agency (IEA), Ministry of New and Renewable Energy (MNRE), Central Electricity Authority (CEA), and Global Wind Energy Council in order to obtain the most recent statistics (for instance) for Denmark and India's wind power capacity beyond 2015. (GWEC).
Wind power is among the most advanced technologies for development and commercial development in the field of renewable power [18]. Wind power development is extremely important for adapting energy structures, reducing environmental pollution, etc. China pays greater attention to wind energy development in the 21st century. The National Renewable Energy Legislation was promulgated and implemented to speed up the development rate of wind power infrastructure and the development of large-scale wind turbines. Wind technology has progressed into more giant machines (longer blades, higher towers, and stronger generators). The expansion of wind turbines is a challenge requiring innovative solutions and new designs. The rotor diameter of 30 m, a hub height of 30 m, and a power rating of 300 kW used in the late 80 s increased extraordinarily to a rotor diameter of 92.7 m, a height of 87.7 m, and an average height of 2.1 MW by the close of 2014.
Manufacturing strategy from several points of view can be studied. The ideas discussed in this research are based primarily on the literature on manufacturing approaches and business management, including the company's resource-based vision. The theoretical foundation sets the limit for the investigation. The research focuses on the developments and operational efficiency of manufacturing companies in wind turbines and how certain activities and bundles of practices affect operational efficiency, on the one hand, and different dimensions of operational performance, on the other. This research evaluates wind technology developments from a production point of view, identifying trends in the most relevant technology indicators while highlighting the key aspects that differentiate between manufacturers. Choosing and analyzing trends in indicators such as rated power, rotor diameter, hub height, specific power, wind class, train setup, and electricity monitoring systems shows an in-depth look into the evolution of wind power technology. The study aims to provide a deep analysis of the relationship between the wind turbine industry's design, development, and operation.
It comprises an evaluation that offers developments and logistical designs for the manufacturing of wind turbines. The research also examines how wind turbine manufacturers use various manufacturing practices or bundles of production practices to develop specific skill sets to ultimately aid market needs. In this research, the present state of wind turbine manufacturers, rotor speed (cut-off and cut-in), blade diameter, area covered, and power rating are discussed, while collective knowledge is improved by developing theoretical designs. In the research strategy for wind turbines, the research objective covers several fields of importance. Following the general study objective, developments are presented and analyzed: rated power, rotor diameter, hub height, rated power, speed cutting, and control systems, showing intensive and rapid scientific progress.
1.2.1 Basic principles of wind turbines
The wind power principle is almost identical to the work it does. The whole fan rotates if a certain wind speed is swept through three horizontally arranged propeller blades. The whole fan rotation is mainly driven by a certain wind speed being swept through three horizontally organized propeller blades. The ventilator's speed is usually slower, so the gearbox outputs faster. So, it transforms mechanical energy into electricity via the generator. The power output alternates with a low-voltage current. A corrector and an inverter must still be used to access the electricity grid. There is always an evolving direction and speed of the wind. The wind vane can gauge the wind direction and the controller's responses to turn the head to the wind. The ultrasonic sensor can gauge the speed and then regulate it to ascertain if the fan speed should be limited or if the fan should start. The blade for the wind turbine is by far an essential part. All wind turbines now use curved blades in wind farms. The serrated blades are very similar to the long, curved surface-to-top aerial wings. The top flow is faster than on the flat side of the blade, lowering the maximum pressure. The outcome is a small, high pressure, and the creation of a blade motion is known as the lift force [19]. The blade remains resistant, and it is known as a drag force, essentially the tension between the air and the blade's surface. The increase in lifting power increases the airspeed, but the drag force increases at the same time. So, the wind turbine can deliver maximum efficiency when the elevation-to-drag ratio is high. The farther it is from the center, the greater the line speed, if the angular velocity is the same. The various forces are analyzed at the various places on the blade. This reduces the airspeed around where the air moves comparatively little by little closer to the root to a quicker motion. The latest rotor blades twist from root to end at 10 to 20 degrees along their length. This blade turn optimizes the lift and rotation of the attack through the length. Wind farms are usually situated in a harsh satellite environment and 50 to 80 m above sea level. These circumstances increase maintenance difficulties and costs. Operating and maintenance costs account for 10-15% of wind farm revenues for workplaces with a working life of 20 years; wind turbines operate on offshore wind farms and hold up to 20-25% of wind farm revenues; increased costs for wind farm operating and servicing; and the economic effects of wind energy are reduced [20].
1.2.2 Wind turbine
Denmark is currently among the first wind energy countries to develop technology. The statistics showed that the wind industry generated 42% of electricity consumption in 2015. Denmark again had the highest rate of wind power in the world, after 39 percent in 2014. Simultaneously, the wind power industry is now a core industry for exports to Denmark [21, 22]. India is the second-most crucial wind market in Asia and offers plenty of potential for global and local competitors [23]. India is now one of the world's top five wind power countries. In India, the total electricity-based renewable energy system reached almost 33,792 MW. At the start of 2015, the total installed capacity of wind power at approximately 11% was 260.8 GW, while renewable energy was around 66.5%. He argued that the need to ensure that wind penetration has no negative impact on the security, power reliability, cohesion, and security of each wind power system network under all conditions also increases with the increase in wind power penetration. When put in small places, the impact of wind power generators on power stability is insignificant. However, the increase in the degree of penetration can impact the dynamic efficiency of the power system. Due to low investment, high capacity for energy transfer, and adaptable control in power systems, variable-speed WTs using DFIG are becoming increasingly important in several wind-generation technologies.
1.2.3 Wind turbine components
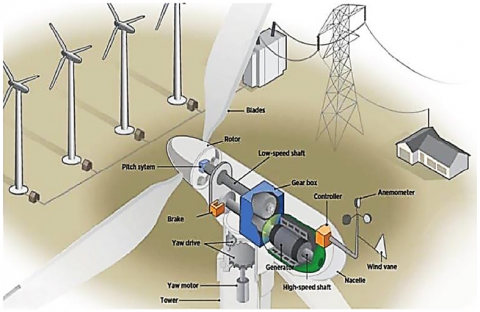
Figure 1 demonstrated the major parts of the wind turbine, which consists of:
• Blades: when wind blooms over, they lift and rotate and cause the rotor to rotate. Either two or three blades are used in most turbines.
• The rotor carries the blade and sends the rotational energy from the blade into the system.
• Pitch: turns blades out of the wind to control the rotor speed and keep the rotor from turning in winds too high or too low to generate power.
• Brake: if the wind hits the cut-off speed, either mechanically, electrically, or hydraulically, brakes are introduced to stop the wind turbine. The wind turbines also have an advanced braking system.
• Low-speed shaft: the rotor is connected directly to the gearbox by a low-speed shaft. If rotor blades start rotating, the low-speed shaft first rotates, which leads to electric power generation from the high-speed waft.
• Gearbox: the gearbox is a center that links the shaft with the high-speed shaft. These speed up the process of rotation to some level required for electric power generation by the generator. The heavy mechanical section of the wind turbine is the most expensive.
• Generator: The generator uses rotational energy from the shafts to generate electricity.
• Controller: start with wind speeds of approximately 8 to 16 km/h (mph) and shut off the machine at approximately 55mph. Turbines do not function over 55 mph at wind speeds because high winds can damage them.
• Anemometer: gauge the speed of the wind and forward data to the controller at the wind speed.
• Wind vane: nearly all contemporary wind turbines are fitted with anemometers and wind turbines that assess wind speed and direction. The wind turbine harmonizes with the wind direction instantly with an anemometer and wind turbine input.
• Nacelle: Nacelle offers housing that encompasses and defends all other components, such as the generator, gearbox, speed shafts, lava mechanism, and braking system, in wind turbines, primarily mechanical and electrical. It is located at the top of a tower. Contemporary wind turbine nacelles for instant maintenance and ease of maintenance are produced with helicopter landing support.
• High-speed shaft: this part drives the generator during the process.
• Yaw drive fine-tunes upwind turbines so that when the direction changes, they face the wind. Downwind turbines do not require a lagoon drive, as the wind blows away from the rotor manually.
• Yaw monitor: wind turbine rotors are oriented in the wind direction by the Yaw mechanical. Applying the wind direction to the wind as a directional position controls the alignment of the turbine. Electrical engines activate the laying-out system of an upwind turbine.
• Tower: made of stainless steel, concrete, or steel grille, supporting the turbine structure. As wind speed increases with height, larger towers allow turbines to generate more power.
Figure 1. Grid-connected wind turbine [24]
The research aims to provide an in-depth analysis of the manufacturing design, trends, and operation within the wind turbine industry. The methodology section can be organized into the following subsections for clarity: research approach, research design, analysis procedure, and data collection method. The research approach employed in this study is quantitative in nature. It involves the collection and analysis of numerical data related to various parameters of wind turbine models. Finding trends, patterns, and connections between these variables is the goal in order to learn more about wind turbine performance and manufacturing processes. The study plan calls for gathering and examining secondary data from 1634 wind turbine models. Globally, there are more than 120 distinct wind turbine manufacturers. The following parameters are examined: swept area, number of manufacturers, model number, rated power, number of blades, onshore/offshore classification, cut-off and cut-in speeds, and rotor diameter. These standards were selected because much study has been done on their relationship to the efficiency and output of wind turbines. We observed patterns and trends in the wind turbine models' rated power, swept area, swept diameter, number of blades, cut-off and cut-in speeds, and power density. The data covers the years 1989-2018 and includes wind turbine capacity and operating years [25, 26]. The categorization shows the current state of the wind turbine models: Under Development denotes models that are planned for the future, Available denotes models that are now in production, and Not Available denotes models that are either out-of-production or thought to be outmoded. There should be more discussion and explanation of how this categorization affected the study and findings.
3.1 General
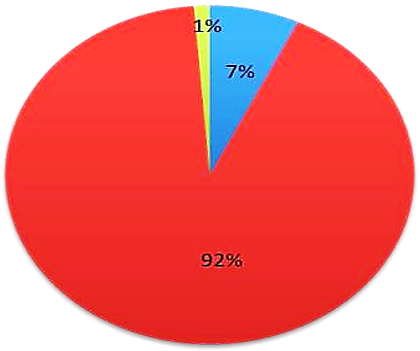
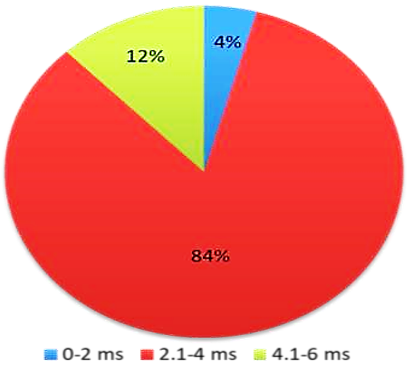
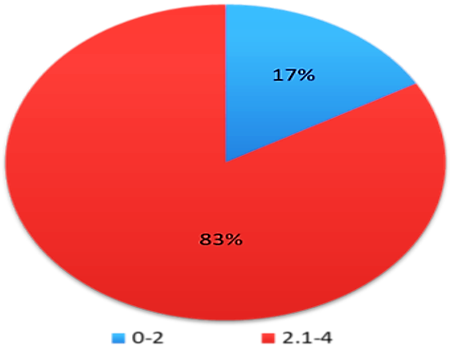
The possibility of cut-in speed is one of the most critical aspects of wind turbines, and it has an impact on wind turbine model availability. Figure 2 presents the cut-in speeds in three categories: available, not available, and underdevelopment. The cut-in speed has 564 models when it is considered in the Available category. The available cut-in speed is the highest speed at which the turbine can generate power, with 92% of the turbines producing power between 2.1 and 4 m/s, with the majority of turbines being in this category. WT classified 7% of these turbines as being in this group, and they began producing power at speeds ranging from 0 to 2 m/s. As few as 1% of these turbines will begin producing power at speeds ranging from 4.1 to 6 m/s. The cut-in speed has 727 models when it is considered in the not-available category. It was noted that 84% of the wind turbines supply power within 2.1 m/s to 4 m/s, which is 6% less than the available category. However, unlike the available category, 12% of the turbines start power production within the speed range of 4.1-6 m/s, with the least recorded cut-in speed range shown as 4%. When considered in the under-development category with 24 models, it can be seen that the range of 2.1 m/s to 4 m/s covers a more extensive range of proportion. Although there are possibilities for development plans, the wind turbines' common speed range seems to fall within the larger region at 83%. It is followed by the 0-2 m/s speed range, which stands at 17%. It can be noticed that no wind turbine within the cut-in speed range of 4.1-6 m/s is under development. This is because the medium-range cut-in speed WT models have been made available, responding to their demand in the market. Therefore, manufacturers may need to consider producing new models in the medium-speed range to satisfy market demand in the future. Also, the small speed range has little demand. However, low quantities can be produced in the near future to create alternatives for buyers and customers.
(a)
(b)
(c)
Figure 2. Cut-in speed (a) available; (b) not available; (c) under development
3.2 Cut-off speed
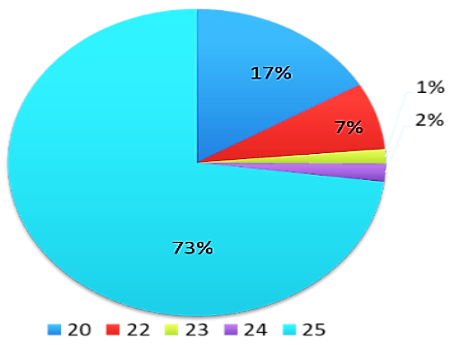
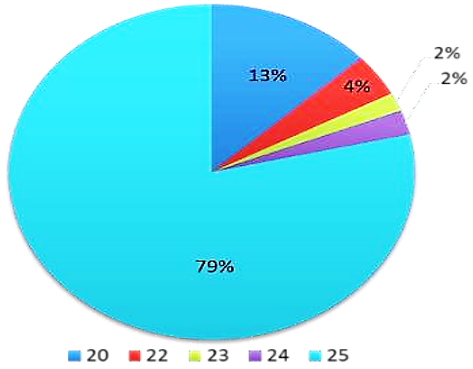
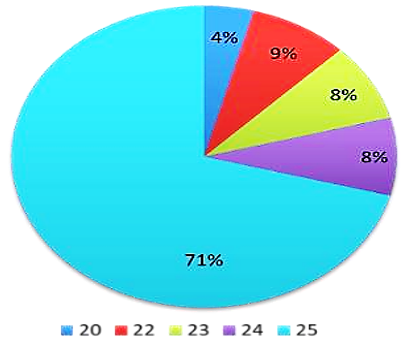
Figure 3 illustrates the distribution of cut-off speeds among wind turbine models, categorized as available, not available, and under development. Out of the 526 analyzed models, 384 are designed with the highest cut-off speed and are in high demand. However, it is important to note that the claim stating the majority of buyers prefer high cut-off speeds requires supporting evidence such as market surveys or trend analyses. The analysis reveals the following results: Among the analyzed wind turbine models, 87 turbines have a cut-off speed of 20 m/s, followed by 37, 8, and 10 turbines with cut-off speeds of 22, 23, and 24 m/s, respectively. The most significant concentration of wind turbines, totaling 533 models, is found in the 25 m/s cut-off speed category. This observation supports the claim that the market tends to favor wind turbines with higher cut-off speeds. On the other hand, the categories with cut-off speeds of 20, 22, 23, and 24 m/s have lower concentrations of 89, 28, 12, and 16 turbines, respectively. The number of wind turbines in these categories is relatively low compared to the previous two categories. It should be noted that 24 wind turbines were considered in the under-development category, indicating ongoing interest in cut-off speed development. Additionally, an average of 74.3% of the analyzed models across all three categories have a cut-off speed of 25 m/s, indicating a significant market demand for high cut-off speeds. However, it is important to emphasize that the claim about buyer preferences for high cut-off speeds requires additional evidence beyond the analysis of wind turbine models. Market surveys or trend analyses would provide more substantial support for this assertion. The analysis also shows how the "under-development" category might change the future of the market since the available (AV) graph shows that the 4% share of 20 m/s models might not be a good fit for market demand. The demand for 20 m/s models appears to be higher compared to the 22, 23, and 24 m/s cut-off speed models.
(a)
(b)
(c)
Figure 3. Cut-off speed (a) available; (b) not available; (c) under development
3.3 Rotor diameter
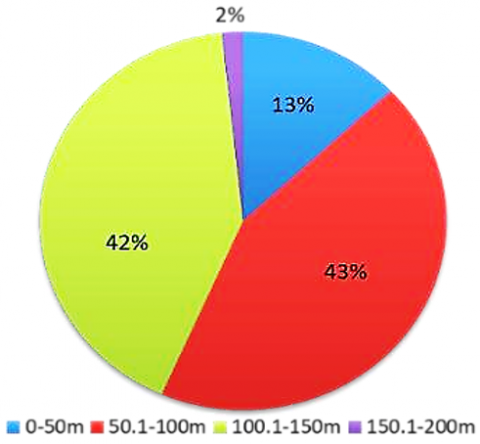
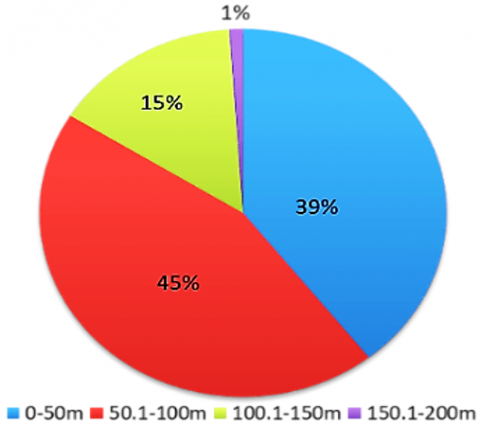
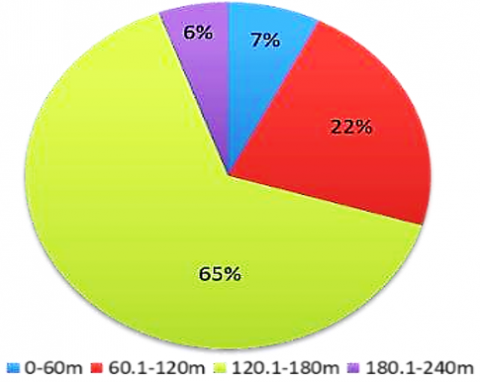
Six hundred fifty-six turbines were used and tested against the available, not available, and under development. It is important to note that a range of diameters from 0 to 200 m is categorized into four classes according to the range 0 to 50 m, 50.1 to 150 m, 100.1 to 150 m, and 150.1 to 200 m for critical analysis of the demand on each diameter range.
Categorization is carried out in this way to have a better understanding of the results. As mentioned earlier, rotor diameters ranging from 50.1 to 100 m are more in demand. As shown in Figure 4(a), 286 wind turbines out of the 656 analyzed are available or in market demand. Wind turbines with rotor diameters followed this result closely between 100.1 and 150 meters. Thus, 274 wind turbines were found in this region. It means that the market seems to favor moderate sizes for the rotor. It also implies that only 13% of the small ranges are in use, and almost none of the extremely large ranges are in use. In this category, 924 wind turbines are compared to models that have been out of production. The results of this analysis are shown in Figure 4(b). Figure 4(c) shows the turbines under development at ranging from 0 to 60 m .A high number of the same range as in the AV category seem to be out of production. The pie chart shows that 411 wind turbines are considered in this category out of the 924 wind turbines. However, the large range of 100.1-150 m appears to be more in demand because much less of the model is available, as the graph records 15% of the turbines considered in this category. More of the small rotor range (0-50m) is largely out of production, as the graph records 39% of the wind turbines analyzed. A total of 54 turbines are being developed primarily for the future, and evaluations of the diameter have been undertaken to better understand the rotor diameter range being developed. The results showed that the count of wind turbines under consideration reveals an all-time low number of underdeveloped turbines. This is beneficial for the model because it implies that a greater number of these ranges are active or likely to be available. However, about 65% of the large range between 100.1 and 150 m seems underdeveloped. Therefore, the manufacturers may need to focus more on the 50.1-100 m/s models of WT in the near future.
(a)
(b)
(c)
Figure 4. Rotor diameter (a) available; (b) not available; (c) under development
3.4 Rated power and swept area
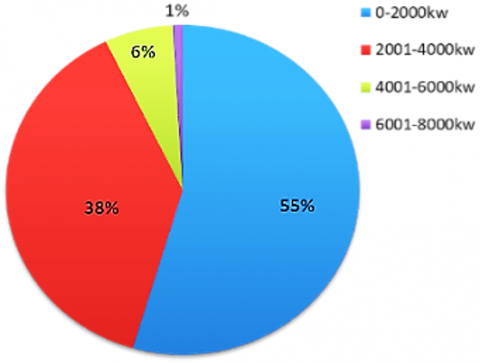
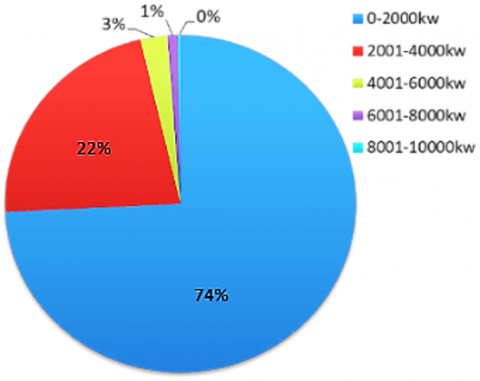
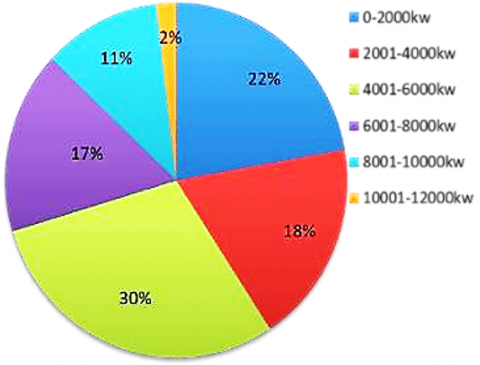
The swept area of the rotor and the rated power of 1634 wind turbines were investigated. First, rated power was considered under three classes: available, not available, and under-development. In comparison to the other models, around 656 WT models ranging from 0 to 2000 kW have been mass-produced by manufacturers. It can be seen that 55% of the models used in this study fall within this range. Apart from those ranging from 0 to 2000 kW, the most popular models range from 2001 kW to 4000 kW, showing the consumer preference for models within these two ranges. The ranges above 4000kW are not popular among consumers. Figure 5 shows that a greater portion of the models unavailable are within the same range as those on-demand, with a total of 656 WT models shown in Figure 5. Past models were definitely in the same range as the present models. It may imply that demand will likely remain concentrated in the 0-2000 kW power range for an extended period. Additionally, manufacturers may need to consider the population of users who may demand models ranging from 2001 to 4000 kW. This section studied 54 models and found an even distribution throughout all six-power categories, except for the 10001-12000 kW category, which included only one model. It means that models slated for development in the near future will have a nearly equal distribution across all five power categories, from 0 to 10000 kW.
(a)
(b)
(c)
Figure 5. Rated Power (a) available; (b) not available; (c) under development
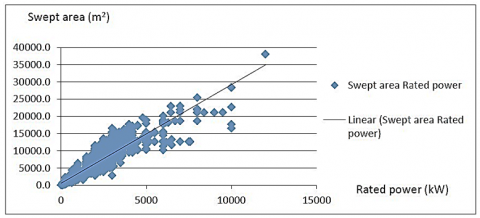
When evaluating the link between the swept area and rated power, Figure 6 produced a variety of results. The graph demonstrated a direct variation between both coefficients in this graph, which can derive a linear connection. It also demonstrated that increasing the rotor's surface area enhances the power output. After roughly 6500 kW, though, the line appears to spiral downward. When the swept areas exceed 6500 kW, a breaking point was reached, indicating a decrease in power output.
Figure 6. Swept area vs. rated power
The linear regression between rated power and each swept area is presented in Table 1. The obtained results show that R squared was found to be 0.838. Thus, it shows that there is a positive relationship between rated power and the swept area. Also, the regression coefficient shows that the relationship is positive and significant. Thus, the utilization of regression analysis can identify the strength of the effect of the swept area on the rated power. The regression analysis is also a way that can be used to determine how the value of the swept area explains a variation in the output power. The coefficient table shows which variables included in the model contributed to the prediction of the dependent variable. The beta value that has the largest coefficient is 0.915. Thus, the table explained variables of a statistically significant unique contribution to the model, looking at the sig column in the Table 2.
Table 1. R squared value for the regression analysis
|
Model |
R |
R Square |
Adjusted R Square |
Std. Error of the Estimate |
|
1 |
0.915a |
0.838 |
0.838 |
621.48349 |
Table 2. Coefficient value for the regression analysis
|
Model |
Unstandardized Coefficients |
Standardized Coefficients |
t |
|
|
(Constant) Swept |
B |
Std. Error |
Beta |
5.965 91.80 4 |
|
145.874 0.293 |
24.447 0.003 |
0.915 |
||
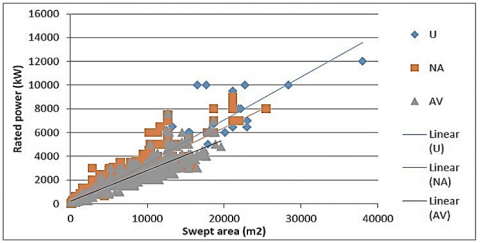
The swept area (NA) of 924 wind turbines was evaluated, 658 swept areas were available (AV), and 54 wind turbine swept areas are under development (UD). Figures 7 and 8 illustrate a relationship between the rated power and swept area. As indicated in the graph, the larger the swept area of the motor, the more power it produces. The figure also showed that the wind turbine models AV and NA have a consistent linear rise in their power, ranging from zero to trending upward. However, underdeveloped models appear to have greater power and cover more area.
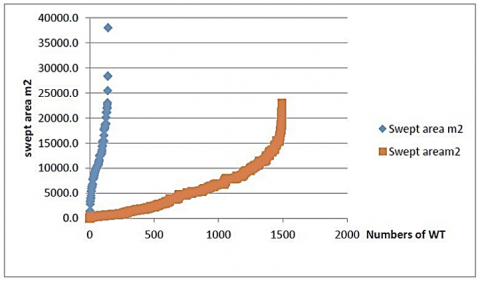
One hundred forty-four onshore wind turbines were examined, whereas 1490 offshore wind turbines were examined. It can be visualized the basic facts that may help comprehend market distribution and demand because there is no direct relation between the two model classifications. The findings showed a low swept area for offshore wind turbines with high power production, while onshore models show low power production but a very high swept area. However, the case is not with the offshore models, which have a very low swept area and extremely high power. Therefore, it can be concluded that wind turbines will function optimally offshore rather than onshore. Therefore, manufacturers may need to have different rotor blades for different locations, either offshore or onshore, because the demands for both circumstances share no similarity.
Figure 7. Swept area vs. rated power (UD, AV, NA)
Figure 8. Swept area (onshore and offshore)
3.5 Number of models vs. manufacturers
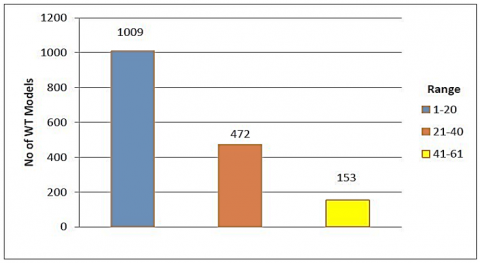
All models have been considered in this category. The number of models has been categorized into three ranges for proper analysis. The number of models ranges from 120, 21-40, and 41-61. In Figure 9, the range 1-20 with fewer wind turbine models per manufacturer has been recorded to have the highest number of WT models, while the other ranges 21-40 and 41-61 possess a small number of WT models.
Figure 9. Number of wind turbine models
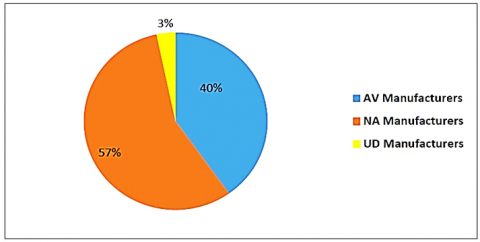
219 manufacturers were analyzed in these three sections. They include the available, not available, and underdeveloped. The analysis in Figure 10 showed that only 40% of the data collected is available, while 57% of the manufacturers do not have available models. The analysis seemed to show that more manufacturers have left production, and a small fraction of manufacturers are getting ready for production. This trend may not be a good one for the future production of wind turbines.
Figure 10. Manufacturers AV, NA, and UD
3.6 Number of wind turbine models AV, NA, and UD
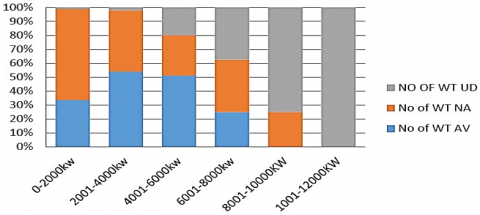
1634 wind turbine models were evaluated and categorized into six power ranges: 0-2000 kW, 2001-4000 kW, 4001-6000 kW, 6001-8000 kW, 8001-10000 kW, and 10001-12000 kW. These power ranges were further divided into three categories: available (AV), not available (NA), and underdeveloped (UD). The analysis shows that, on average, a higher percentage of wind turbine models in the 2001-4000 kW and 400-1600 kW power range are available compared to the other power ranges. Figure 11 displays the results. Unfortunately, only about 40% of the models that can produce power between 0 and 2000 kW are currently on the market. This data reveals that wind turbines with a power range of 2001-6000 kW are more popular among consumers. Additionally, a large portion of the models in the 0-2000 kW power range are inaccessible, and about 40% of the models in the 2001-4000 kW power range are no longer available, according to the data. In addition, we only have 400-1600 kW versions available, which is less than 30% of the total. There may be greater development and availability in the 0-2000 kW power range compared to the other levels. The research concludes that types of wind turbines ranging in power from 2001 to 6000 kW are more popular, suggesting that this is the power range that buyers want. However, further research is needed to establish a direct relationship between availability and consumer preference. The higher availability of models in the 0-2000 kW power range and their significant development may indicate market potential and ongoing efforts in that range [27].
Figure 11. Number of wind turbines (AV, NA, and UD)
3.7 Rotor diameter and blade number
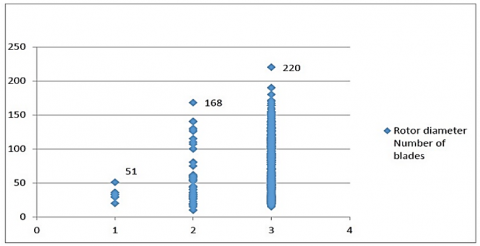
In this section, 1636 turbines were analyzed and categorized according to the number of blades. The result is shown in Figure 12. The three-blade region has a higher number of clusters, as shown in the graph above. It just goes to illustrate how much the three-blade rotor is preferred. There were more wind turbines with three blades for all rotor sizes, whereas wind turbines with one blade scored with rotor diameters of less than 51m, WT with two blades recoded with highs of 168 m, and WT with three blades scored with rotor diameters of more than 200m. The following equations relate the wind speed, air density, rotor power, and the radius of the rotor:
$P_T=1 / 2 \rho \mathrm{AV}^3 \mathrm{Cp}$ (1)
$A=\pi R^2$ (2)
R=D/2, r is the air density, v is the wind speed, Cp is the rotor power coefficient, and R is the rotor radius. According to study [28], manufacturers can only control properties such as the rotor diameter and the rotor power coefficient. Due to properties such as the air density and the wind speed, they are uncontrollable. The continuous development of this technology has tilted demand towards producing turbines with larger rotors and is expected to remain so in the near future.
Figure 12. Rotor diameter vs. blades number
(a)
(b)
(c)
Figure 13. Blade (a) available; (b) not available; (c) under development
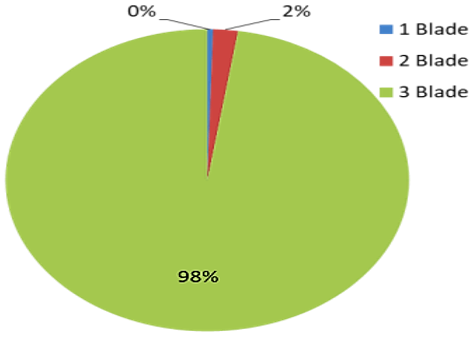
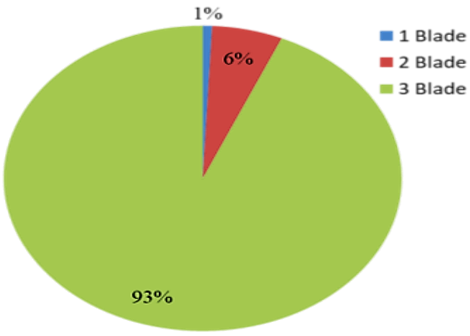
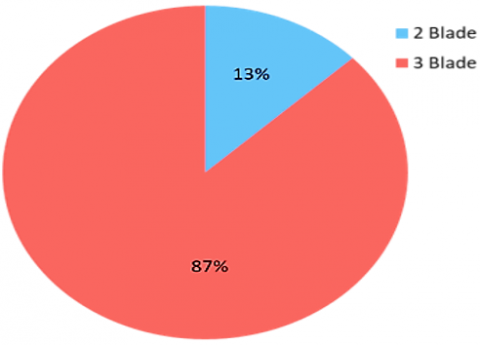
The blades analyzed in this section include the number of blades per wind turbine. In addition, it is categorized as available, not available, and underdeveloped. Figure 13 shows that more models with three blades have been mostly manufactured with two blades lagging behind them. It also showed the consumer preference for wind turbines with three blades. The blades that are not available, as shown above, indicate the same results as those available. Thus, there seems to be a clear preference for models with three blades. The manufacturers may need to produce more models with three blades in the future. As shown, the manufacturers seem to have responded positively to consumer preferences by preparing 87% of the models with three blades for production in the future. However, it is also noticed that 13% of the future models will have two blades, while models with one blade have no provision for the future.
This research has focused on the development trends of wind turbines globally, analyzing characteristics such as rated power, rotor diameter, cut-in speed, and cut-off speed in the available (AV), not available (NA), and underdevelopment (UD) categories. The analysis has revealed several key findings:
1) Market Preference: The analysis indicates a market preference for wind turbines with medium cut-in speeds. Additionally, there is a high demand for turbines with high cut-off speeds. Manufacturers may need to design specific rotors for offshore and onshore applications, as they require different power ratings to optimize resource utilization. Onshore turbines have the potential to produce more power with less swept area.
2) Cut-in and Cut-off Speeds: Manufacturers have responded to the demand for wind turbine models with cut-in speeds ranging from 2.1 m/s to 4 m/s by preparing more models within this range for future production. Similarly, they have compensated for the demand for high-cut-off-speed models by preparing more models with very high cut-off speeds. However, there is a need for manufacturers to pay more attention to the very low cut-off speed ranges, as there seems to be a demand for these models.
3) Rotor Diameter: The analysis highlights that less attention has been given to the rotor diameter range of 50-100m. Given that this range makes up the largest percentage of models in the category under analysis, manufacturers should prioritize this range more in their future plans.
4) Supply and Demand: In order to meet customer needs and make up for any gaps in the required rotor diameter and speed ranges, manufacturers must develop additional models. The analysis of available (AV), not available (NA), and underdevelopment (UD) categories also shows that a significant percentage of manufacturers have npt available models, emphasizing the need for increased production in the future.
5) Difficulties and Research: Although wind energy is a somewhat well-established method, it still has to be developed further and actively researched in order to become more competitive. There are difficulties because of the quasi-exponential rise in mass and weight with growth, especially in parts like towers and blades. In order to scale up wind turbines in the industry, these issues must be resolved by continuing research and developing new technologies.
Finally, this report offers a summary of the status of wind power technology as of right now. To do a thorough study on a worldwide scale that takes into consideration the particular demands and fundamental needs of customers, particularly private owners, further research is required. Addressing the supply-demand balance and overcoming challenges related to component size and weight will contribute to the continued growth and competitiveness of wind energy.
[1] IRENA. Trends in Renewable Energy. International Renewable Energy Agency. https://www.irena.org/Statistics/View-Data-by-Topic/Capacity-and-Generation/Statistics-Time-Series, accessed on 09/26, 2021.
[2] IRENA, Renewable capacity statistics 2019. International Renewable Energy Agency (IRENA), Abu Dhabi, 2019. https://www.irena.org/publications/2019/Ma r/Renewable-Capacity-Statistics-2019, accessed on 10 May, 2020.
[3] Cox, J., Blackstone, J. (2002). APICS dictionary (10th ed.). Alexandria, VA: Apics.
[4] Ketokivi, M., Schroeder, R. (2004). Manufacturing practices, strategic fit and performance: A routine‐based view. International Journal of Operations & Production Management, 24(2): 171-191. https://doi.org/10.1108/01443570410514876
[5] Shah, R., Ward, P.T. (2003). Lean manufacturing: Context, practice bundles, and performance. Journal of Operations Management, 21(2): 129-149. https://doi.org/10.1016/S0272-6963(02)00108-0
[6] Hayes, A., Kucera, M., Kallel, N., Sbaffi, L., Rohling, E.J. (2005). Glacial Mediterranean sea surface temperatures based on planktonic foraminiferal assemblages. Quaternary Science Reviews, 24(7-9): 999-1016. https://doi.org/10.1016/j.quascirev.2004.02.018
[7] Ward, P.T., Duray, R. (2000). Manufacturing strategy in context: Environment, competitive strategy and manufacturing strategy. Journal of Operations Management, 18(2): 123-138. https://doi.org/10.1016/S0272-6963(99)00021-2
[8] Swink, M., Way, M.H. (1995). Manufacturing strategy: Propositions, current research, reneweddirections. International Journal of Operations & Production Management, 15(7): 4-26. https://doi.org/10.1108/01443579510090381
[9] Corbett, L.M., Claridge, G.S. (2002). Key manufacturing capability elements and business performance. International Journal of Production Research, 40(1): 109-131. https://doi.org/10.1080/00207540110073091
[10] Safizadeh, M.H., Ritzman, L.P., Mallick, D. (2000). Revisiting alternative theoretical paradigms in manufacturing strategy. Production and Operations Management, 9(2): 111-126. https://doi.org/10.1111/j.1937-5956.2000.tb00328.x
[11] Bolinger, M., Wiser, R. (2012). Understanding wind turbine price trends in the US over the past decade. Energy Policy, 42: 628-641. https://doi.org/10.1016/j.enpol.2011.12.036
[12] Brown, C., Foley, B. (2015). Achieving a cost-competitive offshore wind power industry: What is the most effective policy framework?. Oxford Institute for Energy Studies.
[13] Jenkins, P., Elmnifi, M., Younis, A., Emhamed, A. (2019). Hybrid power generation by using solar and wind energy: Case study. World Journal of Mechanics, 9(04): 81-93.
[14] Wang, A., Gang, H., Qiu, P., Luo, X., Pang, X., Zhang, C. (2018). Self-Starting analysis of new energy system with wind power and energy storage. In 2018 37th Chinese Control Conference (CCC), Wuhan, China, pp. 7422-7427. https://doi.org/10.23919/ChiCC.2018.8483400
[15] Serrano‐González, J., Lacal‐Arántegui, R. (2016). Technological evolution of onshore wind turbines-a market‐based analysis. Wind Energy, 19(12): 2171-2187. https://doi.org/10.1002/we.1974
[16] Shujun, M., You, Z., Ye, Y., Ding, Z., Jin, L., Kai, S. (2017). A curtailed wind power accommodation strategy based on wind-hydrogen-heat-storage integrated energy network. In 2017 Chinese Automation Congress (CAC), IEEE, pp. 6146-6150. https://doi.org/10.1109/CAC.2017.8243884
[17] Stavrakakis, G. (2012). Electrical parts of wind turbines. Comprehensive renewable energy (Vol. 2). Elsevier Ltd strategy and manufacturing strategy. Journal of Operations Management, 18(2): 123-138.
[18] Fadhil, N.A., Elmnifi, M., Abdulrazig, O.D., Habeeb, L.J. (2022). Design and modeling of hybrid photovoltaic micro-hydro power for al-bakur road lighting: A case study. Materials Today: Proceedings, 49: 2851-2857. https://doi.org/10.1016/j.matpr.2021.10.072
[19] Alternative energy. (2017). https://www.iea.org/renewables2017/, accessed on Jun. 25, 2019.
[20] Moria, H., Younis, A., Elmnifi, M., Rasani, M.R. (2020). Investigation effects of different wind turbine designs on air flow and generated power. Asian Journal of Applied Sciences, 8(3).
[21] Wang, J., Zong, Y., You, S., Træholt, C. (2017). A review of Danish integrated multi-energy system flexibility options for high wind power penetration. Clean Energy, 1(1): 23-35. https://doi.org/10.1093/ce/zkx002
[22] IEA Wind TCP. IEA Wind 2015 Annual report. August 2016. https://www.ieawind.org/annual_reports_PDF/2015/2015%20IEA%20Wind%20AR_ small. Pdf, accessed on July 14, 2017.
[23] Sharma, H., Kaur, G. (2016). Optimization and simulation of smart grid distributed generation: A case study of university campus. In 2016 IEEE Smart Energy Grid Engineering (SEGE), pp. 153-157. https://doi.org/10.1109/SEGE.2016.7589517
[24] Chidambaram, P.K., Thamilarasan, K., Kumar, J.B., Mary, L.A. (2021). WITHDRAWN: A review on turbines in power production using wind and hydro energy. Materials Today: Proceedings. https://doi.org/10.1016/j.matpr.2020.12.1242
[25] Wind energy market intelligence. (2018). https://www.thewindpower.net/manufacturer
[26] Tekbiyik-Ersoy, N., Tansu, A. (2018). Wind turbine manufacturing trends in China. In 2018 7th International Conference on Industrial Technology and Management (ICITM), IEEE, pp. 93-98. https://doi.org/10.1109/ICITM.2018.8333926
[27] Jary, A.M., Elmnifi, M., Said, Z., Habeeb, L.J., Moria, H. (2021). Potential wind energy in the cities of the Libyan coast, a feasibility study. Journal of Mechanical Engineering Research and Developments, 44(7): 236-252.
[28] Ayed, S.K., Elmnifi, M., Moria, H., Habeeb, L.J. (2022). Economic and technical feasibility analysis of hybrid renewable energy (PV/Wind) grid-connected in libya for different locations. International Journal of Mechanical Engineering, 7(1).