Valeria Selicati* | Nicola Cardinale
© 2022 IIETA. This article is published by IIETA and is licensed under the CC BY 4.0 license (http://creativecommons.org/licenses/by/4.0/).
OPEN ACCESS
The journey to sustainability is becoming increasingly crucial in manufacturing, particularly in resource and energy intensive industries. In recent years, the matter of sustainability in industrial contexts has become an important point on the legislative agendas of many governments as well as in public opinion, with the latter becoming increasingly sensitive to enterprises' dedication to this problem. As a result, companies have started to implement sustainable approaches into their manufacturing processes and increased the amount of information about these practices to customers and stakeholders.
The purpose of this work is to evaluate manufacturing sustainability using coupled exergetic and life cycle performance indicators, which are used to comprehend the outcomes of the studies as well as to qualitatively and quantitatively evaluate the models developed. The purpose of this study is to first present an overview of the metrics associated with the integrated or combined implementation of Exergetic Analysis and Life Cycle Assessment, their significance, and their application in specific use scenarios. Some illustrative indicators are then compared in an actual industrial case study, and the outcomes are discussed. Among the highlights, it is not yet able to determine a metric that measures the degree of manufacturing sustainability individually and thoroughly owing to the multifaceted character of the manufacturing processes. The overall conclusion is that combining Exergy with Life Cycle Thinking is indeed a beneficial solution for enhancing industrial processes, although the accuracy in measuring environmental, but primarily social and economic, concerns is not obvious. he assessment's interpretation is typically troublesome due to a lack of full and up-to-date data and confidence analysis, as well as a lack of scientific coherence.
analysis interpretation, exergy, life cycle assessment, manufacturing sustainability, performance metrics, reversibility
Starting from the work carried out and published in the proceedings of the 6th AIGE/IIETA International Conference and 15th AIGE Conference on TI-IJES [1], the following paper is an extension and completion of the considerations and the analysis implemented in the paper.
Sustainability is concerned with meeting present demands without affecting future generations' capacity to meet their own. It entails actions to safeguard our shared environment in viable methods that are beneficial to the ecosystem in the medium and long run [2], also in economic and social standings.
Sustainable design in manufacturing is the practice of continuously improving environmental, social, and economic (cost-benefit) effectiveness through time.
The greatest challenge in adopting a sustainable strategy derives from the difficulty of accurately assessing and evaluating economic, environmental, and social effect. Measuring, monitoring, evaluating, and communicating sustainability is an important step in policymaking governance.
The first stage for a practitioner is to map all parts of the system that should be investigated that are related to sustainability. The enhancement objectives must be established after all basic framework have been found. These goals entail limiting the amount of resources consumed and, as a result, maximizing value through decreasing energy consumption, optimizing the plant, lowering CO2 emissions, and so on.
The five variables to be reviewed in the manufacturing industry are environmental conservation, job prosperity, societal health, technical innovation, and process improvement. Technology advancement accounts for firms' propensity to foster technological improvement via Research and innovation commitment, investment, and high-tech items. Performance management is concerned with the execution of sustainability initiatives and policies, as well as regulatory compliance.
Evaluating complex dynamic systems entails the implementation of both traditional and advanced assessment methodologies, and according, Exergetic Analysis (EA) combined with a Life Cycle Assessment (LCA) yields a solid implementation proposal.
Among the modeling and sustainability analysis approaches available in the state of art, The systematic integration of thermodynamic laws, and hence EA, and the Life Cycle of the production, operation, service/activity, is the core of this paper. EA and LCA have been blended in a variety of frameworks and on a number of scales, making it difficult to instantly analyze the data and develop the appropriate judgement call approaches for the situation under consideration [3].
The further goal involves offering a comprehensive examination of all indicators linked to coupled or integrated usage of EA and LCA, the significance, and the application within specific case studies. The most characteristic metrics are then calculated for an actual case study in manufacturing field, and the outcomes are discussed. It is important to note that the purpose of this study is not to delve conceptually into the core principles of EA, LCA, or integrated methodologies by already taking basic theoretical knowledge for granted.
The following is how the article is structured: the next paragraph discusses on the best techniques to assessing sustainability in manufacturing field. The fourth paragraph discusses how to report the findings and hence their meaning, and it is accompanied by a short overview of the most commonly used metrics. The subsequent paragraph is pertinent to the case analysis, and it finishes with a summary of the results. Lastly, the last section brings the work to a conclusion.
2.1 Manufacturing sustainability
Striving towards sustainable production is crucial for manufacturing businesses. Manufacturing systems produce material wealth for humans, but they consume a lot of resources and waste.
A clear understanding of sustainable manufacturing is required to describe the indicators in terms of their significance and importance to sustainable production. There is no single universal concept of sustainable manufacturing, but the US Department of Commerce summarizes it as follows: “The creation of manufactured products that use processes that minimize negative environmental impacts, conserve energy and natural resources, are safe for employees, communities, and consumers and are economically sound” [4].
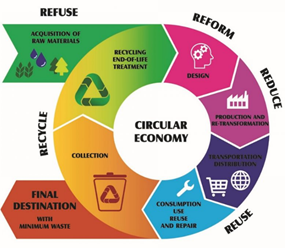
Figure 1. 6R in circular economy
Sustainable management is defined as a system that combines product and process design issues with production, planning, and control issues in order to identify, quantify, evaluate, and manage the flow of environmental waste, with the ultimate goal of reducing the effect on the environment of the Earth's self-recovery potential while also attempting to oversee it. This change towards new linear thinking can be reached with the 6R methodology (see Figure 1): Reduce, Reuse, Recycle, Redesign (or Rethinking), Recover, Remanufacture. Reduce specifically refers to the production phase, where the amount of energy, material, and waste should be minimized. This is connected with the reuse of components after their first life cycle, in order to reduce the consumption of raw incomes. Recycling waste materials is another technique to reduce the consumption of raw materials. Recover is a way to extend the life cycle of a product, which could be extended to remanufacturing, to process the product to restore the original state. All this can be achieved only by redesigning the product and the life cycle with a vision aimed at sustainability.
2.2 Assessment approaches for manufacturing sustainability
Life Cycle Assessment (LCA) is a technique for assessing the potential environmental aspects and potential aspects associated with a product (or service) through a systematic set of procedures for compiling and examining the inputs and outputs of materials and energy, as well as the associated environmental impacts directly attributable to the operation of a product or service system over its life cycle. LCA can be used for any operation that is either national or global in order to recognize the environmental burdens arising from the activities of a society, a region or an industrial sector. In practice, LCA could provide practitioners with fantastic insight into researching any given product in order to determine the best strategies to lessen the environmental effect of a certain product or process. LCA is focused with determining the ecological impacts of a specific product or process at each of these life phases. When the LCA is fully implemented, every operator may do a comparative assessment of the product's phases of life, identify where the most environmental benefit is to be obtained, and eventually follow the long-term effect of improvements in design and/or production [5].
As demonstrated in Figure 2, ISO 14040-14044 are process-based LCA standards that are organized into 4 stages: goal and scope definition, inventory analysis, impact assessment, and interpretation.
Figure 2. LCA framework
The results of the preceding phases are interpreted, and suggestions for improving the technological aspects of the product or process in examination are made. In an ideal world, this data would provide specific advice to constructive measures. EA is used to track processes or a specific product from a thermodynamic standpoint.
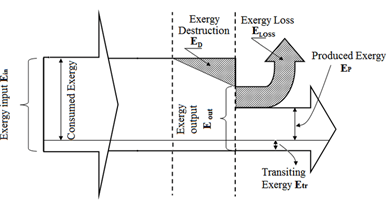
Exergetic analysis (EA) is a method of accounting for the amount of useful work that may be extracted from a real system when it is brought into equilibrium with its environment. It is based on the second law of thermodynamics. It is used to track processes or a specific product from a thermodynamic standpoint. The improvement variables involve reducing exergetic degradation owing to system irreversibilities (shown in Figure 3) [6], that explains why the system is less successful than theoretically predicted. It is an optimization method that may supplement and expand traditional LCA. In reality, the traditional LCA method is heavily focused on harmful emissions, whereas EA is far more focused on the product, emphasizing capital allowance and system efficiency.
Figure 3. Sankey diagram of a generic exergy balance [7]
EA combined with LCA provides significant benefits [8]: first, they give more effective assessment outcomes; second, they get to be a helpful instrument for decision-making policies targeted at developing a retrofitting remedy, allowing the system to prevent any shortcomings automatically. Furthermore, they are important tools for understanding process management options in order to enhance and develop industrial process technologies.
There are several ways to integrate or couple EA and LCA, that cluster in different hybrid methods, all explained in depth [3]. Among those mentioned in the review are the Exergetic Life Cycle Assessment (ELCA), Cumulative Exergy Demand (CExD), Extended Exergy Accounting (EEA), and Exergoenvironmental and Exergoeconomic analysis.
Their integration is indeed quite successful for data analysis because while most metrics must be defined within regional and worldwide regulatory frameworks in order to meet the standards of scientificity, replicability, and consistency, the efficiencies produced by the EA or when coupled with the LCA are self-explanatory and easy to grasp.
Indicators have been identified in a variety of approaches in the literature [9]. Most of the time, the term indicator refers to a method of transferring knowledge in a synthetic form that is simpler than a more intricate event but has greater relevance. As a result, it is a tool capable of bringing to light a pattern or phenomena that is not immediately apparent. An indicator is a metric or aggregation of measurements that may be used to draw inferences about the phenomena of interest based on the objective set.
In order to be scientifically legitimate, any indicator must have the following properties [10]:
In general, and hence in terms of production sustainability, indicators can be defined in a variety of ways. The first significant distinction is established between indicators that relate to immediately quantifiable events and indicators that relate to phenomena that cannot be measured directly. Many of the events that have an impact on sustainable development may be measured. A few are directly detectable (e.g., carbon dioxide, particulates, nitrogen and so on); some are attributes cannot be physically measured but they can be stated quantitatively by referring to a suitable severity scale. Multidimensional indicators and indices are dissimilar: the former provides basic information on the system's components, such as quantities and flows (for example, annual waste generation in a region), whereas the latter allows the information presented to be condensed into several parameters in order to better communicate and facilitate knowledge (e.g., coupling between waste production and economic well-being measured by the ratio of the waste produced to the gross domestic product of a region). Indices, for example, emphasize the link between system components; moreover, they might be given in absolute numbers in a standardized and aggregated form. On the other hand, indicators are commonly used to well evaluate and explain the results of complex systems, as well as to quickly compare various production or multiple systems with different units of measurement. They can also give aggregate data. They are simple to comprehend since their value may range from zero (worst case scenario) to one (best case scenario) (ideal conditions). Indicators are a good method to detect potential improvement on the quality and energetic efficiency in time-dependent activities quickly and automatically.
3.1 A summary of the metrics of sustainability in the industrial sector associated to EA and LCA
Several researchers stress the value of utilizing exergetic degradations like an indication since it gives a consistent metric for comparing and evaluating diverse processes. Exergy-based indicators provide useful sustainability measures for assessing the exploitation of material resources and energy, as well as evaluating the negative impacts of ecological and socioeconomic behaviors in manufacturing. The LCA impact categories presented following the characterization and normalization, on the other hand, have traditionally been deemed erroneous due to the difficulty in maintaining objectivity during its stages, furthermore, a handful of life cycle evaluation methodologies allow the generation of non-dimensional indicators. Many metrics solutions such as an integrated index of LCA and EA results but it is still unclear how accurate they are according to the TBL approach [11].
The formulations and meanings of the most typical metrics that we will examine are discussed in Table 1.
Table 1. The scientific definition of the performance metrics for sustainable manufacturing and their meaning
|
Metric |
Formulation |
Notion |
|
Resources-use efficiency |
$\eta_{p}=\frac{\dot{E} x^{\text {product }}}{\dot{E} x^{i}}$ |
The useful exergy divided by the overall exergy provided to the system. |
|
Net-use efficiency |
$\eta_{\varepsilon}=\frac{\sum \dot{E} x^{j}}{\sum \dot{E} x^{i}}$ |
Overall exergy generated divided by overall exergy in input and output. The ratio is proportionate to the system's intrinsic exergy degradation. |
|
Equivalent wasted primary resource (1) |
$E I_{\lambda}=\frac{T_{0} S_{g}}{n_{h} n_{w}}$ |
The proportion of exergy lost to working hours per worker. It calculates the cost of squandered exergy necessary to support work hours and produce capital flow. |
|
Equivalent wasted primary resource (2) |
$E I_{\lambda}=\frac{T_{0} S_{g, P S}}{\dot{m}_{C O 2}} \dot{m}_{\text {product }}$ |
The exergy loss-to-wasted-product mass ratio expressed in CO2 and the mass generated in a day. |
|
Exergy Return on Investment |
$E x R O I=\frac{E x_{n e t}}{E x_{n e e d e d}}$ |
The quantity of net exergy obtained from a process divided by the amount of exergy required (or its equivalent from another source) to produce it. |
|
Exergetic index |
$e x_{c}=\frac{E x_{c}}{m_{p d}}[M J / \mathrm{kg}]$ |
The ratio of entire exergy loss, including environmental emissions, to a specific quantity of product representing the functional unit. |
|
Global Warming Potential |
$G W P=\frac{\int_{0}^{y n} F_{r e s} \quad (t) d t}{\int_{0}^{y n} F_{C O 2} \quad (t) d t}$ or $G W P=\sum_{i=1}^{n}\left(m_{i} \cdot I F_{i}\right)\left[k g C O_{2} e q\right]$ |
The influence of a substance as compared to the same concentration of CO2 over time. |
|
Cumulative Exergy Extracted from Natural Environment |
$C E E N E_{J}=\sum^{i}\left(X_{i} \cdot a_{i, j}\right)$ [MJeq]] |
Accounting for several sorts of resources (measured in different units) per functional unit, all represented in exergy terms with a reference factor. The extraction of usable exergy contained in resources results in resource depletion. |
|
Feasibility Level |
$F L=\sum_{i=1}^{8}\left(x_{i} \cdot w_{i}\right)$ as $x_{i}=\left[\begin{array}{c}\frac{X_{i}}{X_{o p t}} X_{i} \in(E n, E x) \\ \frac{X_{o p t}}{X_{i}} X_{i} \in(E x, E c o, E n v)\end{array}\right]$ |
Economic (Eco), environmental (Env), energetic (En), and exergetic (Ex) measures are all used to calculate the overall influence of eight components. |
|
Primary exergy conversion efficiency |
$\Pi_{P E C E}=\frac{E x_{\text {prod-i}} \quad +E x_{\text {biprod-i}}}{E x_{\text {material }} \quad +E x_{\text {supply }}}$ |
The ratio of the usable outcome to the sum of the inputs that worked together to produce it. |
|
Material and resource consumption efficiency |
$\Pi_{M R C E}=\frac{E x_{\text {prod}} \quad +E x_{\text {env-standard }}}{E x_{\text {mat }} \quad +E x_{\text {supply }} \quad +E x_{\text {recy }} \quad +E x_{\text {biprodi }}}$ |
The output, minus the exergy loss, to the total of the inputs minus the regenerated biproducts. |
|
Environmental impact efficiency |
$\Pi_{E I E}=\frac{E x_{e n v-\text { mixing }}}{E x_{\text {mat }} \quad +E x_{\text {supply }} \quad +E x_{\text {recy }} \quad +E x_{\text {biprodi }}}$ |
The ratio of the sum of the inputs to the exergy of mixing. |
|
Sustainability index |
$S_{I C}=\frac{\Delta k_{E}}{k_{T}}$ |
The ratio of the environmental exergetic cost of two alternatives to the indirect exergetic cost. |
|
Renewability Factor |
$F R=\frac{C E x D_{\text {ren }}}{C E x D_{\text {non-ren }}}$ |
The ratio between CExD of renewable resources to CExD of nonrenewable ones. |
|
Exergy Structure Ratio |
$E S R=\frac{C E C_{i}}{E_{w i}+E_{c i}}$ |
Exergy consumption structure in various productions, derived by comparing material-based exergy consumption to social supporting exergy within sectoral size. |
|
Social Exergy Conversion Rate |
$S E C R=\frac{E_{w}+E_{c}}{\sum C E C_{i}}$ |
Net social exergy conversion level by intaking material-based exergy, calculated by the ratio of labour and capital equivalent exergy to exergy input into the system. |
|
Exergy Deliver Efficiency |
$E D E=\frac{\sum f_{i j}}{C E C_{j}}$ |
Ability in production sectors to deliver exergy into the system from the environment, calculated by exergy output from production sector j divided by exergy input into production sector j from the surrounding. |
|
Environmental Yield Ratio |
$E Y R=\frac{C E C}{E_{\text {in }}}$ |
Ability of a process to exploit available locally renewable and non-renewable resources by investing outsider sources. The higher the value of this index, the greater is the return obtained per unit of exergy invested. |
|
Environmental Loading Ratio |
$E L R=\frac{E_{N}+C E C_{N}}{E_{R}+C E C_{R}}$ |
Outside causes of disruption to the local drive are possible. The smaller the ratio, the lesser the environmental stress. |
|
Extended Exergy Sustainability Index |
$E E S I=\frac{E Y R}{E L R}$ |
Index aggregation based on interaction with the surrounding environment as well as renewability. |
|
Exergetic Eco-Efficiency |
$\eta_{\text {eco }}=\frac{\eta_{\text {exergetic }} \cdot \quad \left(F_{n-r} \quad +F_{r}\right)}{F_{n-r} \quad +\eta_{\text {exergetic }} \quad \cdot F_{r}}$ |
The efficiency with which renewable and non-renewable resources are used during the full Life Cycle of the product or process under consideration. |
|
Global Greenhouse Gases index |
$i_{G H G}^{G l o b a l}=\frac{i_{G H G}^{\text {total }} \quad (\text { carnot condition })}{i_{G H G}^{\text {total }} \quad (\text { real condition })}$ |
Degree of improvement in relation with the impact category (focused in the GHG emission). |
|
Lifecycle Quality Index |
$\psi=\frac{U C E x}{C E x D}$ |
The ratio of the beneficial impacts of a process or product to the entire cost of providing a specific provision. |
|
Lifecycle Irreversibility Index |
$X=1-\psi=\frac{\text { CExD-UCE } x}{C E x D}$ |
Complementary to ψ. |
|
Technology Obsolescence Index |
$X_{i, j}=\frac{X_{i}}{X_{j}}$ |
Which revolutionary technology, when compared to existing technologies, has the potential to lower the irreversibilities of the process or product under consideration. |
The classic exergetic rate quantifies the ratio of gains to expenses or degradation. The inefficiencies are equivalent to the difference between what is given and how much is gained, and they are associated with the irreversible destruction of exergy, as already stated. The output/input exergy ratio (used to judge quality performance) and exergy per unit of product (used to evaluate sustainable performance) are the two most commonly used exergetic metrics. The net, ηε, and general, ηg, efficiency of the process or its components are defined, depending on whether the purpose is to analyze the proportion of usable exergy for the realization of the final product or to evaluate the overall exergy. The former is the ratio of the system's useable exergy to the entire amount of exergy delivered to the system, whereas the latter is the proportion of total exergy produced to the whole exergy supplied to the system. The ratio is proportional to the inherent exergetic loss of the system. The Global Warming Potential (GWP) was developed to allow evaluations of various resources' climate change implications [12]. It is an estimate of how much energy a ton of a substance could use in comparison to a ton of CO2 emissions during a certain time frame. To higher GWP corresponds a particular gas that heats much the Earth in compared to CO2 throughout the same time period. The most frequent period extent for GWPs is 100 years. GWPs provide a standard unit of measurement that allows analysts to add up emissions figures for different gases (for example, to compile a national GHG inventory) and policymakers to compare emissions reduction opportunities across industries and gases.
Cumulative Exergy Extracted from the Natural Environment (CEENE) [13], is a resource accounting system that quantifies diverse types of resources per functional unit in a single unit (exergy). The quantity of energy equivalent to each input in each process is computed by multiplying the resource inputs by the reference flow's cumulative exergy factor. Its concept is founded on wide international features. It takes into account the depletion caused by the extraction of useful exergy embedded in resources when they are extracted from their natural environment, such as abiotic renewable resources, fossil fuels, nuclear energy, metal ores, minerals and mineral aggregates, water resources, land and biotic resources, and atmospheric resources. Many authors have utilized CEENE in their studies, including [14], which used CEENE to quantify the life cycle resource footprint (upstream effects) of a MCFC powerplant, Alvarenga et al. [15] who proposed and implemented a new framework for calculating exergy-based spatial explicit characterization factors (CF) for land as a resource, which deals with both biomass and area occupied on a global scale by creating a schematic overview of the Earth, dividing it into two systems (human-made and natural), allowing it to account for what is actually extracted from nature, i.e., the biomass content was set as the elementary flow to be calculated We were able to develop CF for land resources for these two separate systems using exergy. The novel CF's applicability was evaluated for a variety of biobased goods. And [16], who included the CEENE method in the LCIA method and was capable of analyzing the environmental impact (and, more specifically, the resource footprint) of marine area occupation in two case studies: comparing resource consumption of on- and offshore oil production, and fish and soybean meal production for fish feed applications.
In their recent work [17] introduced other two exergy-based indicators, a modification of the classic exergy efficiency ratio, were introduced to quantify the technical level of a process in relation to its unavailability. The goal was to assess the equivalent primary wasted resources, technological features, and advanced level of industrial processes by calculating the cost of the wasted exergy required to support workhours and generate capital flow, as well as the quantity of production expressed by mass and moles of CO2 for wastes. Also [18] adapted the exergy efficiency naming it Energy (Exergy) Return on Energy (Exergy) Investment (EROEI or ExROI), which is defined as the ratio between the net exergy generated by the system and the embodied non-renewable exergy necessary to develop the system itself. If the ratio turns out to be less than the unit, the expenditure outweighs the gain. In the aforementioned study [19] created an ‘exergetic index’ by dividing the entire consumption of exergy (in MJ) by the mass of the product that represents the functional unit of the case study (in kg). It is a particularly valuable tool for assessing the potential for technological development of processes and gauging quality. In the context of multi-criteria or multi-factor decision making, in their study [20] calculated eight multi-factor indicators representing exergetic, energetic, economic and environmental elements of the Organic Rankine Cycle for water heat recovery in their study. The eight indicators are in the energetic context: net power output (Wnet) and thermal efficiency (ηth); in exergetic context: total exergy loss (Itot) and exergy efficiency (ηex). In the economic context: cost per unit of time (Z), electricity production cost (EPC) and dynamic payback period (DPP). In the environmental context: CO2-equivalent emissions (ECE). Weighting and normalization were used to construct the Feasibility Level, which represents the total influence of the eight indicators. [21] conducted an early environmental evaluation assessment comparing the three major impact categories of Eco-Indicator 99 (Human Health, Ecosystem Quality and Resource Consumption) with new three dimensionless indicators ∏ derived from EA (primary exergy conversion efficiency, material and resource consumption efficiency and environmental impact efficiency), in order to offer a possible solution to the heterogeneity metrics problem during the interpretation of the results. The difference of the meaning of these three new indicators lies in the considered exergetic terms for the ratio. In the energy systems context [22], presented a dimensionless sustainability index SIC in the context of energy systems to assess alternative to various end services that imply distinct metrics and magnitudes but referred to the same functional unit. The index indicates the environmental damage averted by selecting the best solution. Another point of view is provided by Domínguez et al. [23], who introduced an indicator called the renewability factor (FR) to examine the correlation between nonrenewable and renewable resources over the full lifecycle of each stream. It is the ratio of CExD of renewable resources to total CExD of nonrenewable ones. Dai et al. [24] in their work provided a list of six EEA-based indicator to assess the effective use of energetic streams and material streams in complex systems of some industrial sectors including environmental, social, and economic dimension. Koroneos and Stylos [25] introduced an ELCA eco-efficiency indicator to take into consideration demand reliability for renewable and nonrenewable sources throughout the lifecycle of a polycrystalline photovoltaic system. The large disparity from conventional exergetic efficiency metrics is due to the inclusion of the amount of renewable sun irradiation in total incoming exergy, which the basic LCA metrics do not capture. Restrepo & Bazzo [26] addressed the Exergoenvironmental study from a systematic approach on co-firing power plants in 2016. The writers concentrated solely on the operational phase. They developed the Exergoenvironmental-based Global Greenhouse Gases index for a variety of co-firing scenarios in order to assess the extent of the power plant's improvement. The index's objective is to compare the exergoenvironmental impact of the real process under investigation to the impact of the identical ideal process (under Carnot cycle condition). A higher index value indicates a more sustainable process. To aid practitioners in comparing similar technologies [27] integrated EA within lifecycle proposing three new metrics focusing on technological obsolescence irreversibility and quality. Life Cycle Irreversibility Index might reveal exergy inefficiency and necessary retrofit measures through assessing the yield between the usable accumulated exergy of all sub-processes in respect of total CExD of the system. Technology obsolescence the valuable criterion in strategic planning to assess the grade of innovation that the considered technology has compared with alternatives in lowering current irreversibilities in the process, decreasing natural resource extraction.
The authors provide these indicators under a variety of titles, but the general pattern is a comparison of the system's output flows with its input flows, with certain special idiosyncrasies in any test case. Furthermore, the worth has been defined in many appellations such as “indicator” “index of quality”, “performance”, “efficiency”, “yields”.
Here, an ideal interpretation for this sort of indication is “indicator of reversibility”. The selection is supported initially by the Brundtland Report's concept of sustainable development, which was published in 1987 [2]: “is the development that meets the needs of the present without compromising the ability of future generations to meet their own needs”; lately by Dewulf et al. [28] where they contended that a technological process is only sustainable if its resource supply, output, and depletion of natural resources or waste do not harm the ecosphere's environmental integrity. Then, Valero et al. [29] that established a metric called Exergy Replacement Cost, which is “the amount of exergy required to return the resources to their initial state (equilibrium)”.
The test case aims to implement some of the techniques presented in the state of the art and to compare the most relevant indicators described in Table 1.
The system under discussion includes an Italian small and medium-sized company that manufactures all the metallic and plastic elements for the window and door frames. The company is particularly sensitive to the quality of its products, but not at the expense of sustainable development. In particular, it pledges to update EPD certificate on its products cyclically. The metrics will be computed according to the same functional unit, which corresponds to a single finished product: one piece of corner square made up of six sub-components (see Figure 4 for the overall manufacturing process flow chart):
Now, in to make the findings of LCA and EA more consistent to be compared, the stages of transportation (typical of LCA), assembling, and package will no longer have been included in the study going to decrease the amount of variance in the system design, accounting, and estimations. Finally, the goal and scope of the two independent assessments are the same, the system boundaries as well, and the inventory analysis is performed on the same energy and material streams.
Table 2 shows the primary streams of resources, energy, and outputs for each subprocess, according to the previously defined FU.
In shortness, the results of the indicator analysis and calculation are directly illustrated and described, avoiding all in-depth descriptions of each manufacturing sub-process, which is not the central theme of the paper.
Figure 4. Flow chart of corner square’s manufacturing processes
Table 2. Process input and output streams
|
Subprocess |
Materials |
Electrical Energy |
Wastes |
|||
|
Type |
Quantity |
Non-renewable |
Photovoltaic |
Type |
Quantity |
|
|
Die-casting zamak |
Zamak |
0.0014 kg |
0.0012 kWh |
0.00011 kWh |
Metal |
0.0001 kg |
|
Additives & Chemicals |
0.0005 kg |
VOC |
0.00011 kg |
|||
|
Die-casting aluminium |
Aluminum |
0.0248 kg |
0.00067 kWh |
0.00003 kWh |
Metal |
0.00048 kg |
|
Natural gas |
0.012 m3 |
VOC |
0.00002 kg |
|||
|
Additives & Chemicals |
0.001 kg |
Oil mist |
0.0009 kg |
|||
|
Smoothing and cutting |
Stainless steel coils |
0.0011 kg |
0.00082 kWh |
0.00008 kWh |
Metal |
0.00005 kg |
|
Additives/Chemicals |
0.0003 kg |
Oil |
0.0001 kg |
|||
|
Washing |
Water |
0.0976 l |
0.0022 kWh |
0.00021 kWh |
Sludge |
0.095 l |
|
Natural gas |
0.0018 m3 |
Formaldehyde |
0.000001 kg |
|||
|
Additives & Chemicals |
0.0003 kg |
Chemicals |
0.0003 kg |
|||
|
Vibro-tumbling |
Abrasives |
0.0002 kg |
0.00082 kWh |
0.00008 kWh |
Grains |
0.0002 kg |
|
Shot-blasting |
Abrasives |
0.0003 kg |
0.0016 kWh |
0.00014 kWh |
Grains |
0.0003 kg |
|
Drilling and threading |
Additives & Chemicals |
0.0001 kg |
0.000034 kWh |
0.000006 kWh |
Metal |
0.0001 kg |
4.1 Results and discussion
The metrics results shown in Table 3 have been calculated according to the respective formulations described in Table 1.
GWP100y is totally an LCA method of assessment and it is being used as a metric for the EPD certificate. The GWP represents the greenhouse effect's influence in respect to the CO2 effect, which has a unitary scale potential. Each GWP figure is calculated for a time span of 100 years. SimaPro® and Ecoinvent database has been used to implement the industrial case, which reported a total value of GWP of 0.3186 kg CO2-eq/pc neglecting the contribution of assembly and packaging in the system boundaries. According to the second column of Table 3, die casting aluminum is the most energivor subprocess.
Exergetic degradation highlights the inefficient uses of available energy (irreversible). The Exloss which is total 1.315 MJ value however has been included in the list since it is commonly mistaken as a criterion for identifying which sub-process consumes the most energy and so has the greatest opportunity for enhancement, both in level of technical quality and sustainability. Looking at the Table 3, it is clear that there are cases where the result is consistent with that expressed by GWP100y, at least from a ranking standpoint, and other cases where a subprocess, such as washing, finds itself less energizing than vibro-tumbling, despite the GWP’s assertion to the contrary. Exloss has consistently identified the two die casting processes as less sustainable.
Exergetic efficiency, Exergetic efficiency, denoted by the symbol ηp, is a nondimensional quantity that may alternatively be written as a percent. In order to increase performance, exergetic efficiency highlights the significance of measuring losses and internal irreversibilities. Higher exergetic efficiency reflects more energy utilized in the system, making it more sustainable, whereas smaller exergetic efficiencies imply energy losses and internal irreversible processes, leading to bad energy quality and a worse ranking in terms of sustainability. The overall efficiency of the process under consideration is 50.70 percent, placing steel corner production on a medium sustainable route. As a consequence of pure exergetic analysis, the ηp findings are totally compatible with Exloss, indicating diecasting operations as the most energivor subprocesses. the process efficiency is represented by the value 12.34 percent of the die casting aluminum, independent of the number of items manufactured. It has a somewhat better efficiency than the zamak, which contradicts the GWP100y.
The ecoefficiency, ηeco, is used to compare analogous systems. It is focused on the potential difference in the impact of exergy generated from renewable sources versus exergy generated from nonrenewable sources. Hence, the more specific the definition of which streams in the process come from renewable resources and which come from non-renewable resources, as opposed to the intelligent use of recyclable materials, the more trustworthy this indicator becomes. Given the above, the whole process has an ecoefficiency of roughly 0.56, which is not directly comparable to conventional energy efficiency, but when compared to the hierarchy of sub-processes, it is highly compatible with GWP. The two die casting operations are the most inefficient sub-processes in terms of environmental impact. The Life Cycle Irreversibility Index, χ, complementary of the Life Cycle Quality Index ψ, allows the evaluation of processes and products having the same functional unit. In contradiction to the preceding indicator, this one stresses the value of usable exergy produced all through the lifecycle, as well as the recycling potential of solid wastes, and hence exergy that can be recovered rather than exergy that is fully lost. The index evaluates exergetic inefficiencies, yet, if an actual system is compared to the most recent technical developments or to an ideal Carnot machine, a score measuring technology obsolescence may be adopted. About the test case, χ confirms that die casting is the most impactful, (with the most irreversibility). By arithmetic mean, the overall steel corner manufacture is for 60 percent irreversible.
The Renewability Factor comparable to the ηeco, but since it is calculated entirely on SimaPro® using the CExD. The metric confirms that diecasting is the least environmentally friendly. Still, it is contradictory with ηeco. To aggregate results, the overall production process has a low FR of 0.348 on average, where 1 is the value for an ideal process.
But, although all indicators concur that the two diecasting processes are the less sustainable, if comparing to other subprocesses, this concordance is not obvious.
The most essential point to emphasize in this debate is the LCIA implemented in SimaPro®, which is distinguished by the selection of a large quantity of background data that already have determined pre-set treatment; thus, the findings of LCA and EA cannot be compared and contrasted, to the point where SimaPro®’s CExD values and the results of pure exergetic analysis do not meet the requirement of comparability. Everything raises the level of uncertainty in drawing conclusions for effective waste reduction and process improvement measures. As a result, it would be appropriate to compare consistent metrics with one another in terms of inventory and process type, such as metrics produced from combined EA + LCA approaches, may seem to be a much more reliable option. It should be emphasized, though, that each metric tries to reflect distinct features, as illustrated in Table 2.
Table 3. Results of the metrics expressed along the subprocesses
|
Subprocess |
Metric |
|||||
|
GWP100y [kgCO2-eq] |
Exloss [MJ] |
ηp [%] |
ηeco [-] |
χ [-] |
FR [-] |
|
|
Die-casting zamak |
0.0731 |
0.217 |
11.20 |
0.137 |
0.92 |
0.149 |
|
Die-casting aluminium |
0.1674 |
0.445 |
12.34 |
0.114 |
0.89 |
0.229 |
|
Flattening and cutting |
0.0107 |
0.133 |
47.89 |
0.564 |
0.74 |
0.46 |
|
Washing |
0.0218 |
0.085 |
79.08 |
0.721 |
0.65 |
0.355 |
|
Vibro-tumbling |
0.0099 |
0.178 |
52.47 |
0.821 |
0.24 |
0.371 |
|
Shot blasting |
0.0321 |
0.186 |
63.28 |
0.680 |
0.58 |
0.431 |
|
Drilling and threading |
0.0036 |
0.071 |
88.65 |
0.873 |
0.17 |
0.444 |
|
Overall |
0.3186 |
1.315 |
50.70* |
0.559* |
0.60* |
0.348* |
*arithmetic mean of the values in that column
Sustainable manufacturing is the most crucial component that all production engineers must identify, not because it is a cultural trend, but because it is a mandate as a duty to the environ wherein, we inhabit. The production lifecycle evaluation has become a popular tool for determining the environmental impact of items, processes, or activities. To reach the goal of earth's self-recovery capabilities, the three key ideas to be addressed are minimizing the use of resources in the process, using environmentally friendly materials, reducing all sorts of waste, and reusing and recycling as much material as feasible.
According to the findings of the state of the art and the case study, it is not feasible to establish an indicator that individually and thoroughly assesses the degree of manufacturing sustainability, not one of the steel corner production methods. Despite the lack of a defined, thorough, and widely used assessment model, Exergy Analysis within Life Cycle thinking remains an effective technique for optimizing industrial processes.
The multidimensional nature of the measures described in this paper emphasizes how difficult the topic of sustainable manufacturing is. A lack of appropriate indicators and a consolidated set of equations for a set of sustainable solutions, as well as a deficiency of full and always updated data and uncertainty analysis, are frequently troublesome, resulting in a poor level of scientific accuracy in the evaluation.
|
CEENE |
Cumulative Exergy Extracted from Natural Environment |
|
EA |
Exergetic Analysis |
|
Ex |
exergetic flow-rate, J.s-1 |
|
FR |
nondimensional Renewability Factor |
|
FU |
Functional Unit |
|
CExD |
Cumulative Exergy Demand, MJ |
|
GHG |
Greenhouses, CO2-eq |
|
GWP |
Global Warming Potential, kgCO2eq |
|
IF |
nondimensional Impact Factor |
|
LCA |
Life Cycle Assessment |
|
m |
mass flow-rate, kg.s-1 |
|
MCFC |
Molten Carbonate Fuel Cell |
|
Greek symbols |
|
|
ε |
net use |
|
η |
nondimensional efficiency |
|
χ |
nondimensional technology obsolescence index |
|
ψ |
nondimensional lifecycle quality index |
|
Superscripts and subscripts |
|
|
eco |
ecological |
|
g |
general |
|
i |
state-point in |
|
j |
state-point out |
|
loss |
flow-rate loss |
|
nr |
nonrenewable |
|
r |
renewable |
|
y |
years |
[1] Selicati, V., Cardinale, N. (2021). Interpretation of manufacturing sustainability-assessment through hybrid exergetic and life-cycle metrics. Tecnica Italiana-Italian Journal of Engineering Science, 65(2-4): 143-150. https://doi.org/doi.org/10.18280/ti-ijes.652-401
[2] Brundtland, G. (1987). Report of the World Commission on Environment and Development: Our Common Future. United Nations General Assembly Document A/42/427. (n.d.).
[3] Selicati, V., Cardinale, N., Dassisti, M. (2021). The interoperability of exergy and life cycle thinking in assessing manufacturing sustainability: A review of hybrid approaches. Journal of Cleaner Production, 286: 124932. https://doi.org/10.1016/j.jclepro.2020.124932
[4] Howard, M.C. (2011). Sustainable Manufacturing Initiative (SMI): U.S. Department of Commerce.
[5] Trancossi, M., Páscoa, J.C., Xisto, C.M. (2016). Design of an innovative off road hybrid vehicle by energy efficiency criteria. International Journal of Heat and Technology, 34(Special Issue 2): S387-S395. https://doi.org/10.18280/ijht.34S228
[6] Tarla, M.R., Surapaneni, S.R., Varughese, K.T. (2021). Modifications of sub-components in thermal power plants for exergetic efficiency. International Journal of Heat and Technology, 39(2): 573-580. https://doi.org/10.18280/ijht.390227
[7] Shukuya, M., Hammache, A. (2002). Introduction to the concept of exergy - for a better understanding of low-temperature-heating and high-temperature-cooling systems. Espoo: VTT Technical Research Centre of Finland. http://www.vtt.fi/inf/pdf/tiedotteet/2002/T2158.pdf.
[8] Selicati, V., Cardinale, N. (2021). The benefits in coupling exergy analysis and life cycle assessment in the context of sustainable manufacturing for industry 4.0: A real industrial case. International Journal of Heat and Technology, 39(1): 12-22. https://doi.org/10.18280/ijht.390102
[9] Heink, U., Kowarik, I. (2010). What are indicators? On the definition of indicators in ecology and environmental planning. Ecological Indicators, 10(3): 584-593. https://doi.org/10.1016/j.ecolind.2009.09.009
[10] United Nations. (2019). Guidelines for the Development of a Criteria and Indicator Set for Sustainable Forest Management. UN. https://doi.org/10.18356/235aa26b-en
[11] Böhringer, C., Jochem, P.E.P. (2007). Measuring the immeasurable - A survey of sustainability indices. Ecological Economics, 63(1): 1-8. https://doi.org/10.1016/j.ecolecon.2007.03.008
[12] IPCC. (2006). Guidelines for National Greenhouse Gas Inventories (Industrial Processes and Product Use., Vols. 1-5, Vol. 3). IPCC. Retrieved from https://www.ipcc-nggip.iges.or.jp/public/2006gl/vol3.html.
[13] Dewulf, J., Bösch, M.E., Meester, B.D., Vorst, G.V., Langenhove, H.V., Hellweg, S., Huijbregts, M.A.J. (2007). Cumulative Exergy Extraction from the Natural Environment (CEENE): A comprehensive life cycle impact assessment method for resource accounting. Environmental Science & Technology, 41(24): 8477-8483. https://doi.org/10.1021/es0711415
[14] Mehmeti, A., Pedro Pérez-Trujillo, J., Elizalde-Blancas, F., Angelis-Dimakis, A., McPhail, S.J. (2018). Exergetic, environmental and economic sustainability assessment of stationary molten carbonate fuel cells. Energy Conversion and Management, 168: 276-287. https://doi.org/10.1016/j.enconman.2018.04.095
[15] Alvarenga, R.A.F., Dewulf, J., Van Langenhove, H., Huijbregts, M.A.J. (2013). Exergy-based accounting for land as a natural resource in life cycle assessment. The International Journal of Life Cycle Assessment, 18(5): 939-947. https://doi.org/10.1007/s11367-013-0555-7
[16] Taelman, S.E., De Meester, S., Schaubroeck, T., Sakshaug, E., Alvarenga, R.A.F., Dewulf, J. (2014). Accounting for the occupation of the marine environment as a natural resource in life cycle assessment: An exergy based approach. Resources, Conservation and Recycling, 91: 1-10. https://doi.org/10.1016/j.resconrec.2014.07.009
[17] Lucia, U., Grisolia, G. (2019). Exergy inefficiency: An indicator for sustainable development analysis. Energy Reports, 5: 62-69. https://doi.org/10.1016/j.egyr.2018.12.001
[18] Cleveland, C.J., Costanza, R., Hall, C.A.S., Kaufmann, R. (1984). Energy and the U.S. economy: A biophysical perspective. Science, 225(4665): 890-897. https://doi.org/10.1126/science.225.4665.890
[19] Beccali, G., Cellura, M., Mistretta, M. (2003). New exergy criterion in the “multi-criteria” context: A life cycle assessment of two plaster products. Energy Conversion and Management, 44(17): 2821-2838. https://doi.org/10.1016/S0196-8904(03)00043-8
[20] Zhang, C., Liu, C., Xu, X., Li, Q., Wang, S. (2019). Energetic, exergetic, economic and environmental (4E) analysis and multi-factor evaluation method of low GWP fluids in trans-critical organic Rankine cycles. Energy, 168: 332-345. https://doi.org/10.1016/j.energy.2018.11.104
[21] Medyna, G., Nordlund, H., Coatanea, E. (2009). Study of an exergy method for environmental evaluation assessment in the early design phase using comparative LCA and exergy approach. International Journal of Design Engineering, 2(3): 320. https://doi.org/10.1504/IJDE.2009.030178
[22] Rubio Rodríguez, M.A., Ruyck, J.D., Díaz, P.R., Verma, V.K., Bram, S. (2011). An LCA based indicator for evaluation of alternative energy routes. Applied Energy, 88(3): 630-635. https://doi.org/10.1016/j.apenergy.2010.08.013
[23] Domínguez, E.R., Fernández, M.C., Soria, C.G., Clavijo, D.O., Nodal, C.M., Moya, A.M.C., Morales, M.C. (2011). Exergetic Life Cycle Analysis in the selection of energetic sources for isolated communities in Latin American, 10.
[24] Dai, J., Chen, B., Sciubba, E. (2014). Ecological accounting based on extended exergy: A sustainability perspective. Environmental Science & Technology, 48(16): 9826-9833. https://doi.org/10.1021/es404191v
[25] Koroneos, C., Stylos, N. (2014). Exergetic LCA of a Grid Connected, Polycrystalline Silicon Photovoltaic System, 16. https://wlv.openrepository.com/bitstream/handle/2436/618760/Koroneos_C_&_Stylos_N_exergetic%20LCA_2014.pdf;sequence=6.
[26] Restrepo, Á., Bazzo, E. (2016). Co-firing: An exergoenvironmental analysis applied to power plants modified for burning coal and rice straw. Renewable Energy, 91: 107-119. https://doi.org/10.1016/j.renene.2016.01.048
[27] Gulotta, T.M., Guarino, F., Mistretta, M., Cellura, M., Lorenzini, G. (2018). Introducing exergy analysis in life cycle assessment: A case study. Mathematical Modelling of Engineering Problems, 5(3): 139-145. https://doi.org/10.18280/mmep.050302
[28] Dewulf, J., Langenhove, H.V., Mulder, J., van den Berg, M.M.D., van der Kooi, H.J., Arons, J.S. (2000). Illustrations towards quantifying the sustainability of technology. Green Chemistry, 2(3): 108-114. https://doi.org/10.1039/B000015I
[29] Valero, A., Valero, A., Domínguez, A. (2013). Exergy replacement cost of mineral resources. Journal of Environmental Accounting and Management, 13.