Tubagus Hendri Febriana* | Hasbullah Hasbullah
© 2021 IIETA. This article is published by IIETA and is licensed under the CC BY 4.0 license (http://creativecommons.org/licenses/by/4.0/).
OPEN ACCESS
In line with the increasingly fierce industry competition, all companies strive to make continuous improvements to increase added value and reduce waste which will impact the company's ability to maintain its existence in the future. One of the problems found in the tire manufacturing industry is the quality problem of the occurrence of defects in the mixing process which is dominated by the viscosity out standard on the compound steel breaker. In this study, analysis and improvement of the defect problem were carried out using Fault Tree Analysis (FTA), Failure Mode and Effect Analysis (FMEA), and Multiple Linear Regression (MLR) to test the correlation between the root causes found to the main problem. Based on the results of the analysis found thirteen root causes where the factor of variation in material viscosity and the suitability of determining the design process has the largest Risk Priority Number (RPN) value and has a strong correlation to defects that occur based on hypothesis testing. Furthermore, improvements are made using the DMAIC method on all factors that affect the occurrence of defects. As the result, the improvement can be effective in reducing the defect to 34.5% and achieve the expected target.
tire manufacture, DMAIC, MLR, FMEA, FTA, capability process, Indonesia
More than 100 years of pneumatic tires for cars began to be produced, at least 60% of the global population of goods pneumatic tires are still the dominant solution in the automotive sector [1]. The increase in vehicle production is in line with the increasing demand for tires in the market, thereby making the pneumatic tire market growth substantially increase [2]. However, the Indonesian tire industry is currently experiencing a global financial crisis that affects all industries, not only the automotive and tire industries, although international rubber prices have also fallen. Since automotive is a tertiary need, the economic slowdown further reduces the purchasing power of consumers. In contrast to this, signs of economic recovery in early January 2016 were partly positive signals for the tire industry [3].
The Ministry of Industry (Kemenperin) predicts that tire industry production in 2020 will decline. The reason is, the Ministry of Industry noted that the utilization of the national tire industry was below 50 percent for almost one semester [4]. The challenges for companies are increasing to reduce costs, and quickly adapt to market regulations in the era of globalization and growing competitiveness [5]. With the consideration of increasingly rapid evolution, organizations must compete with strict attention to the factors that affect the process. Therefore, companies must continue to pay attention to the delivery time limit, costs to be incurred, and the quality of their products so that they are in line with market demand [6]. Quality management methods are successfully used in business process development and need to be continuously improved in terms of adapting business models so that companies become more competitive [7].
To achieve this goal, the company is fully involved by improving product quality, maximizing profits, and continuously eliminating potential waste in the production process to increase customer satisfaction. To achieve this, companies must continue to engage in increasing customer satisfaction through high-quality products, maximizing their profits by eliminating the possibility of waste along with the production flow. Sequential and orderly methods can enable the identification of problems and solutions through continuous improvement using the Define, Measure, Improve, and Control (DMAIC) cycle [8]. In the 1980s the start of the Six Sigma (6σ) methodology with the DMAIC implementation cycle was successful at Motorola company [9] and was later followed and applied by many companies such as Ford, Allied Signal, Sony, Kodak, and Texas Instruments [10]. Continuous improvement using the DMAIC cycle is also applied to the Tire and Rubber sector. Several researchers documented the results of their research, the increase in excellent process capability [11-13], and a significant decrease in the defect rate [14, 15]. Not only in the quality scope, but DMAIC is also able to increase productivity [16] with the Overall Equipment Effectiveness (OEE) indicator increasing from 87% to 92.3% [8, 16], and a significant annual saving quality expense [17, 18].
Based on the description above, the authors are interested in implementing the DMAIC approach in Tire companies in Indonesia. This implementation aims to fully describe the improvement process starting from the upstream process to the downstream process. The DMAIC method is used as a sequence of improvement processes combined with Fault Tree Analysis (FTA) to find the root of the problems that arise, followed by Multi Linear Regression (MLR) to validate the selected variables, and Failure Mode Effect Analysis (FMEA) is used to determine the priority scale for improvement.
2.1 Fault Tree Analysis (FTA)
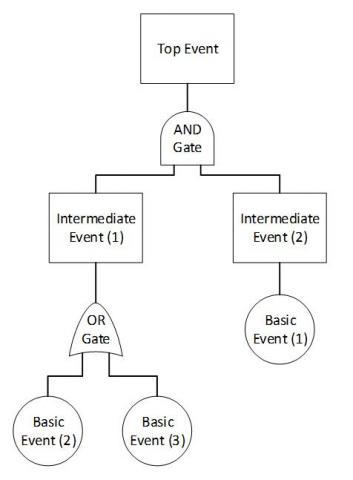
In 1962 the FTA model was first developed at Bell Laboratories by H.A. Watson, then improvements were made by Boeing and adopted in other fields such as nuclear power plants [19], power electronics [20], and chemical processes [21]. FTA is used to perform failure analysis in critical functional level mode and followed by preventive action [22]. FTA is a systematic diagram that describes and identifies failures in system elements and evaluates the impacts that arise, using deductive logic the level of errors can be classified [23]. FTA is represented by using two main graphic symbols called events and gateways [24], this describes a combination of errors or failures that may occur in a system and how their interactions cause overall system failure [23], as shown in Figure 1.
Figure 1. Fault tree analysis diagram
After the construction of the fault tree, the model analysis was carried out in two stages: a qualitative stage and a quantitative stage. Qualitative analysis is usually performed by reducing the fault tree to a minimum cut set (MCS), which is the number of unbounded products consisting of the smallest possible and sufficient combination of base events to cause the top event. Qualitative analysis is usually performed by reducing the fault tree to a minimum cut set (MCS), which is the number of unbounded products consisting of the smallest possible and sufficient combination of base events to cause the top event. The probability of occurrence of the top event and other quantitative reliability indices such as Measures of Importance (IM) are calculated mathematically, considering the failure rate or probability of individual system components, this is referred to as quantitative analysis [23].
2.2 Failure mode and effect analysis
FMEA can identify, define, and eliminate all potential failure modes and their impacts with a systematic and structured approach [25, 26], One of the most widely and commonly used methods in various industries is FMEA [27, 28]. Next, identify the sources and root causes of quality problems and prepare countermeasures and priorities that need to be addressed, starting with the highest priority. FMEA also documents the current condition, risk of failure, and continuous improvement [13]. FMEA is divided into two types, namely Design FMEA and Process FMEA. The tool used to ensure the modes, causes, and consequences of potential failures has been considered regarding the product features to be created by the Design Engineer Team (planners) is called FMEA Design. Furthermore, Process FMEA is a tool used to ensure that the modes, causes, and consequences of potential failures have been properly considered for process characteristics by a team of process engineers. This type of research will be carried out in this study to analyze the failure factors in each process.
FMEA is conducted to determine the possibility of failure and the level of risk that may occur in the company's operations [29]. Three factors determine the level of risk: S (Severity), O (Occurrence), and D (Detection), where for the standard of assessment each has a score of 1–10. The level of risk of failure can be determined from the RPN (Risk Priority Number). It is calculated based on the formula: RPN = S x O x D. A high RPN value indicates a high level of risk and a high priority for preventive and corrective actions [30, 31].
This study aims to find a solution to the problem of quality defects in the mixing process tire manufacturing industry with a series of DMAIC cycles (Define, Measure, Analyze, Improve, and Control). In the define stage, it is done by identifying the process where defect repair will be carried out, the defect data condition is presented in a table along with a chart to show a non-conformance gap against the predetermined target then a Pareto diagram is made to determine the main problem. At the measuring stage, the process capability calculation is carried out against the parameter which is the main problem to see the variation and its impact on potential defects that occur. In the analysis stage, all potential causes that affect the main problem are analyzed using the Fault Tree Analysis (FTA) method where the results of the root problems found are entered into the Failure Mode and Effect Analysis (FMEA) table as potential failure causes which will be calculated the Risk Priority value. Number (RPN) to determine the priority scale of the risk of failure that must be repaired. To strengthen the analysis, a correlation test was carried out using Multiple Linear Regression (MLR) through significance test, t-test, and f-test to prove the existence of a correlation between the potential failure cause and the highest RPN value as the main cause of the potential failure mode that occurs with the occurrence of product defects. Furthermore, at the improvement stage, the variables that have a significant effect on the defects and all recommended actions based on FMEA are corrected for increasing process capability and improving failure detection systems. At the control stage, all improvement items that have been carried out are standardized and process control is carried out using statistical process control (SPC) to determine the level of process stability and product quality where the results will be useful as a basis for determining the next improvement activity.
In the mixing process in the tire manufacturing industry, defects were found above the predetermined target. Therefore, for this research to be reliable and to overcome these problems, it is carried out through the Define-Measure-Analyze-Improve-Control process [32, 33], and multiple linear regression to analyze and take effective corrective actions with the following steps:
4.1 Define the problem and data collection
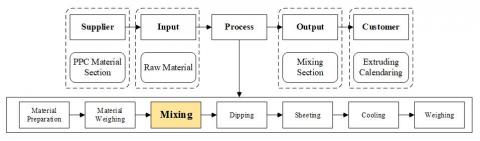
In this phase, the mapping of the production process is carried out through the Supplier Input Process Output Customer (SIPOC) Diagram to identify the process where defects occur. The stages of the mixing process start from material preparation (rubber, chemical, filler, and other materials) than weighing according to specifications and mixed using a Banbury mixer with the rotor rotation speed, pressure, temperature, and grinding time that has been automatically set on the machine. The result of the mixing process is in the form of hot chunks of a mixture of rubber with all these ingredients which are then made sheeting with a thickness that has been adjusted according to specifications and cooled using a fan along with the batch-off machine. Furthermore, the cold compound sheet is weighed on a pallet and stored in the stock area to be distributed to the next process after going through an inspection.
Based on data from the QC laboratory, in the period January to June 2020, the average number of defects that occur in the mixing process is 55,889 kg or 0.947% per month, and this defect ratio exceeds the target set by the company by 0.75% of the total production as shown in Table 1. Therefore, from the observation data that the researchers collected, the mixing process became the focus of this research, as shown in the SIPOC diagram Figure 2. To determine the CTQ (Critical to Quality) defect Pareto diagram was made in the mixing process as shown in Figure 3. Based on Pareto defect (rate by problem), the largest number of defective products is the mismatch of the compound viscosity value of 70.3% of the total defects that occur. As for the total defects that occur due to a mismatch in the viscosity value based on the category, based on (rate by viscosity problem) the problem is dominated by a compound steel breaker which is 77% of the total defect. The impact caused by the occurrence of this defect leads to additional activity for treatment (the amount by treatment) where the Cost of Poor Quality (COPQ) value is USD 1,400 per month, which is calculated based on the total amount of appraisal costs and internal failure costs, includes labor costs, energy costs, and scrap costs. Therefore, to minimize the occurrence of defects and costs incurred, research was carried out by focusing on the main problem of improving the viscosity standard on compound steel breakers.
Table 1. Production vs defect ratio
|
Month |
Total Production (Kg) |
Defect (Kg) |
Ratio (%) |
|
Jan 2020 |
8,458,443 |
78,241 |
0.925 |
|
Feb 2020 |
8,691,839 |
86,310 |
0.993 |
|
Mar 2020 |
8,933,705 |
86,300 |
0.966 |
|
Apr 2020 |
3,996,550 |
38,167 |
0.955 |
|
May 2020 |
1,087,920 |
10,118 |
0.930 |
|
Jun 2020 |
3,964,657 |
36,197 |
0.913 |
|
Average |
55,889 |
0.947 |
|
4.2 Measure
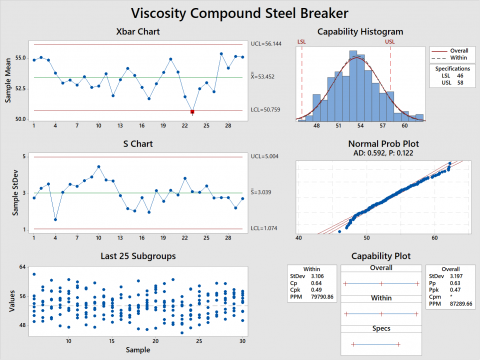
The measuring phase is carried out to determine the current viscosity condition of the compound steel breaker as a basis for analysis and improvement. In this phase, the six sigma analysis is used to determine the performance of the current process capability as shown in Figure 4. Based on the measurement data, the average Cp value = 0.64 and Cpk value = 0.49. Cpk value <1 means that the process is not capable and shows high variation.
Compound steel breaker formulation consisting of 54.4% natural rubber, 32.7% filler, 12.9% chemical, and other constituents. Natural rubber as the largest material component to make up the compound has the potential to have the greatest tendency to influence the large variation in the viscosity compound. Therefore, a measurement of the natural rubber viscosity process capability is also carried out as shown in Figure 5.
Based on the measurement data, as shown in Figure 5, the average Cp value = 0.47 and Cpk value = 0.19. Cpk value <1 means that the process is not capable and also shows high variation. Actually, at this time there is no standard for the viscosity value of all suppliers as acceptance requirements as regulated by the SNI (Standard National Indonesia). Therefore, the standard viscosity of natural rubber set up by the company its self to facilitates the settings during the maintenance process.
Figure 4. Capability process viscosity compound steel breaker
Figure 5. Capability process viscosity natural rubber
4.3 Analysis
At this stage, an analysis is carried out using several analysis tools. Firstly, problem analysis is carried out by Failure Tree Analysis (FTA), to find the root of the problem that causes viscosity compound out standard, as shown in Figure 6. Based on the results of analysis using FTA, it was found eight problems that could potentially cause viscosity out of standard. This problem is further analyzed using FMEA to determine the level of risk and determine the priority scale based on the RPN (Risk Priority Number) value. Based on the results of analysis using FTA, it was found eight problems that could potentially cause viscosity out of standard. This problem is further analyzed using FMEA to determine the level of risk and determine the priority scale based on the RPN (Risk Priority Number) value, as shown in Table 2.
As a basis for determining the company's priority scale, setting a value of RPN> 100, repairs must be made as a preventive action against potential failures that will cause defects. Based on the FMEA table, the two biggest potential effects of failure were found based on the largest RPN value:
1. Natural rubber viscosity variation between suppliers.
2. Process design (mixing time and stages process) for each viscosity value has not been optimized which means the mixing process design is not appropriate to the viscosity level of the material.
Figure 6. FTA diagram viscosity compound
Table 2. FMEA table
|
Potential failure Mode |
Potential effect(s) of failure |
Potential cause(s) of failure |
Cause factor |
Current Process |
RPN |
||
|
S |
O |
D |
|||||
|
High variation viscosity of natural rubber |
Viscosity compound variation |
Variation Natural rubber viscosity from supplier |
Material |
6 |
5 |
6 |
180 |
|
Ineffective mixing process design |
Process design for each viscosity value has not been optimized |
Method |
6 |
5 |
6 |
180 |
|
|
Late spec maintain when a material change |
Man |
6 |
3 |
6 |
108 |
||
|
Unstable air pressure |
Abnormal mixing process |
Less supply from compressors |
Machine |
6 |
3 |
3 |
54 |
|
Abnormal temperature |
Cooling water pipes leak/ clogged |
6 |
2 |
3 |
36 |
||
|
Control valve of Thermal Control unit broken |
6 |
2 |
3 |
36 |
|||
|
Thermocouple position changed/ shifted |
6 |
1 |
2 |
12 |
|||
|
Thermocouple sensor damage/ worn out |
6 |
1 |
2 |
12 |
|||
|
Weighing calibration out of standard |
Material weighing out of specification |
Load cell broken |
6 |
1 |
2 |
12 |
|
|
Weighing accuracy out of standard |
Incorrect setting parameter at weigher |
6 |
2 |
2 |
24 |
||
|
Initial load cell reading is not ‘Zero’ |
6 |
2 |
2 |
24 |
|||
|
The cut gate is not tightly closed blocked by the crust |
6 |
1 |
6 |
36 |
|||
|
The vacuum dust collector is too big |
6 |
1 |
6 |
36 |
|||
To prove the effect of these variables on the defects that occur, an analysis was carried out using multiple linear regression using the R Studio Version 1.4.1717 software. The coefficient of determination and see the contribution of the influence given by the independent variable (X) on the dependent variable (Y) with fifty data. The classical assumption test has been met for the selected model, which is as follows:
$\mathrm{Y}=\beta_{0}+\sum_{i=1}^{3} \beta_{0} \mathrm{X}_{0}+\varepsilon$ (1)
In this study, hypothesis testing will be carried out on three independent variables, including variations in the viscosity of natural rubber (X1=A) as the main ingredient component, mixing time (X2= B) and the number of process stages (X3= C) that affects the variation of the viscosity compound (Y) as the dependent variable. The data for each variable used for analysis can be seen in Table 3.
Therefore, to calculate the coefficient $\beta_{i}$ of multiples of regression equation model, all variables show a strong correlation, collinearity test is also done by checking the tolerance and variance inflation factor (VIF). VIF is the reciprocal of tolerance, a value exceeding 10 (or less than 0.1 for tolerance) is considered a multi-collinearity signal, as shown in Table 3.
Table 3. Analysis data
|
Variable |
Estimate |
Std. Error |
t-value |
p-value |
VIF |
|
|
(Intercept) |
0.5735 |
0.2568 |
2.233 |
0.0319 |
|
* |
|
A |
-1.0205 |
0.1058 |
-9.644 |
0.0000 |
1.091 |
*** |
|
B |
2.0089 |
0.8836 |
2.274 |
0.0291 |
1.089 |
* |
|
C |
1.0464 |
0.1860 |
5.627 |
0.0000 |
1.043 |
*** |
|
Note: Multiple R-squared: 0.8303, Adjusted R-squared: 0.8161, F-statistic: 58.7 on 3 and 36 DF, p-value: 0.0000 |
||||||
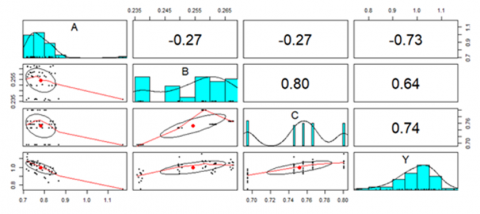
Figure 7. Correlation analysis
In Figure 7 for the correlation test, it is also seen that all independent variables have a strong correlation to the dependent variable. It can be seen that the correlation of the dependent variable (Y) to the independent variable (A) is significantly at -0.73, followed by the dependent variable (Y) to the independent variable (B) the significance is 0.64, and the last is the dependent variable (Y) show strong significance with the independent variable (C) of 0.74.
Using the coefficients of the Estimate column of Table 3, the multiple regression model equation finals is:
$\mathrm{Y}=0.5735-1.0205 \mathrm{~A}+2.0089 \mathrm{~B}+1.0464 \mathrm{C}$ (2)
Or
$\mathrm{Y}=0.5735-1.0205 \mathrm{X}_{1}+2.0089 \mathrm{X}_{2}+1.0464 \mathrm{X}_{3}$ (3)
4.4 Improvement
At this stage, the improvement activities are focused on finding preventive action on the potential failure of processes that have the highest RPN, as has been analyzed using FMEA where the potential for viscosity out of standards is caused by natural rubber viscosity variation between suppliers and conditions for the mixing process design (mixing time and stages process). is not appropriate to the viscosity level of the material. The improvement activities are carried out through the following stages, as seen in Figure 8.
Figure 8. Improvement stages
4.4.1 Determine the viscosity grade
The viscosity value is not a standard for raw material acceptance and is uncontrollable from suppliers. Therefore, control is carried out in the factory by testing the viscosity value by sampling two samples per post pallet containing 36 bale rubber (1,260 kg), and the natural rubber material grade will be classified based on the viscosity data obtained. The results of measurements of the viscosity of the natural rubber samples used in the mixing process are shown in Table 4.
Table 4. Viscosity natural rubber data
|
Grade |
Viscosity range |
Number of samples |
Ratio (%) |
|
A |
71-75 |
534 |
20.78 |
|
B |
76-80 |
1,331 |
51.79 |
|
C |
81-85 |
641 |
24.94 |
|
D |
86-90 |
64 |
2.49 |
|
Total |
2,570 |
100 |
|
4.4.2 Determine the design process
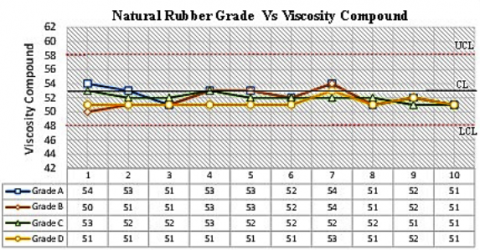
To determine the condition of the process capability, a simulation was carried out using each grade of natural rubber with the same process conditions. In this simulation, the process is carried out with a rotor rotation of 40 rpm, a pressure of 700 Kpa, a mixing time of 250 seconds, and the number of process stages 2.61. This simulation is carried out with a total of 10 samples for each grade of viscosity natural rubber, as shown in Figure 9.
Figure 9. Natural rubber viscosity simulation
This condition shows a strong correlation of the effect of natural rubber viscosity on the viscosity compound, and with the same mixing conditions, especially when using natural rubber grade A and D causes a defect to mismatch the value of viscosity compound, as shown in Figure 9. To obtain a stable viscosity compound value and reduce variation, improvements were made by making a different mixing process design according to the viscosity grade of natural rubber used. Furthermore, the poka-yoke system is made in the mixing process to facilitate material handling and the selection of the process design.
Figure 10. Mixing process design simulation
The results of the implementation of the design process through a simulation of the viscosity grade of natural rubber, as shown in Figure 10, show that the value of the viscosity compound using different viscosity grades is close to the center spec. It shows that the design process assigned to each viscosity grade gives better results in reducing variation.
4.4.3 Improve detection
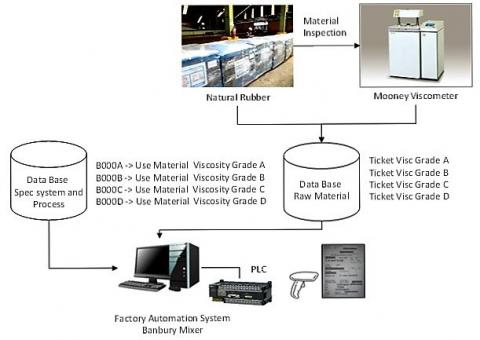
The suitability of the material's viscosity grade to the predetermined design process is a critical factor that determines the variation of the viscosity compound. errors caused by human factors during material handling and errors when determining the design process will cause the same potential failure to appear defect viscosity out standard. Therefore, Poka-yoke is made by integrating the raw material database with the database spec system which is connected automatically via barcode material and the process design settings on the machine. As shown in Figure 11, an illustrative explanation of the basic poka-yoke concept developed in the factory. for the next stage, updates are made to the FMEA, as shown in Table 5.
Figure 11. Integrating raw material database
Table 5. FMEA updating
|
Potential cause(s) of failure |
Current Process |
RPN |
Recommended action |
After improve |
RPN |
|||||
|
S |
O |
D |
Control prevention |
Control detection |
S |
O |
D |
|||
|
Variation Natural rubber viscosity from supplier |
6 |
5 |
6 |
180 |
Make grade classification for viscosity level and setup design process based on each grade |
Raw material inspection system with auto judgment |
6 |
4 |
1 |
24 |
|
Process design for each viscosity value has not been optimized |
6 |
5 |
6 |
180 |
Integrated poka-yoke barcode material with spec system |
6 |
4 |
1 |
24 |
|
|
Late spec maintain when a material change |
6 |
3 |
6 |
108 |
Make poka-yoke system integrated material barcode ticket and design process |
Integrated poka-yoke barcode material with spec system |
6 |
2 |
2 |
24 |
|
Less supply from compressors |
6 |
3 |
3 |
54 |
Increase pressure supply 75 to 80 Mpa |
Check sheet control, mixing chart, and alarm |
6 |
2 |
3 |
36 |
|
Cooling water pipes leak/ clogged |
6 |
2 |
3 |
36 |
Periodical check 1times/ Month |
Check sheet control, alarm abnormal Thermal control unit |
6 |
2 |
3 |
36 |
|
Control valve of Thermal Control unit broken |
6 |
2 |
3 |
36 |
Periodical check 1 times/ Month |
Check sheet control, alarm abnormal Thermal control unit |
6 |
2 |
3 |
36 |
|
Thermocouple position changed/ shifted |
6 |
1 |
2 |
12 |
Periodical check 1 times/ Month |
Check sheet control, alarm abnormal Temperature |
6 |
1 |
2 |
12 |
|
Thermocouple sensor damage/wornout |
6 |
1 |
2 |
12 |
Periodical check 1 times/ Month |
Check sheet control, alarm abnormal Temperature |
6 |
1 |
2 |
12 |
|
Load cell broken |
6 |
1 |
2 |
12 |
Weighing calibration as schedule, change when needed (broken) |
The alarm poka-yoke machine stop when weighing abnormal |
6 |
1 |
2 |
12 |
|
Incorrect setting parameter at weigher |
6 |
2 |
2 |
24 |
Weighing accuracy as schedule, reset parameter |
The alarm poka-yoke machine stop when weighing abnormal |
6 |
2 |
1 |
12 |
|
Initial load cell reading is not ‘Zero’ |
6 |
2 |
2 |
24 |
Zero reset program |
Alarm, poka-yoke zero-point permission, machine stop |
6 |
2 |
1 |
12 |
|
Cut gate is not tightly closed blocked by the crust |
6 |
1 |
6 |
36 |
Periodical check 1 times/ Month |
Check sheet control |
6 |
1 |
6 |
36 |
|
Vacuum dust collector is too big |
6 |
1 |
6 |
36 |
Periodical check 1 times/ Month |
Check sheet control |
6 |
1 |
6 |
36 |
The results of the improvements that have been made are then evaluated and entered into the FMEA table, the effect of decreasing the frequency of defect occurrences and increasing the level of detection is effective in reducing the RPN value from 240 to 24. These results indicate the level of risk of process failure caused by the influence of natural rubber variations between suppliers and the design mismatch is already low. Likewise for other variable factors, action has also been carried out and it shows an improvement in the value of the risk of failure.
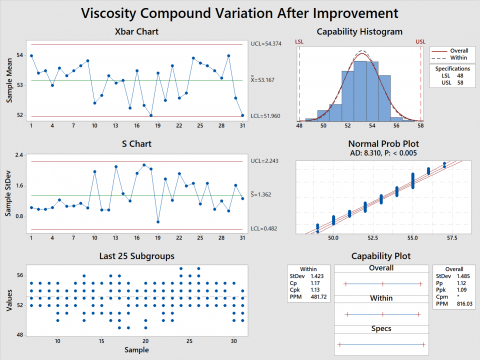
Furthermore, an evaluation of the effectiveness of the improvement results is carried out. The capability process of viscosity compound variation was increased with the value of Cp = 1.17, Cpk = 1.13, and Ppk = 1.09, which shows that the process is excellent good enough but still needs to be improved. Almost all data is included in the specification limit, as shown in Figure 12.
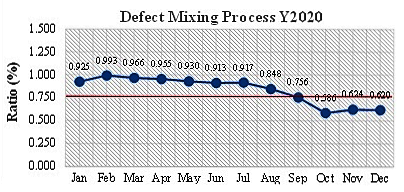
The increase in the value of the process capability carried out on the steel breaker compound on the viscosity of the item as an inspection parameter that contributes the most defects has an impact on the decrease in the defect ratio in the mixing process, as shown in Figure 13. Previously, as shown in Table 1, the average defect ratio from January 2020 to June 2020 of 0.947%. Based on data from the QC laboratory, the defect ratio condition that occurred in the mixing process at the end of the year was 0.62% and decrease by 34.5% compared to the previous condition.
Figure 12. Capability process viscosity steel breaker compound
Figure 13. Defect ratio graph
4.5 Control
In this last stage, product quality control is carried out using statistical process control (SPC) in the form of daily, weekly and monthly reports to determine the level of process stability. Monitoring is carried out on the consistency of the implementation of the improvement results that have been standardized at all stages of the process including the implementation of procedures, implementation of check sheet controls, and checking of the poka-yoke function. FMEA is a living document that is reviewed periodically to find solutions and predictions for the root problems that are currently or may occur in the production process so that improvement activities can be carried out continuously.
Analysis and defect improvement in the mixing tire manufacturing process was carried out. The method used in this study can assist in finding the root of the problem, testing the correlation between the causal factors and the main problem, and making recommended actions as a solution and prevention step for the occurrence of defects in the mixing process of the tire manufacturing process. The improvements that have been done can be effective in improving the capability process on steel breaker compound as the main problem that has an impact on decreasing defect ratio. In this study, improvements have been made on how to minimize variations in natural rubber material as the main component in the manufacture of steel breaker compounds by determining the process design based on the simulation results. To minimize process variation, in the next research, it is necessary to think about how to find a mathematical model formula for determining process design based on material capability by using the appropriate method.
The authors would like to express deepest gratitude and appreciation to all parties who have helped during this research, including the editors and reviewers.
[1] Andrzejewski, R., Awrejcewicz, J. (2005). Non-Linear Dynamics of a Wheeled Vehicle Advances in Mechanics and Mathematics. Springer Science+Business Media, Inc.
[2] Reportlinker. (2015). World Pneumatic Tire Market - Opportunities and Forecasts, 2014–2020. https://www.prnewswire.com/news-releases/world-pneumatic-tire-market---opportunities-and-forecasts-2014---2020-300142865.html, accessed on Jun. 05, 2021.
[3] Sahat, S.F. (2016). Tyre and Rubber. Ministry of Trade of The Republic of Indonesia. http://djpen.kemendag.go.id/app_frontend/admin/docs/publication/2901514957846.pdf.
[4] Arief, A.M. (2020). Pasar Otomotif Terperosok, Produksi Ban 2020 Mengempis. https://ekonomi.bisnis.com/read/20201022/257/1308379/pasar-otomotif-terperosok-produksi-ban-2020-mengempis, accessed on Jun. 05, 2021.
[5] Herlambang, H. (2020). Improving Process Capability of The Electronics Component Company Through SMED. http://publikasi.mercubuana.ac.id/index.php/ijiem.
[6] Sunadi, S., Purba, H.H., Hasibuan, S. (2020). Implementation of statistical process control through PDCA cycle to improve potential capability index of drop impact resistance : A case study at aluminum beverage and beer cans manufacturing industry in Indonesia. KVALITA INOVÁCIA PROSPERITA, 24(1). https://doi.org/10.12776/qip.v24i1.1401
[7] Herlambang, H., Purba, H.H., Jaqin, C. (2021). Development of machine vision to increase the level of automation in Indonesia electronic component industry. Journal Européen des Systèmes Automatisés, 54(2): 253-262. https://doi.org/10.18280/jesa.540207
[8] Rozak, A., Jaqin, C., Hasbullah, H. (2020). Increasing overall equipment effectiveness in automotive company using DMAIC and FMEA method. Journal Europeen des Systemes Automatises, 53(1): 55-60. https://doi.org/10.18280/jesa.530107
[9] Voehl, F., Harrington, J.H., Mignosa, C., Charron, R. (2014). The Lean Six Sigma Black Belt Handbook Tools and Methods for Process Acceleration. CRC Press Taylor & Francis Group, 2014.
[10] Pande, P.S., Neuman, R.P., Cavanagh, R.R. (2000). The Six Sigma Way How GE, Motorola, and Other Top Companies Are Honing Their Performance. McGraw-Hill New, 2000.
[11] Ranade, P.B., Ugale, P.J., Pagare, S.C., Pathade, T.R., Shende, D.S. (2019). Defect analysis and implementation of DMAIC methodology for defect reduction in tyre manufacturing. International Journal of Innovative Research in Applied Sciences and Engineering, 3(5): 479. https://doi.org/10.29027/ijirase.v3.i5.2019.479-482
[12] Gupta, V., Jain, R., Meena, M.L., Dangayach, G.S. (2018). Six-sigma application in tire-manufacturing company: a case study. Journal of Industrial Engineering International, 14(3): 511-520. https://doi.org/10.1007/s40092-017-0234-6
[13] Febriana, T.H., Herlambang, H., Hernadewita, Hasbullah, Halim, A. (2021). Problem-solving step analysis for increasing tire static balance levels : A case study. Jurnal Sistem dan Manajemen Industri, 5(1): 15-24. http://dx.doi.org/10.30656/jsmi.v5i1.3292
[14] Barbosa, B., Pereira, M.T., Silva, F.J.G., Campilho, R.D.S.G. (2017). Solving quality problems in tyre production preparation process: A practical approach. Procedia Manufacturing, 11: 1239-1246. https://doi.org/10.1016/j.promfg.2017.07.250
[15] Trimarjoko, A., Saroso, D.S., Purba, H.H., Hasibuan, S., Jaqin, C., Aisyah, S. (2019). Integration of nominal group technique, Shainin system and DMAIC methods to reduce defective products: A case study of tire manufacturing industry in Indonesia. Management Science Letters, 9(13): 2421-2432. https://doi.org/10.5267/j.msl.2019.7.013
[16] Stîngă, F., Severin, I., Mitrache, I.A., Lascu, E. (2020). Redesign of the curing area of the tire manufacturing process. Sustainability (Switzerland), 12(17). https://doi.org/10.3390/SU12176909
[17] Febriana, T.H., Hernadewita, Hermawan, C., Herlambang, H. (2020). Perbaikan ketahanan lifetime bladder untuk peningkatan curing efficiency pada proses industri tire manufacture. IJIEM (Indonesian Journal of Industrial Engineering & Management), 1(1): 33-44.
[18] Costa, T., Silva, F.J.G., Pinto Ferreira, L. (2017). Improve the extrusion process in tire production using Six Sigma methodology. Procedia Manufacturing, 13: 1104-1111. https://doi.org/10.1016/j.promfg.2017.09.171
[19] Kwag, S., Oh, J., Lee, J.M. (2018). Application of bayesian statistics to seismic probabilistic safety assessment for research reactor. Nuclear Engineering and Design, 328: 166-181. https://doi.org/10.1016/j.nucengdes.2018.01.022
[20] Saponara, S., Ciarpi, G., Fanucci, L. (2018). Failure analysis of plastic packages for low-power ICs. Applications in Electronics Pervading Industry, Environment and Society, Lecture Notes in Electrical Engineering, 429: 160-166. https://doi.org/10.1007/978-3-319-55071-8_21
[21] Xiao-Ping, B., Wei-Hua, S. (2017). Research on safety risk of dangerous chemicals road transportation based on dynamic fault tree and Bayesian network hybrid method. International Journal of Engineering, Transactions B: Applications, 30(8): 1144-1151. https://doi.org/10.5829/ije.2017.30.08b.05
[22] Mutlu, N.G., Altuntaş, S. (2020). Hazard and risk analysis for ring spinning yarn production process by integrated fta-fmea approach. Tekstil ve Konfeksiyon, 29(3): 208-218. https://doi.org/10.32710/tekstilvekonfeksiyon.482167
[23] Ruijters, E., Stoelinga, M. (2015). Fault tree analysis: A survey of the state-of-the-art in modeling, analysis and tools. Computer Science Review, 15: 29-62. https://doi.org/10.1016/j.cosrev.2015.03.001
[24] Kour, K.P., Talwar, L., Bhangu, N.S. (2019). Wind turbine reliability analysis in case of wind turbine blades. International Journal of Innovative Research in Science, Engineering and Technology, 8(10): 9922-9929. https://doi.org/10.15680/IJIRSET.2019.0810005
[25] Safira, D., Safitri, F., Kamal, H., Meilani, Sujana, C.M., Andika, A. (2020). Time accelaration of offshore EPC project using FMEA, FTA, CPM and crashing method at PT XYZ. IOP Conference Series: Earth and Environmental Science, 426(1). https://doi.org/10.1088/1755-1315/426/1/012126
[26] Aized, T., Ahmad, M., Jamal, M.H., Mahmood, A., Ubaid, S., Srai, J.S. (2020). Automotive leaf spring design and manufacturing process improvement using failure mode and effects analysis (FMEA). International Journal of Engineering Business Management, 12: 1-13. https://doi.org/10.1177/1847979020942438
[27] Mutlu, N.G., Altuntas, S. (2019). Risk analysis for occupational safety and health in the textile industry: Integration of FMEA, FTA, and BIFPET methods. International Journal of Industrial Ergonomics, 72: 222-240. https://doi.org/10.1016/j.ergon.2019.05.013
[28] Shanks, K., Hamad, A., Ameer, A. (2020). Failure modes effects and criticality analysis and fault tree analysis case study of waste heat recovery plant in a cement factory, United Arab Emirates. Journal of Failure Analysis and Prevention, 20(1): 40-50. https://doi.org/10.1007/s11668-020-00827-8
[29] Kwon, H.M., Hong, S.H., Lee, M.K. (2019). A risk metric for failure cause in FMEA under time-dependent failure occurrence and detection. The Korean Society for Quality Management, 47(3): 571-582. https://doi.org/10.7469/JKSQM.2019.47.3.571
[30] El-dogdog, T.M., El-assal, A.M., Abdel-aziz, I.H., El-betar, A.A. (2016). Implementation of FMECA and fishbone techniques in reliability centred. International Journal of Innovative Research in Science, Engineering and Technology, 5(11): 18801-18811. https://doi.org/10.15680/IJIRSET.2016.0511001
[31] Kusrini, E., Hanim, K. (2021). Analysis of compliance and supply chain security risks based on ISO 28001 in a logistic service provider in Indonesia. International Journal of Safety and Security Engineering, 11(2): 135-142. https://doi.org/10.18280/ijsse.110202
[32] Herlambang, H. (2020). Six sigma implementation in connector and terminals manufacturing company: A case study. Journal of Industrial Engineering and Management, 1(1): 1-11.
[33] Hasbullah, H., Mustarih, M.M., Wibowo, A.A. (2021). Improving material shortage for small-medium enterprises (Sme) in Pest Control Industry. Journal of Industrial, 2(3): 62-71. https://doi.org/10.7777/jiemar.v2i3