Ahmed Medjadji | Mohamed Mazari | Tayeb Kebir* | Azzeddine Belaziz
OPEN ACCESS
The fatigue lifetime predictions for semi-crystalline polymer, high density of polyethylene HDPE cases, is a new research problem, this work is focused on a simulation of the fatigue lifetime in PE100 pipes under internal pressure taking into account the influence of dimension parameters and internal pressures using the AFGROW software. Where, the developing numerical models gives an advantage of studying the problems more efficiently, since also very long-time processes can be simulated and analyzed in shorter times and different time frames of the process. The fracture m the service mechanics tools have been used to gain information on the resistance to crack growth. Furthermore, a fracture mechanics extrapolation procedure has been applied to predict the remaining fatigue lifetime of the pipes.
fatigue lifetime, PE100 pipes, high density of polyethylene HDPE
The High Density Polyethylene (HDPE) is one of the polymers most used in the industrial sector due to the diversity of applications and many advantages it has over other conventional materials. This material is used in the production of many types of piping systems (pipes and fittings), such as systems for water supply, gas distribution, irrigation, industrial facilities, sewer and wastewater. A piping system is subject to service conditions such as impact loads and fatigue as a consequence of internal pressure or external pressure fluctuations, and discontinuities in the design. As a result, it causes material damage, cracking and/or weakening [1-3]. Therefore, there are two basic failure modes of a pipeline system, first rapid crack propagation which could affect a significant length of pipeline, and second the long-time brittle failure of the system due to a slow crack growth initiated at a flaw in the pipe and resulting in local brittle failure [4-6]. The influence of stretching speed and strain rate on the behavior of the welded pipe HDPE are studied by Belaziz and Mazari [7]. Another, Haager et al. [8] are studied the experiments of fatigue crack growth (FCG) for evaluate the long term performance of pipe grade polyethylene (PE) with the parameters for the ranking tests were defined based on basic investigations of the influence of test frequency, R-ratio (Pmin/Pmax) and specimen configuration on FCG in polyethylene PE at room temperature. Also, the prediction of the remaining lifetime of polyethylene pipes after up to 30 years in use have been studied by Frank et al. [9]. The ductile fracture of HDPE pipes is characterized by a short crack that propagates rapidly perpendicular to direction of stretching (transversal), following the strong plastic deformation but in the regime fragile, the fracture is longitudinal of PE pipes occurs by slow crack propagation, see Figure 1 [5, 10].
Besides, the long-term failure behavior of pressurized PE pipes has been well investigated based on internal pipe pressure tests as well as on field failure [1, 4, 6, 11]. Also, the crack orientation (axial or circumferential) relative to the axis of the pipe and its location (internal or external) in the wall of pipe has a very significant effect on the crack growth and the failure of poly-ethylene pipe [12, 13].
Figure 1. Fracture of PE pipes under internal pressure, a) fracture ductile, b) fracture brittle [5]
The service life typically required and to be achieved covers a time span of up 50 years. It is clear that pressure pipe applications require polyethylene (PE) with very long lifetimes, but the problem is to develop a test that is able to estimate the lifetime in a relatively short time.
With the objective of ensuring sufficient lifetimes of such pressurized pipes, ISO 9080 classifies the materials by internal pipe pressure tests. Based on such tests, the minimum required strength (MRS) to ensure pipe lifetimes of at least 50 years is determined and results in a classification of the materials as PE 63 (MRS=6,3 MPa), PE 80 (MRS=8,0 MPa) or PE 100 (MRS=10,0 MPa) [14]. The range in failure cycle numbers at a reference load was determined from 281215 cycles for the PE 80 up to 1.188.036 cycles for the PE 100 [15].
The present work is a series of numerical simulations were performed to study the influence of a number of key parameters on the fatigue lifetime for specimen pipes made in polyethylene under internal pressure. These key parameters include the dimensions (thickness, size defect and inside diameter) and internal pressure.
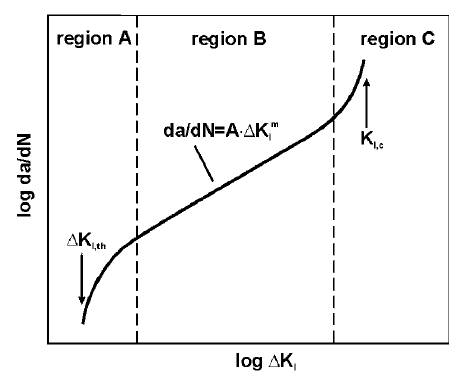
According to linear elastic fracture mechanics (LEFM), the fatigue crack growth (FCG) rate da/dN is expected to be a function of DKI which typically represents a shaped relationship in log-log scale. At very low loads σ the stress intensity factor is below a threshold KI,th which is too small for the initiation of the physical mechanisms which are responsible for slow crack growth. With increasing loads, the slow crack growth gets initiated and the crack growth rate yields into a linear region. This region of stable crack growth can be described by Eq. 1 which was originally proposed by Paris and Erdogan [6, 8, 16]. The resistance of a material against stress loaded rupture has been originally described by Griffith and is characterized by the fracture toughness KIC of a material.
Using these concepts, FCG rates da/dN may then be plotted as a function of the stress intensity factor range at the crack tip, DKI = Kmax ‒ Kmin, see Figure 2.
Figure 2. Schematic crack growth behavior of polymers under fatigue loads
On a double logarithmic scale, an extended linear section is frequently revealed for many plastics, indicating a power law relationship of the form:
$\frac{d a}{d N}=A(\Delta K)^{m}$ (1)
$\Delta K_{I}=\Delta \sigma \cdot \sqrt{\pi \cdot a} \cdot f(a / t)$ (2)
where, A and m are constants of material, which depend on the material as well as on test variables such as temperature, environment, frequency, stress ratio R and stress range ($\Delta$σ). The factor of correction geometric f(a/t) as a function of thickness (t) and crack length (a). However, this relationship Eq.1 generally holds true only over an intermediate range of crack growth rates. When investigating a wide range of da/dN, deviations from the power law may be observed as illustrated schematically in Figure 1. That is, crack growth rates in region A decrease rapidly to vanishingly small values as $\Delta$KI approaches the threshold value $\Delta$KI,th and they increase markedly in region C as $\Delta$KI approaches the material’s fracture toughness KI,C and crack propagation becomes unstable [6, 8, 16].
The calculation of the cycle that a crack needs to grow from an initial defect size until final failure is based on a transformation of Eq. 1. In this context, the cycle final Nf is an integral function of $\Delta$KI [6].
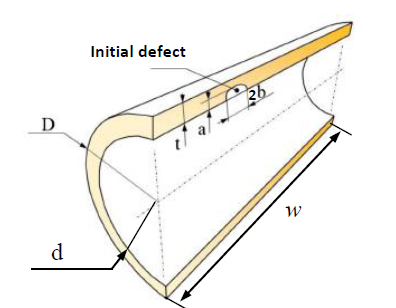
To simulate fatigue lifetime prediction of a pressured pipe with an initial defect, it is necessary to estimate life during the crack propagation. Therefore, finite element model of the structure with crack was suggested. The geometry of the structure is schematically shown in Figure 3. Where w is the width of specimen pipe must be constant for all simulation tests w=300mm, D is the outside diameter, d is the inside diameter, t is the pipe wall thickness, a is the transversal crack and b is the longitudinal crack. Furthermore, the Standard dimension ratio (SDR) is a method of rating a pipe's durability against pressure. The SDR is the ratio of the nominal outside diameter of a pipe to its nominal wall thickness D/t. The usual pipe SDRs used in practice are 9, 11, 13.6, 17.
Figure 3. Specimen of pipe with a surface crack at the inner pipe wall
In order to successfully simulate fatigue lifetime of prismatic specimens’ pipe were conducted under the rigid scheme of loading under constant stress range ($\Delta$σ) with a load ratio R=0.1.
For the PE100 pipes, the average value of the stress range that is determined with equation 3 according to the minimum required strength (MRS=10MPa).
$\Delta \sigma=\frac{\Delta P(D)}{t}$ (3)
where, $\Delta$P is internal pressure in bar.
The numerical simulations presented in this following work generates on AFGROW software developed by NASA [17], this software used for fatigue crack growth rate (FCGR) and/or fatigue lifetime simulation of different specimens’ geometries taking into account the different models of FCGR which have existed at his library. For these simulation tests we selected the specimen pipe (see Figure 3) with a factor of correction of geometry f(a/t) defined by equation 4.
$f(a / t)=\frac{1+2(a / t)}{(1-a / t)^{3 / 2}}$ (4)
And the Paris model (Eq. 1) when totality of fatigue crack growth curves is considered. For perform all simulations we introduced the material properties (see Table 1) of polyethylene PE100 in AFGROW software but the parameters geometries are dependent of each case that will be studied below.
In this study of simulation, we will be interested by the influence of different parameters on fatigue lifetime as the dimension’s parameters (thickness, initial defects and inside diameter of pipe) and the internal pressure. The fatigue lifetime predictions based on this model can be compared to real test data, if available.
Table 1. Mechanical properties of PE100
|
Paris coefficient A (m/cycle) at R=0.1 |
5.02E-5 |
[15] |
|
Paris exponent m at R=0.1 |
6.31 |
|
|
Fracture toughness KIC (MPa.m ½) |
0.68 |
|
|
Fracture threshold KI,th (MPa.m ½) |
0.21 |
|
|
Young Modulus E (MPa) |
1100 |
|
|
Yield stress σy (MPa) |
25 |
|
|
Ultimate stress σu (MPa) |
34 |
[18] |
|
Poisson's ratio, ν |
0.46 |
|
|
Density ρ (kg/m3) |
959 |
|
|
Expansion α (m/m K) |
2.10-4 |
[19] |
|
Elongation A% |
>600 |
[18] |
4.1 Internal pressure
For study the influence of internal pressure on the fatigue lifetime, we considered four values of pressures (P=9, 10, 11 and 12 bars). In this part, we found the SDR=11 (D=160 mm, t=14.54 mm) assuming an initial defect a=b=400µm. We introduced these parameters in AFGROW software. Initial defect was chosen based on recommendations in literature [15].
The Figure 4 represent the crack growth (a) as a function of number of cycle (N) for different values of internal pressures, we have remarked that when the crack growth increases the number of cycles increases. However, the total failure cycle numbers Nf=1138248 cycles found by simulation at an internal pressure P=10bar is compared to that obtained by experimental data [15] Nf=1188036 cycles shown a good agreement with an error e=0.04. The results for crack kinetics and fatigue lifetime predictions for pipe PE100 have already been published previously by the authors [4, 8, 14, 15, 20-24].
Moreover, in Figure 5, we have plotted the variation of internal pressure versus of cycles to failure (Nf). According to this figure the short fatigue lifetime is caused by the high internal pressure applied. We observed a stabilization of the lifetime for a pressure low than the value P=10 bars. Furthermore, that there is a critical internal pressure applied beyond which the fatigue lifetime decreases significantly. When the internal pressure applied of the pipe exceeds this critical pressure there it will be bursting. Several studies [1, 4, 6, 8-10, 20, 22, 23, 25] can be remarked the phenomena.
Figure 4. Evolution of crack growth as a function of number of cycles
Figure 5. Evolution of internal pressure as a function of number of cycles
4.2 Thickness
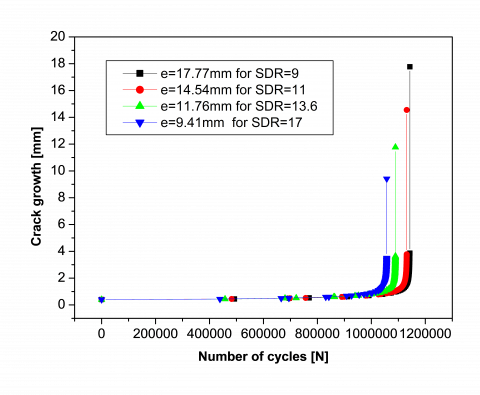
We considered by four different values of thickness (t=17.77, 14.54, 11.76 and 9.41 mm) with an outside diameter of specimen pipe D=160 mm taking into account the relationship of Standard Dimension Ratio (SDR=9, 11, 13.6 and 17). The initial defects size is constant a=b= 400 µm and introduced as well in AFGROW software.
The Figure 6 present the evolution of crack growth as a function of number of cycles which expresses the fatigue lifetime for different values of thickness (t) studied, that shows the total fatigue lifetime level decreases with decreasing sample thickness.
Furthermore, the Figure 7 shows the evolution of standard dimension ratio (SDR) as a function of number of cycles, we remarked that when the thickness (t) decreases then SDR increases, the crack growth to direction of thickness was propagated with a very speed which as the fatigue lifetime decreases. The analysis of the effect of the standard dimension ratio SDR are show by the authors [1, 8, 24, 26].
Figure 6. Crack growth as a function of number of cycles
Figure 7. Evolution of the ratio (SDR) versus of number of cycles
4.3 Initial defects size
In order to simulate the influence of initial defects size on the fatigue lifetime we have taken different ratios of crack transversal per longitudinal (a / b) which are presented in Table 2. According to the boundary condition of experimental data [15] we found the SDR 11 (D=160 mm, t = 14.54 mm) and internal pressure P = 10bar are introduced as well in AFGROW software.
Table 2. Different size defaults studies
|
Crack [µm] |
Ratio |
|
|
Transversal (a) |
Longitudinal (b) |
a/b |
|
160 |
400 |
0.4 |
|
200 |
400 |
0.5 |
|
240 |
400 |
0.6 |
|
280 |
400 |
0.7 |
|
320 |
400 |
0.8 |
|
360 |
400 |
0.9 |
|
400 |
400 |
1 |
After introducing these parameters in AFGROW software we have seen remarkable results as well plotted in Figure 8. It shows the evolution of ratio (a / b) as a function of number of cycles which can be observed that an increase of ratio (a/b) leads to a decrease the fatigue lifetime it shows that a semicircular crack is dangerous compared to a semielliptical crack in the pipe system. Good agreement between experimental observation of the crack shape published in the journals [12, 24].
Figure 8. The ratio (a/b) versus of number of cycles
4.4 Inside diameter
The inside diameter of pipe is an important parameter, we have studied different values of inside diameter (d=130, 132, 134 and 136 mm) with a constant thickness t=14.54 mm, internal pressure P=10 bars and initial defects size a=b=400 µm. All these parameters introduced to AFGROW software and treats for each case.
The Figure 9 presents the inside diameter of pipe versus number of cycles. It can be observed that increasing of inside diameter of pipe leads to an increase of the fatigue lifetime. In recent studies it has been demonstrated that there is a linear correlation between the inside diameter and the fatigue lifetime [14].
Figure 9. The inside diameter of pipe versus number of cycles
The objective of this study is to understand the fatigue lifetime for PE100 pipes under internal pressure. This study conducted as part of the application of fracture mechanics for prediction the fatigue lifetime using AFGROW software. At the end of numerical investigation, we can draw the following conclusions:
[1] Machado, R., Gonzalez, M., Gonzalez, J. (2013). Experimental study of crack growth in HDPE PE100 pipes. Proceedings of the ASME 2013 Pressure Vessels and Piping Conference PVP, Paris, France, pp. 1-7.
[2] Liu, H.T. (2007). Material Modelling for Structural Analysis of Polyethylene. Waterloo, Ontario, Canada., 2007.
[3] Bourchak, M., Aid, A. (2017). PE-HD fatigue damage accumulation under variable loading based on various damage models. Express Polym. Lett., 11(2): 117-126, https://doi.org/10.3144/expresspolymlett.2017.13
[4] Nezbedova, E., Hutar, P., Sevcik, M., Nahlik, L., Knesl, Z. (2010). Lifetime prediction of HDPE pipes grade. Eur. Conf. Fract., pp. 1-9.
[5] Julien, C. (2005). Sur le compromis rigidité / durabilité du Polyéthylène Haute Densité en relation avec la structure de chaîne , la microstructure et la topologie moléculaire issues de la Sommaire, Techniques.
[6] Frank, A., Berger, I.J., Arbeiter, F., Hutař, P., Pinter, G. (2016). Lifetime prediction of PE100 and PE100-RC pipes based on slow crack growth resistance. Proceedings of the 18th Plastic Pipes Conference PPXVIII, pp. 1-11.
[7] Belaziz, A., Mazari, M. (2018). Experimental study of the weld bead zones of a high-density polyethylene pipe (HDPE). J. Fail. Anal. Prev., 18(3): 667–676. https://doi.org/10.1007/s11668-018-0462-0
[8] Haager, M., Pinter, G., Lang, R.W. (2006). Ranking of PE-HD pipe grades by fatigue crack growth performance. Plastics Pipes XIII, Washington, pp. 1-11.
[9] Frank, A., Pinter, G., Lang, R.W. (2009). Prediction of the remaining lifetime of polyethylene pipes after up to 30 years in use. Polym. Test., 28(7): 737-745. https://doi.org/10.1016/j.polymertesting.2009.06.004
[10] Murariu, A.C., Safta, V.I., Mateiu, H.S. (2010). Long-term behaviour of polyethylene PE 80 pressurized pipes, in presence of longitudinal simulated imperfections. Mater. Plast., 47(3): 263-266.
[11] Djebli, A., Bendouba, M., Aid, A., Talha, A., Benseddiq, N., Benguediab, M. (2015). Fatigue life prediction and damage modelling of high-density polyethylene under constant and two-block loading. Procedia Eng., 101(C): 2-9. https://doi.org/10.1016/j.proeng.2015.02.002
[12] Benhamena, A., Bachir Bouiadjra, B., Amrouche, A., Mesmacque, G., Benseddiq, N., Benguediab, M. (2010). Three finite element analysis of semi-elliptical crack in high density poly-ethylene pipe subjected to internal pressure. Mater. Des., 31(6): 3038-3043. https://doi.org/10.1016/j.matdes.2010.01.029
[13] Bendouba, M., Djebli, A., Aid, A., Benseddiq, N., Benguediab, M. (2015). Time-dependent J-integral solution for semi-elliptical surface crack in HDPE, C. Sci. Press, 45(3): 163-186.
[14] Kratochvilla, T.R., Frank, A., Pinter, G. (2014). Determination of slow crack growth behaviour of polyethylene pressure pipes with cracked round bar test. Polym. Test, 40: 299-303. https://doi.org/10.1016/j.polymertesting.2014.10.002
[15] Frank, A., Arbeiter, F.J., Berger, I.J., Huta, P., Náhlík, L., Pinter, G. (2019). Fracture mechanics lifetime prediction of polyethylene pipes. J. Pipeline Sys., 10(1): 1-14. https://doi.org/10.1061/(ASCE)PS.1949-1204.0000356
[16] Pinter, G., Haager, M., Balika, W., Lang, R.W. (2005). Fatigue crack growth in PE-HD pipe grades. Plast. Rubber Compos., 34(1): 25-33. https://doi.org/10.1179/174328905X29758
[17] Harter, J.A. (1999). AFGROW Users Guide and Technical Manual. Version ADA370431, Air Force Research Laboratory.
[18] Alimi, L., Ghabeche, W., Chaoui, W., Chaoui, K. (2012). Mechanical properties study in extruded HDPE-80 pipe wall used for natural gas distribution. Matériaux Tech., 100: 79-86.
[19] Hanane, Z. (2014). Etude de la fissuration des canalisations en polyéthylènes haute densité. Thèse Master, USTO, Algérie.
[20] Oliphant, K., Conrad, M., Bryce, W., Eng, P. (2012). Fatigue of plastic water pipe: A technical review with recommendations for PE4710 pipe design fatigue. American Society of Civil Engineers, Pipelines Conference 2012.
[21] Mikula, J. (2015). Fracture behavior of welded polyolefin pipes. master’s thesis. Brno: Brno University of Technology, Faculty of Mechanical Engineering, Institute of Solid Mechanics, Mechatronics and Biomechanics, 2015.
[22] Frank, A., Berger, I.J., Arbeiter, F., Pinter, G. (2014). Characterization of crack initiation and slow crack growth resistance of Pe 100 and Pe 100-Rc pipe grades with cyclic cracked round bar (CRB) tests. Proc. 17th Plastic Pipes Conf. XVII, Chicago, Illinois, USA, pp. 1-10.
[23] Luo, W.B., Liu, Y.P., Yin, B.Y., Li, Y., Liu, X. (2018). Creep lifetime assessment of pressure-tight Pe100 pipes based on a slow fatigue crack growth. Strength Mater., 50(5): 781–787. https://doi.org/10.1007/s11223-018-0023-5
[24] Hutař, P., Ševčík, M., Náhlík, L., Pinter, G., Frank, A., Mitev, I. (2011). A numerical methodology for lifetime estimation of HDPE pressure pipes. Eng. Fract. Mech., 78(17): 3049-3058. https://doi.org/10.1016/j.engfracmech.2011.09.001
[25] Ulmanu, V., Draghici, G., Aluchi, V. (2011). Fracture mechanics testing of high density polyethylene (HDPE) pipe material with compact tension (CT) specimens. J. Eng. Stud. Res., 17(3): 98-103.
[26] Balika, W., Pinter, G., Lang, R.W. (2006). Fatigue crack growth and process zone development in a PE-HD pipe grade in through-thickness direction. Adv. Eng. Mater., 8(11): 1146-1150. https://doi.org/10.1002/adem.200600137