Imam Basuki![]()
© 2025 The author. This article is published by IIETA and is licensed under the CC BY 4.0 license (http://creativecommons.org/licenses/by/4.0/).
OPEN ACCESS
This study evaluates the operational cost efficiency and environmental implications of transitioning from diesel to electric buses, using the Trans Jogja public transport system in Indonesia as a case study. Employing a total cost of ownership (TCO) framework and emissions analysis, the study compares the financial performance and greenhouse gas (GHG) emissions between diesel and battery electric buses. Results show that electric buses incur approximately 50% higher operating costs, primarily due to elevated capital expenditures and depreciation. Moreover, under Indonesia's coal-dominated electricity grid, electric buses generate higher indirect CO₂ emissions than their diesel ones, highlighting a critical energy-emission paradox. However, electric buses eliminate tailpipe pollutants such as NOx and PM2.5, offering considerable public health benefits. A systemic scenario analysis reveals that full fleet electrification without concurrent reform in the energy sector could raise annual emissions by over 2,200 tons. The study identifies key barriers—including high upfront costs, limited charging infrastructure, and regulatory misalignment—and proposes phased policy interventions. Recommendations include targeted subsidies, contract revisions, integration with renewable energy, and technical capacity-building. The findings offer valuable insights for Indonesian cities seeking to scale sustainable urban mobility through electric transportation.
electric bus, diesel bus, total cost of ownership, carbon emissions, grid electricity, urban transport, public policy, Indonesia
Estimates suggest that transportation accounts for approximately 25% of global anthropogenic carbon dioxide (CO₂) emissions [1, 2]. In addition to CO₂, fossil-fuel-powered vehicles release harmful pollutants such as nitrogen oxides (NOₓ) and fine particulate matter (PM2.5), which deteriorate urban air quality and pose serious public health risks [3, 4].
In Indonesia, the transport sector contributes about 16.4% of the nation’s total CO₂ emissions, making it a significant emitter within the energy subsector [5]. In 2016, Indonesia accounted for 1.41% of global CO₂ emissions and ranked as the highest emitter among ASEAN countries [6]. Rapid urbanization and growing reliance on motorized vehicles have intensified energy efficiency challenges and air pollution in cities. Therefore, adopting low-carbon technologies and developing sustainable transport systems have become increasingly urgent.
To address these challenges, the Indonesian government has introduced a series of national policies, including Presidential Regulation No. 55/2019, which supports the acceleration of battery electric vehicle (BEV) adoption [7]. This policy aims to promote energy efficiency and reduce emissions by encouraging the deployment of electric vehicles across both private and public transportation sectors. Major cities, such as Jakarta, have responded by setting a target of deploying over 10,000 electric buses by 2030 [8].
However, challenges remain concerning high initial investment costs, limited charging infrastructure, and continued reliance on coal-fired power plants (CFPPS) for electricity generation. As of mid-2024, Indonesia's installed power generation capacity reached 93 GW, with 85% sourced from fossil fuels. PLTUs alone contribute 53%, while renewable energy sources, primarily hydropower and bioenergy, account for only 15%. This energy mix illustrates a critical dilemma: Although electric buses eliminate tailpipe emissions, they still produce substantial indirect emissions when powered by coal-based electricity [9].
Coal-fired plants emit approximately 1.075 kg of CO₂ per kilowatt-hour of electricity generated [10, 11]. Consequently, integrating transport electrification into broader energy transition strategies is essential to maximise environmental benefits and ensure their full realisation.
Trans Jogja, established in 2008, is Yogyakarta's primary public transport system and operates under a government-funded "buy-the-service" model. The system currently runs 128 buses (116 in operation and 12 held in reserve), positioning it as a potential frontrunner in public transport electrification among medium-sized cities. Empirical evidence suggests that bus fleet electrification could deliver 33-65% reductions in greenhouse gas emissions over a 10-14-year period, depending on the clean energy mix and implementation speed. When combined with cleaner power generation, such electrification efforts could also reduce local pollutants (NOₓ, CO, VOCS, and PM2.5) by over 80%, significantly improving urban air quality and public health outcomes [12-14].
In addition to environmental benefits, electric buses offer several operational advantages, including higher energy efficiency, approximately 25% lower maintenance costs compared to diesel buses, and reduced noise pollution [15, 16]. Nonetheless, widespread adoption remains constrained by high capital costs, battery-related limitations, and inadequate charging infrastructure.
This study seeks to:
The study further includes assessing charging infrastructure requirements, fleet reserve needs, and total cost of ownership (TCO) to ensure reliable and sustainable public transportation. The findings are intended to guide local and national policy decisions and offer a scalable model for other Indonesian cities pursuing transport electrification.
Transport electrification has emerged as a promising strategy to address the dual challenges of urban air pollution and climate change. However, assessing the viability and effectiveness of electric bus adoption requires a comprehensive understanding of environmental and economic aspects. This literature review provides the theoretical foundation and empirical references for the study's analytical framework. This literature review structures the discussion into four main sections: greenhouse gas (GHG) emissions from transportation, electricity grid emissions, operational cost frameworks, and enabling policy environments for public transport electrification. Each section synthesises relevant findings from international and local sources, offering a contextual basis for evaluating Indonesia's public transport transition.
2.1 Transportation and GHG emissions
Road-based transport is a major contributor to GHG emissions, particularly in developing economies with rising vehicle ownership. This section explores the emission characteristics of conventional diesel buses and compares them with electric bus systems. It distinguishes between direct and indirect emissions to highlight the importance of grid decarbonisation in amplifying the climate benefits of electric mobility.
2.1.1 Diesel bus emissions: CO₂, NOₓ, and PM2.5
Road transportation is one of the major contributors to greenhouse gas (GHG) emissions that drive climate change. Diesel-powered buses release carbon dioxide (CO₂) through fuel combustion, along with nitrogen oxides (NOₓ) and fine particulate matter (PM2.5), all of which significantly degrade air quality and pose risks to human health [17, 18]. Both NOₓ and PM2.5 have been directly linked to chronic respiratory diseases, lung cancer, and cardiovascular disorders.
In large urban centres such as Jakarta, Yogyakarta, and Surabaya, emissions from motorised vehicles have become the primary leading source of local air pollution [19, 20]. The resulting socio-economic impacts include environmental degradation, rising healthcare costs, and declining labour productivity.
CO₂ emissions from diesel buses can be calculated using the following standard formula:
$E_{\mathrm{CO}_2}={FC} \times {EF}_{\mathrm{CO}_2}$ (1)
where,
Here, the factor 2.68 kg CO₂ per litre represents the CO₂ released from the complete combustion of one litre of diesel. This factor is based on stoichiometric calculations, considering the carbon content of diesel fuel and the molecular weight ratio of CO₂ to elemental carbon. It is internationally recognised and adopted by institutions such as the U.S. Environmental Protection Agency (EPA), the Intergovernmental Panel on Climate Change (IPCC), and the Ministry for the Environment of New Zealand.
This emission factor provides a practical basis for calculating direct CO₂ emissions from diesel bus operations over any distance or operational cycle [21].
2.1.2 Emission reduction potential of electric buses and grid challenges
Battery Electric Buses (BEBs) offer significant potential to reduce local emissions because they produce no tailpipe emissions during operation. The absence of tailpipe emissions makes BEBs highly suitable for densely populated urban areas that demand cleaner air and quieter transportation solutions [22]. However, although BEBs operate as zero-emission vehicles at the point of use, they still generate indirect emissions, which vary depending on the carbon intensity of the electricity used for charging. In Indonesia, the national grid remains dominated by coal-fired power plants, with an average emission intensity of approximately 1.075 kg CO₂ per kilowatt-hour (kWh) of electricity generated [10, 11].
To estimate the indirect CO₂ emissions of electric buses, the following formula is applied:
$E_{\mathrm{CO}_2}=E C \times E F_{\text {grid }}$ (2)
where,
Using a typical energy consumption rate of 1.2 kWh per kilometre (a conservative value based on international studies for mid-sized electric buses operating under urban stop-and-go conditions) the estimated indirect CO₂ emissions are:
$1.2 \times 1.075=1.29 \mathrm{~kg}\, \mathrm{CO}_2 / \mathrm{km}$
Although BEBs may not consistently outperform diesel buses in terms of CO₂ emissions when powered by high-carbon electricity, their long-term environmental benefits depend significantly on the decarbonisation of the national grid. Under Indonesia’s current electricity mix, electric buses may emit more CO₂ annually than their diesel buses. Therefore, transport electrification strategies must be tightly integrated with national energy transition policies, primarily through the accelerated deployment of renewable energy sources such as solar, hydro, and wind.
Despite these challenges, BEBs offer substantial advantages in eliminating local pollutants such as NOₓ and PM2.5. For instance, a study conducted in Cluj-Napoca, Romania, found that replacing 41 Euro-3 diesel buses with electric buses reduced annual CO₂ emissions by 668 tons and NOₓ emissions by 6.41 tons [23]. These results highlight the considerable air quality benefits of adopting electric buses, even in contexts where electricity decarbonisation is still in progress.
2.2 Electricity from fossil-based power plants
Electricity generation plays a decisive role in shaping the overall environmental impact of electric vehicles, particularly regarding indirect emissions. Although electric buses (EBS) do not emit greenhouse gases during operation, emissions still occur at the power generation stage, especially in countries where the electricity grid is predominantly powered by fossil fuels such as coal, oil, and natural gas. Therefore, to fully assess the environmental benefits of electric buses, it is essential to consider the carbon intensity of the electricity that powers them.
2.2.1 Fossil fuel consumption and CO₂ emissions in power generation
Coal-fired power plants (CFPPS) dominate electricity generation in many developing countries. In India, for example, coal accounts for approximately 77% of total electricity production [24]. These plants are among the most significant industrial contributors to carbon dioxide (CO₂) emissions due to the high carbon content of coal. In countries utilising low-grade coal, the power plant efficiency is further reduced, resulting in higher CO₂ emissions per kilowatt-hour (kWh) of electricity produced. Burning approximately 0.43 kg of coal to generate 1 kWh of electricity can release up to 1.075 kg of CO₂, depending on the coal's carbon content and the efficiency of combustion technology used [25, 26].
In Indonesia, coal-fired power plants remain the cornerstone of electricity production. As of mid-2024, they accounted for 53% of the country's 93 GW installed generation capacity, equivalent to 49.8 GW. The calorific value of Indonesian coal varies widely (ranging from 4,500 to 6,000 kcal/kg), directly affecting emission outputs—lower calorific value coal requires greater input volume, thereby increasing CO₂ emissions.
Given that electric buses consume an average of 1.2 kWh per kilometre, and the national grid has an emission intensity of 1.075 kg CO₂ per kWh, the estimated indirect emissions per kilometre are:
$1.2 \times 1.075=1.29 \mathrm{~kg} \,\mathrm{CO}_2 / \mathrm{km}$
On an annual basis, assuming an operational distance of 82,125 km per bus, total indirect emissions amount to:
$1.29 \times 82,125=105.9$ tons $\mathrm{CO}_2$ per year
These values serve as baseline reference figures derived from secondary sources and are used to contextualise the findings in the subsequent discussion in Section 4.
2.2.2 Challenges in reducing indirect emissions
Although electric buses generate no tailpipe emissions during operation, the electricity used to power them often originates from fossil-based power plants, particularly in countries with carbon-intensive grids. Numerous studies have shown that in systems dominated by coal and natural gas, the life cycle greenhouse gas (GHG) emissions of electric vehicles may approach—or even exceed—those of conventional diesel vehicles [27-29]. Such emission dynamics make the carbon footprint of electric mobility highly dependent on the structure and decarbonization level of national power systems.
Therefore, diversifying the electricity mix is a critical strategy for reducing indirect emissions. It involves increasing the proportion of renewables, such as solar, wind, and hydro, in the national energy systems. A cleaner grid improves the environmental performance of electric vehicles and ensures the long-term sustainability of electrified transport initiatives.
Several countries have committed to ambitious renewable energy targets for their broader energy transition strategies. Such commitments are crucial for realizing the full environmental benefits of electric public transport. Moreover, emerging technologies such as carbon capture and storage (CCS) can mitigate emissions from fossil-based power plants. However, the widespread adoption of CCS remains limited due to high capital costs, technological barriers, and regulatory uncertainty [30-32].
Therefore, while transport electrification is essential to sustainable urban mobility, its environmental success ultimately hinges on parallel progress in decarbonizing electricity generation. Without this alignment, the environmental benefits of electric buses may remain limited by upstream emissions.
2.3 Operational cost analysis
Transitioning to electric buses not only raises questions of environmental impact but also demands a thorough understanding of financial implications. The operational cost of electric buses differs substantially from those of conventional diesel buses in terms of capital investment, energy expenses, maintenance costs, and depreciation. Therefore, a comprehensive assessment of operational costs is essential for evaluating the economic viability of electrification in public transportation systems.
2.3.1 Total cost of ownership (TCO)
The total cost of ownership (TCO) is a widely adopted framework for comparing the economic performance of diesel and electric buses over their whole service life. TCO calculations include capital expenditures (Capex), daily operational costs, routine maintenance, and the replacement of key components. While electric buses generally have higher initial costs, several studies indicate that over a 10- to 15-year lifecycle, electric buses can achieve a 10-15% lower TCO compared to diesel buses, primarily due to higher energy efficiency and reduced maintenance requirements [33].
Electric buses operate on simpler drivetrains (lacking internal combustion engines and multi-speed transmissions), reducing mechanical complexity and lowering the risk of breakdowns. Maintenance costs may be up to 25% lower for electric buses, and regenerative braking systems extend the lifespan of brake components. A Life Cycle Cost (LCC) analysis over a 25-year horizon shows that electric buses can reduce total cost by 5-10% relative to diesel buses. However, these advantages are more pronounced where public policy offers supporting incentives, including purchase subsidies, tax exemptions, energy pricing regulations, and investment in charging infrastructure [34, 35].
The total cost of ownership per kilometres (TCO/km) is calculated using Eq. (3):
$\frac{T C O}{{km}}=\frac{(A F C+A V C)}{A D T}$ (3)
where,
This study applies the TCO framework to assess the financial performance of diesel and electric bus fleets operating under the same service conditions.
2.3.2 Cost efficiency studies in developing countries
In developing countries, cost efficiency remains a key concern when adopting electric buses. Several studies highlight the potential for long-term savings when electric buses are deployed under appropriate policy and financial conditions. For example, life cycle analyses in India indicate that electric buses can achieve a 5-10% lower TCO than diesel buses. However, findings vary significantly across Southeast Asia. Unlike Singapore, most ASEAN cities still report higher TCO for electric buses, primarily due to elevated capital costs, inadequate tax incentives, and relatively high electricity tariffs [36, 37].
Singapore serves as a noteworthy exception. Its progressive fiscal policies and robust transport governance have made electric buses financially viable. Incentives such as reductions in the Additional Registration Fee (ARF), road tax exemptions, and Early Adoption EV programs contribute to a cost structure in which electric buses outperform diesel alternatives over time.
Another advantage of electric buses is their reduced maintenance needs. Electric drivetrains eliminate the need for engine oil, air filters, and transmission fluid. Moreover, regenerative braking reduces wear on brake pads, extending their lifespan. These factors can lead to 20-30% maintenance savings depending on usage patterns.
Nonetheless, a significant barrier to adoption remains the high upfront cost. Electric buses typically cost 1.5 to 2 times more than diesel units. As a result, policy mechanisms such as innovative financing models (e.g., leasing schemes or Battery-as-a-Service), targeted subsidies, and fiscal incentives are essential to promote the transition, particularly in cities with limited fiscal capacity.
These insights underscore the importance of designing holistic support frameworks that combine financial, technological, and institutional interventions to ensure the economic feasibility of electric public transport in emerging economies.
2.4 Electrification policies for public transport
The success of transport electrification initiatives depends not solely on vehicle technology but also on strong policy support, regulatory clarity, and cross-sectoral coordination. This section reviews Indonesia's national and subnational policy landscape and international case studies illustrating how policy interventions can accelerate the transition to electric public transport.
2.4.1 National and local policies in Indonesia
The Indonesian government has signalled strong support for transport electrification through Presidential Regulation No. 55 of 2019, which mandates accelerating the development and adoption of battery electric vehicles (BEV). The regulation aims to reduce GHG emissions, improve energy efficiency, and stimulate the domestic electric vehicle industry. This policy was further strengthened by Presidential Instruction No. 7 of 2022, which requires government institutions—both national and local—to use BEVS in their operational fleets [38].
At the municipal level, the Provincial Government of DKI Jakarta has set a target of complete electrification of the Trans Jakarta fleet by 2030. Governor's Decree No. 1053 of 2022 outlines a roadmap for implementation and provides non-fiscal incentives, such as route prioritisation and terminal fee reductions, to encourage electric bus adoption [39].
Outside the capital, electrification progress remains limited and is mainly confined to pilot programs. For instance, the early-stage deployment of electric buses in Yogyakarta illustrates the potential but also highlights the persistent challenges:
To scale up electric bus adoption in medium-sized cities, a more integrated policy approach is needed to connect transport strategies with energy planning within a robust institutional framework.
2.4.2 International case studies: Shenzhen and Singapore
Shenzhen, China, achieved full electrification of over 16,000 public buses in less than a decade, establishing itself as a global leader in electric public transport. This transformation was made possible through strong national policies, substantial government subsidies for fleet procurement and charging infrastructure, and well-coordinated institutional efforts between central and local governments. Shenzhen's local authorities offered operational support, while national policy ensured financial viability and long-term commitment to cleaner energy integration [40].
Singapore has also adopted an integrated approach to public transport electrification. Progressive taxation, high fossil fuel prices, and targeted incentives drive the city-state's strategy. These include reductions in the Additional Registration Fee (ARF), road tax exemptions, and the Electric Vehicle Early Adoption Incentive (EEAI). Such financial measures have made electric buses economically more attractive, enabling Singapore to become the only ASEAN country where electric buses currently exhibit a lower TCO than diesel alternatives [37].
Both case studies demonstrate that public transport electrification requires more than technological readiness—it depends critically on multi-sectoral policy alignment, financial support, and institutional collaboration. The Shenzhen model illustrates how scale and speed can be achieved with centralised planning and fiscal incentives, while Singapore highlights the importance of long-term regulatory and fiscal coherence in a liberal market context.
In line with global frameworks such as the International Association of Public Transport (UITP) and UN-Habitat's Urban Mobility Strategy, these case studies exemplify how electric bus adoption supports broader urban sustainability goals. These include reducing greenhouse gas emissions, improving air quality, and ensuring inclusive access to mobility. Accordingly, the literature reviewed in this chapter reinforces the understanding that transport electrification is not merely a technological upgrade but a core component of sustainable urban transformation that must be supported by coherent policy, planning, and financing systems.
3.1 Research design
This study adopts a case study approach and comparative analysis between electric and diesel buses operating within the Trans Jogja public transport system. The research evaluates operational cost efficiency, environmental impact (including direct and indirect emissions), and implementation challenges from technical and institutional perspectives. The study applies a quantitative-descriptive framework, using actual operational data, simulation, and relevant literature from national and international sources.
In addition, an evaluative framework supports assessing charging infrastructure needs (e.g., public electric vehicle charging stations) and their impact on the TCO.
This study does not perform formal hypothesis testing but focuses on real-world system representation and scenario-based assessments.
3.2 Data sources and types
This study utilizes a combination of primary and secondary data:
Primary Data:
Secondary Data:
While the operational data from PT AMI and the Yogyakarta Department of Transportation represent the current Trans Jogja system, they may not fully capture performance variations across all service corridors or future operational adjustments. This limitation is addressed by incorporating scenario-based projections and parameter ranges.
3.3 Analytical methods
3.3.1 Cost efficiency analysis (TCO)
The analysis calculates the TCO for diesel and electric buses. The TCO framework includes capital investment, energy consumption (litres/km versus kWh/km), routine maintenance costs, asset depreciation, and supporting infrastructure (charging stations). All fees are expressed in Indonesian Rupiah per kilometre (IDR/km) and analysed annually. To account for economic uncertainties, the study incorporates a simplified sensitivity analysis using three scenarios (base case, optimistic, and conservative) by adjusting key input variables such as fuel prices, electricity tariffs, and maintenance factors.
3.3.2 Emissions analysis
This component estimates direct emissions from diesel buses using standard emission factors (kg CO₂/litre). For electric buses, the analysis evaluates indirect emissions based on the national electricity grid’s carbon intensity (kg CO₂/kWh).
The analysis calculates annual CO₂ emissions per unit and totals them at the fleet level. In addition, the study compares local pollutants, such as NOₓ and PM2.5, using reference assumptions and secondary literature.
Sensitivity analysis is also applied to test how grid emission factors influence the relative environmental performance of electric buses.
3.3.3 Infrastructure and implementation assessment
The analysis estimates charging station requirements based on fleet size and operational schedules. It also calculates the number of reserve buses necessary to compensate for charging time constraints.
The analysis assesses institutional readiness and regulatory frameworks to determine their support for transitioning to electric buses.
Finally, the study provides policy recommendations for scalable and sustainable public transport electrification.
These recommendations are designed to align with Indonesia’s energy transition targets and international best practices.
4.1 Comparison of operational costs
Operational cost evaluation is essential to assess the economic efficiency between diesel and electric buses in the Trans Jogja public transport system. This analysis uses a cost-per-kilometre approach (IDR/bus-km), categorising the components into fixed and variable costs. The comparison provides a comprehensive overview of cost structures and the long-term saving potential for each type of service.
Table 1 presents a detailed breakdown of operational cost components per kilometre for three Trans Jogja service configurations: diesel, dedicated, and bulk-service electric buses.
Table 1. Operating cost comparison per bus-kilometre for Trans Jogja (in IDR/bus-km)
|
Component |
Diesel Bus |
Electric Bus–Dedicated Service |
Electric Bus–Bulk Service |
|
A. Fixed Costs |
|||
|
1. Vehicle depreciation |
1,898.76 |
4,691.00 |
4,691.00 |
|
2. Bank interest |
688.90 |
3,403.90 |
3,403.90 |
|
3. Vehicle tax |
39.39 |
2.49 |
2.49 |
|
4. Vehicle insurance |
66.68 |
698.06 |
698.06 |
|
5. Vehicle inspection (keur) |
2.07 |
2.44 |
2.44 |
|
6. Passenger insurance |
7.31 |
10.46 |
10.46 |
|
7. Bus crew cost |
3,590.78 |
2,745.60 |
2,745.60 |
|
8. Organda dues |
0.73 |
1.05 |
1.05 |
|
9. Route permit fee |
0.12 |
0.31 |
0.31 |
|
10. Terminal retribution |
36.35 |
642.71 |
642.71 |
|
11. Office staff cost |
1,061.14 |
1,654.33 |
1,654.33 |
|
12. Land and building tax (PBB) |
3.26 |
3.26 |
3.26 |
|
13. Office rental |
38.05 |
38.05 |
38.05 |
|
Total Fixed Costs (A) |
7,433.53 |
13,893.65 |
13,893.65 |
|
B. Variable Costs |
|||
|
1. Energy (fuel /electricity) |
1,581.40 |
1,203.02 |
517.19 |
|
2. Tires |
282.86 |
330.00 |
330.00 |
|
3. Maintenance |
841.43 |
620.45 |
620.45 |
|
4. Management cost |
90.66 |
17.43 |
17.43 |
|
5. Overhead and profit margin |
716.09 |
1,121.63 |
1,073.62 |
|
6. Corporate tax |
218.92 |
342.90 |
328.22 |
|
Total Variable Costs (B) |
3,731.35 |
3,635.42 |
2,886.91 |
|
Total Operating Cost (A + B) |
11,164.88 |
17,529.07 |
16,780.56 |
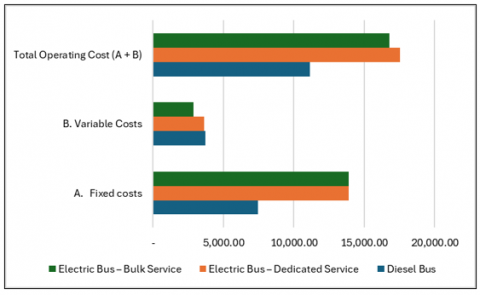
To provide a more precise comparison between the cost structures of each service mode, a bar chart is presented in Figure 1, showing the proportion of fixed and variable costs for each bus type. Figure 1 illustrates that diesel buses have a relatively balanced composition of fixed and variable costs, with a slight dominance in variable expenses such as fuel and maintenance. In contrast, dedicated-service electric buses dominate fixed costs, primarily driven by high depreciation and bank interest. Although the bulk electric buses offer better efficiency in energy consumption, fixed costs still account for most of their total cost. This visualisation reinforces that the main challenge in lowering the cost per kilometre of electric buses lies in capital structure and financing burden rather than daily operating expenses.
Figure 1. Comparison of fixed and variable cost components per bus type (diesel, electric dedicated, electric bulk) in Trans Jogja operations
The analysis from Table 1 shows that the total operational cost per kilometre for diesel buses is IDR 11,164.88, dedicated electric buses reach IDR 17,529.07, and bulk electric buses are slightly lower at IDR 16,780.56.
The most significant cost differences emerge from the fixed cost components:
In contrast, electric buses demonstrate greater efficiency in the variable cost category:
Therefore, although electric buses offer greater energy consumption and maintenance efficiency, their higher fixed costs due to investment and financing constraints keep their total per-kilometre cost less competitive. To address this challenge, electrification strategies should be accompanied by investment subsidies, revised service contracts, and innovative financing schemes that reduce fixed-cost burdens and support sustainable deployment of low-emission transport systems.
4.2 Emissions and environmental impact analysis
Electrifying the Trans Jogja bus fleet contributes to efforts to reduce greenhouse gas (GHG) emissions, particularly carbon dioxide (CO₂) and local air pollutants such as nitrogen oxides (NOₓ) and delicate particulate matter (PM2.5). This section comprehensively evaluates direct and indirect emissions to assess the environmental impact of electric buses.
4.2.1 Direct and indirect emissions
When evaluating the environmental impact of public transport electrification, it is essential to distinguish between direct emissions produced from the vehicle’s operation and indirect emissions originating from the energy generation processes that power the vehicles.
The direct emissions of diesel buses result from fuel combustion. Assuming an average fuel consumption of 0.4 litres per kilometre and an emission factor of 2.68 kg CO₂ per litre, the CO₂ emission per kilometre can be calculated using the following equation:
$\begin{aligned} E_{C O_2 \text { diesel }}=F C & \times E F=0.4 \times 2.68 =1.072 \mathrm{~kg} \,\mathrm{CO}_2 / \mathrm{km}\end{aligned}$
With an average annual mileage of 82,125 kilometres per unit, the total annual CO₂ emissions from a single diesel bus are:
$1.072 \times 82,125=88.1$ tons CO2/year
In contrast, electric buses do not produce tailpipe emissions during operation. However, they still contribute to indirect emissions depending on the carbon intensity of the electricity supply. Under current conditions in Indonesia, where coal-fired power plants still dominate the power grid, and with an energy consumption of 1.2 kWh per kilometre and an emission factor of 1.075 kg CO₂ per kWh, the calculation is:
$\begin{gathered}E_{C O_2 \text { electric }}=F C \times E F=1.2 \times 1.075 =1.29 \mathrm{~kg} \mathrm{CO}_2 / \mathrm{km}\end{gathered}$
Assuming the same annual mileage, the annual indirect emissions per electric bus are:
$1.29 \times 82,125=105.9$ tons $\mathrm{CO}_2 /$ year
The comparison of energy consumption and annual CO₂ emissions per unit is summarised in Table 2 below to provide a clear side-by-side view of both vehicle types.
Table 2. CO₂ emission comparison between diesel and electric
|
Parameter |
Diesel Bus |
Electric Bus (Coal-Based) |
|
Energy consumption |
0.4 litre/km |
1.2 kWh/km |
|
Emission factor |
2.68 kg CO₂/litre |
1.075kg CO₂/kWh |
|
CO₂ emission per km |
1.072 kg |
1.29 kg |
|
Annual CO₂ emission (per bus) |
88.1 tons CO₂ |
105.9 tons CO₂ |
The data clearly shows that, on a per-unit basis, electric buses, when powered by a coal-dominated energy grid, can result in higher CO₂ emissions than diesel buses to assess the full-scale impact on the system, it is essential to calculate total emissions based on the entire Trans Jogja fleet.
Trans Jogja currently operates 128 buses. If the entire fleet were diesel-powered, the total annual emissions would be:
$128 \times 88.1=11,266$ tons $\mathrm{CO}_2 /$ year
However, if the entire fleet were replaced with electric buses powered by coal-based electricity, the total indirect emissions would be:
$1128 \times 105.9=13,544$ tons $\mathrm{CO}_2 /$ year
This indicates that, under current energy mix conditions, full electrification of the Trans Jogja fleet could result in a net increase of 2,278 tons of CO₂ per year. This phenomenon is referred to in environmental policy literature as the rebound effect, where indirect emissions offset the expected benefits of electrification due to insufficient energy sector decarbonization.
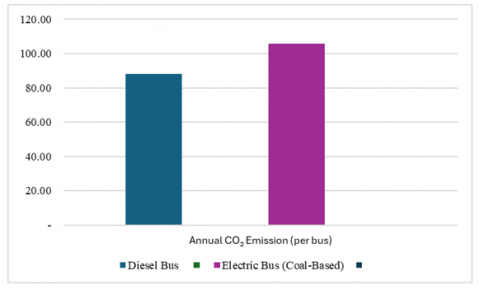
Figure 2 presents a visual comparison of total annual emissions across the two fleet scenarios. This highlights the systemic scale of the emissions difference and reinforces the conclusion that transport electrification cannot be assessed in isolation from the energy sector.
Figure 2. Comparison of annual CO₂ emissions per bus: diesel vs. electric (coal-based grid)
This analysis reinforces the argument that the environmental benefits of electric public transportation depend not only on the type of vehicle used but also on the carbon intensity of the electricity grid. For electrification to deliver system-wide emission reductions, it must be integrated with broader clean energy transition strategies.
This value exceeds the annual direct emissions from diesel buses (88.1 tons CO₂), reinforcing the concern that transport electrification—if pursued without simultaneous electricity sector reform—may paradoxically lead to higher total greenhouse gas emissions. This outcome, often referred to as a rebound effect in environmental policy literature, highlights the systemic risk of relying solely on tailpipe emission metrics.
To address this challenge, national energy strategies must prioritise the decarbonisation of the electricity grid by integrating renewable sources such as solar, wind, and hydropower. Only by aligning transport electrification with broader clean energy transitions can the full potential of electric public transport systems to reduce emissions be effectively realised.
4.2.2 Impact on local emissions and air quality
While electric buses may produce higher indirect CO₂ emissions under a coal-based electricity grid, they offer significant advantages in reducing local air pollutants, particularly nitrogen oxides (NOₓ), carbon monoxide (CO), volatile organic compounds (VOCS), and fine particulate matter (PM2.5). Pollutants linked to urban air pollution and adverse public health outcomes.
Based on findings from operational simulations and empirical studies in cities such as Cluj-Napoca (Romania) and Bogotá (Colombia), replacing diesel bus fleets with electric buses can reduce local air pollutant emissions, particularly NOₓ and PM2.5, by 30% to over 90%, depending on fleet characteristics and local traffic conditions. A similar impact is projected for the Trans Jogja system, especially along its most congested corridors such as Malioboro–Airport and Giwangan–Condong Catur, which currently experience high passenger volumes and traffic density [22, 41].
Numerous studies have demonstrated that improvements in air quality yield immediate and measurable public health benefits. Reductions in ambient air pollution have been associated with rapid respiratory symptom decline, hospital admissions, premature births, and overall mortality within weeks [42]. Evidence also suggests that meeting international air quality guideline targets, such as those issued by the World Health Organisation, could prevent a significant number of non-accidental deaths annually, particularly those related to cardiovascular and respiratory diseases [43].
In dense urban environments, adopting zero-emission buses can significantly reduce exposure to harmful pollutants such as NO₂ and PM2.5, especially among vulnerable groups, such as children and older people. The transition is anticipated to lower healthcare demand, reduce public health expenditures, and enhance overall productivity and life expectancy.
From a sustainability perspective, the transition to electric public transport aligns strongly with the United Nations Sustainable Development Goals (SDGS)—in particular, SDG 3 (Good Health and Well-being) and SDG 11 (Sustainable Cities and Communities). Therefore, even if the transition does not immediately reduce total CO₂ emissions are not immediately reduced, the local environmental and public health benefits justify the electrification of city bus fleets as a priority policy direction.
4.2.3 The role of energy transition in supporting electrification
The effectiveness of public transport electrification in reducing greenhouse gas (GHG) emissions critically depends on the national energy mix. As of 2024, Indonesia still relies on coal-fired power plants (PLTU) for approximately 53% of its installed power generation capacity, making indirect emissions from electric buses substantially high, even though they produce zero tailpipe emissions.
Thus, electrification strategies must be accompanied by a structural energy transition towards renewable sources such as solar, wind, and biomass. The General Plan for Electricity Supply (RUPTL) 2021–2030 targets a renewable energy share of 23% by 2025. However, progress remains slow, and coal dominance undermines the environmental gains from electrified transport.
This emission trade-off highlights a central paradox: while electric buses reduce local pollutants like NOₓ and PM2.5, leading to significant air quality improvements, their indirect CO₂ emissions may surpass those of diesel buses when powered by coal-heavy grids. Therefore, without decarbonising the power sector, the full environmental benefits of electrification will remain unattainable.
Regional evidence reinforces this interdependence; countries such as Vietnam and the Philippines have explicitly linked transport electrification policies with renewable energy investments, ensuring synchronised progress across the energy and transport sectors.
In the context of sustainable transport development, cross-sector integration becomes imperative. Electrification alone is insufficient. Institutional coordination between transportation agencies, energy authorities, and utility providers—particularly Perusahaan Listrik Negara (PLN), Indonesia’s State-Owned Electricity Company, and the Ministry of Energy and Mineral Resources—is essential to align technological deployment with low-carbon energy supply.
Furthermore, this transition must be guided by a long-term policy framework that addresses the concerns of key stakeholders, including bus operators, local governments, and urban communities. Financial and regulatory incentives should support vehicle procurement and charging infrastructure and accelerate renewable energy generation. Electrified public transport systems can only deliver systemic and enduring carbon intensity reductions.
This integrated approach aligns with the principles of sustainable mobility—resource efficiency, reduced environmental impact, and intergenerational equity—strengthening the case for coherent energy-transport planning in Indonesia’s urban development agenda.
4.3 Implementation challenges of electric buses
The electrification of public transport fleets, such as Trans Jogja, presents significant implementation challenges that span financial, technical, institutional, and societal dimensions. Foremost among these is the high capital expenditure required to procure electric buses, which leads to elevated depreciation and financing costs. Without targeted subsidies or alternative financing schemes, such as leasing models or battery-as-a-service, these upfront costs hinder wider adoption, particularly in resource-constrained cities.
Another key obstacle is the charging infrastructure. Expanding electric bus fleets demands extensive investment in land, grid capacity, and technical standards for interoperability. Coordinating with Indonesia's State Electricity Company (PLN) ensures grid readiness and service reliability. Delays in infrastructure rollout can limit route coverage and reduce operational flexibility.
Battery-related issues also pose long-term risks. Replacing battery packs after 6-8 years contributes significantly to lifecycle costs. Compounding this is the lack of domestic recycling infrastructure for lithium batteries, raising concerns over environmental sustainability and the absence of a circular economy framework. Furthermore, Indonesia's dependence on imported components exposes the electric bus ecosystem to global supply chain volatility and price fluctuations.
Institutionally, existing regulatory frameworks remain centred on diesel-based systems. Current procurement standards and contract models under the buy-the-service (BTS) scheme do not yet reflect electric fleets' operational characteristics and cost structure. This misalignment reduces the incentives for local governments and operators to transition.
Beyond infrastructure and policy, stakeholder engagement is equally essential. Public acceptance of electric buses, which are characterized by quieter operation and reduced pollution must be supported through awareness campaigns and user education. Operators need capacity-building programs to manage new technologies and maintenance regimes.
From a broader sustainability perspective, electrification should not be seen in isolation. Long-term environmental gains require aligning transport policy with national energy planning and urban development strategies. Exploring complementary pathways, such as hydrogen or bio-CNG, may further diversify Indonesia's decarbonization options while enhancing system resilience.
4.4 Policy implications
Practical electrification of Indonesia’s public transport systems—exemplified by the Trans Jogja case—requires a well-structured policy roadmap that aligns with fiscal constraints, institutional capacity, and local urban conditions. The following measures are proposed based on short-term feasibility and long-term sustainability:
a. Short-term priorities (0-3 years):
b. Medium-to-long-term priorities (3-10 years):
These recommendations are applicable to Yogyakarta and scalable to other Indonesian cities with similar transport dynamics. Secondary cities such as Surakarta, Semarang, and Denpasar, which operate medium-sized public bus fleets, may serve as logical next adopters. By embedding flexibility in policy design—allowing for regional adaptation and budget variations—Indonesia can create a replicable model for national electric mobility expansion.
Furthermore, policy coherence between the energy and transport sectors must be institutionalised through inter-agency coordination platforms and integrated planning frameworks. Without this alignment, electrification may proceed in silos, limiting systemic decarbonisation impacts.
4.5 Systemic projection: Full electrification scenario for the Trans Jogja fleet
To evaluate the broader implications of a complete transition from diesel to electric buses, this section presents a comparative simulation of two full-fleet configurations: (1) all 128 Trans Jogja buses remain diesel-powered, and (2) the entire fleet is electrified. The analysis uses actual unit cost and emission factors and uniform operational assumptions of 82,125 kilometres per bus annually.
4.5.1 Projected operating costs and emissions
Table 3 presents the projected total annual operating costs for each fleet type. Under current conditions, the electric bus fleet incurs significantly higher costs—IDR 176.2 billion compared to IDR 117.4 billion for the diesel fleet. This 50% cost increase is primarily due to elevated fixed costs such as vehicle depreciation, interest payments, and insurance premiums.
Meanwhile, Table 4 summarises the projected annual CO₂ emissions. Under a coal-dominated power supply, the electric fleet generates more emissions than the diesel fleet, 13,555.2 tons versus 11,276.8 tons. This counterintuitive result is a consequence of Indonesia’s carbon-intensive electricity grid, which relies heavily on coal.
Table 3. Projected annual operating costs
|
Bus Type |
Operating Cost per km |
Annual Distance per Bus (km) |
Total Number of Buses |
Total Operating Cost (IDR) |
|
Diesel Bus |
11,164.88 |
82,125 |
128 |
117,413,460,960 |
|
Electric Bus-Bulk |
16,780.56 |
82,125 |
128 |
176,157,948,480 |
Note: The cost for bulk-service electric buses reflects a more conservative estimate and represents the scenario more realistically than the premium-service variant
Table 4. Projected annual CO₂ emissions for 128-unit Trans Jogja fleet
|
Bus Type |
CO₂ Emission per Bus per Year (tons) |
Number of Buses |
Total Annual CO₂ Emissions (tons) |
|
Diesel Bus |
88.1 |
128 |
11,276.8 |
|
Electric Bus |
105.9 |
128 |
13,555.2 |
4.5.2 Systemic interpretation and trade-offs
The results present a crucial policy paradox: while electric buses eliminate local tailpipe emissions and offer public health advantages, they do not automatically reduce greenhouse gas emissions without a cleaner energy grid. Under current grid conditions, electrification yields higher CO₂ emissions, creating a climate trade-off despite air quality improvements.
Nevertheless, the health benefits from eliminating NOₓ and PM2.5 remain significant. Electric buses can substantially reduce exposure to respiratory pollutants in urban corridors, aligning with public health goals even when carbon emissions are not immediately reduced.
4.5.3 Applicability and scalability for other cities
These projections offer practical insights for other Indonesian cities considering large-scale electrification. Cities such as Semarang, Surakarta, and Denpasar—each with mid-sized public transport systems—can use these findings to anticipate cost and emission impacts. The comparative framework is adaptable across regions, provided that local electricity mixes and fiscal conditions are considered.
4.5.4 Sensitivity and future scenarios
This analysis assumes static cost and emission factors. In reality, technological and policy developments may significantly alter outcomes. Scenario-based sensitivity analyses—factoring in declining battery costs, changes in grid emission intensity, and supportive fiscal policies—are essential for future planning. For instance, reducing the grid emission factor below 0.7 kg CO₂/kWh could flip the emission balance in favour of electric buses, making them environmentally and economically advantageous.
This study investigated the operational cost efficiency, environmental impacts, and implementation challenges of transitioning from diesel to electric buses in Indonesia's public transport sector, using the Trans Jogja system as a case study. The results reveal a complex trade-off: although electric buses significantly improve energy efficiency and public health, their climate benefits remain constrained by Indonesia's fossil fuel-dependent electricity grid.
In terms of cost performance, electric buses currently incur approximately 50% higher operating costs than diesel buses, mainly due to higher capital investment, depreciation, and financing charges. The TCO analysis confirms that electric buses remain economically uncompetitive in the short term without fiscal support. Nevertheless, their superior energy and maintenance efficiency offer long-term savings potential, particularly under enabling regulatory and financial frameworks.
From an emissions perspective, electric buses eliminate tailpipe pollutants such as NOₓ and PM2.5, significantly improving urban air quality. However, indirect CO₂ emissions from coal-powered electricity can exceed those from diesel operation. The system-wide projection revealed that full electrification of the Trans Jogja fleet, without a corresponding energy transition, would increase total emissions by over 2,200 tons annually. This finding underscores the need to integrate transport electrification with decarbonisation of the national power grid to achieve comprehensive climate benefits.
The study also identified several critical barriers to implementation: high initial investment costs, insufficient charging infrastructure, limited battery lifecycle management, and a lack of regulatory alignment. Strategic interventions are needed to address these constraints and support a sustainable, large-scale shift to electric public transportation.
Key recommendations from the study include:
Finally, this study highlights the importance of future research involving scenario-based simulations and real-time grid data to assess electric buses' evolving cost and environmental performance. Replicating this analytical framework in other Indonesian cities can guide more region-specific strategies and support the creation of a scalable and inclusive national model for sustainable transport electrification.
|
BEB |
battery electric bus |
|
BTS |
buy the service scheme |
|
CO₂ |
carbon dioxide |
|
ESDM |
ministry of energy and mineral resources (Indonesia) |
|
GHG |
greenhouse gas |
|
km |
distance |
|
kWh |
energy consumption |
|
LCC |
life cycle cost |
|
NOₓ |
nitrogen oxides |
|
PBB |
land and building tax |
|
PLTU |
coal-fired power plant |
|
PM2.5 |
particulate matter < 2.5 microns |
|
Rp/km |
operational cost per kilometre |
|
TCO |
total cost of ownership |
|
VOC |
volatile organic compounds |
[1] Uddin, W. (2022). Mobile and area sources of greenhouse gases and abatement strategies. In Handbook of Climate Change Mitigation and Adaptation. Springer, Cham, pp. 743-807. https://doi.org/10.1007/978-3-030-72579-2_23
[2] Liu, Y.L., Tang, C.L., Zhou, A.Y., Yang, K. (2024). A novel ensemble approach for road traffic carbon emission prediction: A case in Canada. Environment, Development and Sustainability. https://doi.org/10.1007/s10668-024-04561-1
[3] Minet, L., Chowdhury, T., Wang, A., Gai, Y., Posen, I. D., Roorda, M., Hatzopoulou, M. (2020). Quantifying the air quality and health benefits of greening freight movements. Environmental Research, 183: 109193. https://doi.org/10.1016/j.envres.2020.109193
[4] Xiong, Y., Partha, D., Prime, N., Smith, S.J., Mariscal, N., Salah, H., Huang, Y.X. (2022). Long-term trends of impacts of global gasoline and diesel emissions on ambient PM2.5 and O3 pollution and the related health burden for 2000–2015. Environmental Research Letters, 17(10): 104042. https://doi.org/10.1088/1748-9326/ac9422
[5] Chairiawan, M.A. (2019). Indonesia opportunity to accelerate energy transition. In 2019 International Conference on Technologies and Policies in Electric Power & Energy, Yogyakarta, Indonesia, pp. 1-4. https://doi.org/10.1109/IEEECONF48524.2019.9102598
[6] International Energy Agency. (2018). World Energy Outlook 2018. https://iea.blob.core.windows.net/assets/77ecf96c-5f4b-4d0d-9d93-d81b938217cb/World_Energy_Outlook_2018.pdf.
[7] Presiden Republik Indonesia. (2019). Peraturan Presiden Republik Indonesia Nomor 55 Tahun 2019 tentang Percepatan Program Kendaraan Bermotor Listrik Berbasis Baterai untuk Transportasi Jalan. https://jdih.esdm.go.id/common/dokumen-external/Perpres%20Nomor%2055%20Tahun%202019.pdf.
[8] Riza, Zulramadhani, Nurhuda, M., Damara, D.R., Aji, P., Priandana, E.R. (2024). Study on power system of ev bus depot charging system and prospect for smart charging implementation. Evergreen, 11(3): 2774-2782. https://doi.org/10.5109/7236916
[9] KumparanBISNIS. (2024). Kapasitas pembangkit listrik terpasang di ri capai 93 GW per semester I 2024. https://kumparan.com/kumparanbisnis/kapasitas-pembangkit-listrik-terpasang-di-ri-capai-93-gw-per-semester-i-2024-23WP7p9777p/full.
[10] Triani, M., Anggoro, D.D., Yunianto, V.D. (2024). Potensi dekarbonisasi pembangkit listrik batubara melalui cofiring biomassa dan carbon capture utilization. METANA, 20(1): 57-68. https://doi.org/10.14710/metana.v20i1.63102
[11] Sethi, V.K., Sohani, S.K., Pippal, R.K.S., Samartha, M. (2022). Strategies of installation of a solar integrated carbon capture and sequestration (CCS) plant on a 500-MW size coal-fired thermal power plant in India. In International Conference on Trends and Recent Advances in Civil Engineering (TRACE 2022), Noida, India, pp. 351-358. https://doi.org/10.1007/978-981-99-1388-6_27
[12] Tian, X.L., Waygood, E.O.D., An, C.J., Chen, Z.K., Peng, H. (2023). Achieving urban net-zero targets through regionalized electric bus penetration and energy transition. Transportation Research Part D: Transport and Environment, 120: 103797. https://doi.org/10.1016/j.trd.2023.103797
[13] Zou, C., Wang, Y.N., Wu, L., He, J., Ni, J.W., Mao, H.J. (2024). Environmental benefits of pollution and carbon reduction by bus fleet electrification in Zhengzhou. Environmental Science, 45(3): 1293-1303. https://doi.org/10.13227/j.hjkx.202304156
[14] Martinez, S.S., Samaras, C. (2024). Electrification of transit buses in the United States reduces greenhouse gas emissions. Environmental Science & Technology, 58(9): 4137-4144. https://doi.org/10.1021/acs.est.2c07296
[15] Topal, O. (2024). A new perspective on the performance comparison of pure electric buses versus converted electric buses in public transportation systems. International Journal of Low-Carbon Technologies, 19: 1829-1840. https://doi.org/10.1093/ijlct/ctae049
[16] Nandhakumar, S., Seenivasan, S., Saalih, A.M., Saifudheen, M. (2021). Weight optimization and structural analysis of an electric bus chassis frame. Materials Today: Proceedings, 37: 1824-1827. https://doi.org/10.1016/j.matpr.2020.07.404
[17] Kebede, L., Tulu, G.S., Lisinge, R.T. (2022). Diesel-fueled public transport vehicles and air pollution in Addis Ababa, Ethiopia: Effects of vehicle size, age and kilometers travelled. Atmospheric Environment: X, 13: 100144. https://doi.org/10.1016/j.aeaoa.2021.100144
[18] Radha, M., S, V., D, G. (2020). Numerical investigations on heat transfer and flow characteristics of climate control systems in electric vehicles. SAE Technical Paper No. 2020-28-0010. https://doi.org/10.4271/2020-28-0010
[19] Gidarjati, M., Matsumoto, T. (2024). Dynamic vehicle age-based cohort model to estimate the emission from the transportation sector in Jakarta. Ecological Engineering & Environmental Technology, 25(4): 92-103. https://doi.org/10.12912/27197050/183526
[20] Ardianto, H., Prasetyawati, N.D., Sudaryanto, S. (2024). Distribution of motor vehicle volumes and ambient air dust levels in hot points of Yogyakarta City, Indonesia. Journal of Environmental Health, 16(1): 76-88. https://doi.org/10.20473/jkl.v16i1.2024.76-88
[21] Ministry for the Environment. (2024). Measuring Emissions: A Guide for Organisations: 2024 Detailed Guide. New Zealand: Ministry for the Environment.
[22] Martini, D., Bezzini, P., Longo, M. (2024). Environmental impact of electrification on local public transport: Preliminary study. Energies, 17(23): 5886. https://doi.org/10.3390/en17235886
[23] Varga, B.O., Mariasiu, F., Miclea, C.D., Szabo, I., Sirca, A.A., Nicolae, V. (2020). Direct and indirect environmental aspects of an electric bus fleet under service. Energies, 13(2): 336. https://doi.org/10.3390/en13020336
[24] Proctor, D. (2024). Solar power leads buildout of India's renewable energy. Power. https://www.powermag.com/solar-power-leads.
[25] Pan, Y.R., Jiang, L.,Wang, H. (2024). Cost-benefit analysis of the China’s household coal-to-electricity transition: A case study on the Beijing Mentougou Area. Energies, 17(23): 5933. https://doi.org/10.3390/en17235933
[26] Xiong, Y., Ning, Z.P., Liu, Y.Z., Gomez, M., Xiao, T.F. (2022). Emission and transformation behaviors of trace elements during combustion of Cd-rich coals from coal combustion related endemic fluorosis areas of Southwest, China. Ecotoxicology and Environmental Safety, 246: 114145. https://doi.org/10.1016/j.ecoenv.2022.114145
[27] Sobol, Ł., Dyjakon, A. (2020). The influence of power sources for charging the batteries of electric cars on CO2 emissions during daily driving: A case study from Poland. Energies, 13(16): 4267. https://doi.org/10.3390/en13164267
[28] Kurien, C., Srivastava, A.K. (2021). Relative assessment on E-vehicle indirect carbon emissions and emission control strategies for existing automotive fleet. Sustainability and Climate Change, 14(6): 424-435. https://doi.org/10.1089/scc.2021.0052
[29] Pan, W., Shittu, E. (2025). Assessment of mobility decarbonization with carbon tax policies and electric vehicle incentives in the US. Applied Energy, 379: 124838. https://doi.org/10.1016/j.apenergy.2024.124838
[30] Bandilla, K.W. (2020). 31-Carbon capture and storage. In Future Energy: Improved, Sustainable and Clean Options for our Planet. Elsevier, pp. 669-692. https://doi.org/10.1016/B978-0-08-102886-5.00031-1
[31] Celia, M.A. (2018). Modeling geological storage of carbon dioxide with a focus on leakage risk assessment. In Proceedings of the 8th International Congress on Environmental Geotechnics, Hangzhou, China, pp. 210-211. https://doi.org/10.1007/978-981-13-2221-1_15
[32] Thepsaskul, W., Wongsapai, W., Jaitiang, T., Jaekhajad, P. (2025). Prospects of attaining Thailand’s carbon neutrality target through carbon capture and storage by public power utility. Sustainability, 17(1): 276. https://doi.org/10.3390/su17010276
[33] Khan, M.J., Onat, N.C. (2023). Comprehensive total cost of ownership framework for alternative fuel public transportation buses. Transportation Research Record, 2677(3): 1165-1184. https://doi.org/10.1177/03611981221122783
[34] Sheth, A., Sarkar, D. (2019). Life cycle cost analysis for electric vs. diesel bus transit in an Indian scenario. International Journal of Technology, 10(1): 105-115. https://doi.org/10.14716/ijtech.v10i1.1958
[35] Yusof, N.K., Abas, P.E., Mahlia, T.M.I., Hannan, M.A. (2021). Techno-economic analysis and environmental impact of electric buses. World Electric Vehicle Journal, 12(1): 31. https://doi.org/10.3390/wevj12010031
[36] Jena, L.P., Bibhudutta, A. (2023). Blended financing application in Indian cities’ clean transportation financing. Journal of Social and Economic Development, 25(1): 146-161. https://doi.org/10.1007/s40847-023-00281-w
[37] Indra Al Irsyad, M.I., Firmansyah, A.I., Harisetyawan, V.T.F., Supriatna, N.K., Gunawan, Y., Jupesta, J., Yaumidin, U.K., Purwanto, J., Inayah, I. (2025). Comparative total cost assessments of electric and conventional vehicles in ASEAN: Commercial vehicles and motorcycle conversion. Energy for Sustainable Development, 85: 101599. https://doi.org/10.1016/j.esd.2024.101599
[38] Presiden Republik Indonesia. (2022). Instruksi Presiden Nomor 7 Tahun 2022 tentang Penggunaan Kendaraan Bermotor Listrik Berbasis Baterai sebagai Kendaraan Dinas Operasional dan/atau Kendaraan Perorangan Dinas Instansi Pemerintah Pusat dan Pemerintahan Daerah. https://jdih.maritim.go.id/cfind/source/files/inpres/2022/inpres-nomor-7-tahun-2022.pdf.
[39] Gubernur Provinsi DKI Jakarta. (2022). Pedoman Percepatan Program Penggunaan Kendaraan Bermotor Listrik Berbasis Baterai dalam Layanan Angkutan Transjakarta. https://jdih.jakarta.go.id/dokumenPeraturanDirectory/0031/2022KEPGUB00311053.pdf.
[40] Lin, Y., Zhang, K., Shen, Z.J.M., Miao, L. (2019). Charging network planning for electric bus cities: A case study of Shenzhen, China. Sustainability, 11(17): 4713. https://doi.org/10.3390/su11174713
[41] Belalcazar-Cerón, L.C., Dávila, P., Rojas, A., Guevara-Luna, M.A., Acevedo, H., Rojas, N. (2021). Effects of fuel change to electricity on PM2.5 local levels in the bus rapid transit system of Bogota. Environmental Science and Pollution Research, 28(48): 68642-68656. https://doi.org/10.1007/s11356-021-14978-0
[42] Schraufnagel, D.E., Balmes, J.R., De Matteis, S., Hoffman, B., Kim, W.J., Perez-Padilla, R., Wuebbles, D.J. (2019). Health benefits of air pollution reduction. Annals of the American Thoracic Society, 16(12): 1478-1487. https://doi.org/10.1513/AnnalsATS.201907-538CME
[43] Yang, J., Ma, J., Sun, Q., Han, C., Guo, Y., Li, M. (2022). Health benefits by attaining the new WHO air quality guideline targets in China: A nationwide analysis. Environmental Pollution, 308: 119694. https://doi.org/10.1016/j.envpol.2022.119694