Muhammad Yanis![]() | Sofyan Muhammad Saleh*
| Sofyan Muhammad Saleh*![]() | Ashfa Achmad
| Ashfa Achmad![]() | Laina Hilma Sari
| Laina Hilma Sari![]()
© 2025 The authors. This article is published by IIETA and is licensed under the CC BY 4.0 license (http://creativecommons.org/licenses/by/4.0/).
OPEN ACCESS
Walkability and environmental attitudes significantly influence the adoption of public transport in Banda Aceh, Indonesia, as revealed by our extended Theory of Planned Behavior (TPB) analysis of 500 respondents. This study uniquely integrates walkability and environmental attitudes into the TPB framework—an approach rarely applied in mid-sized Southeast Asian cities with limited infrastructure. Key findings show: (1) Better walkability improves people's attitude (β=0.26, p<0.01) and their sense of control (β=0.32, p<0.01) about using public transport; (2) Positive environmental attitudes directly influence the intention to use public transport (β=0.19, p<0.05); while (3) Gaps in infrastructure reduce the effectiveness of perceived control. These results suggest that integrated interventions—improving pedestrian connectivity while promoting sustainability awareness—could effectively increase transit ridership in this religiously conservative, infrastructure-limited city. Policymakers should prioritize walkability upgrades near transit stops and community-based environmental campaigns tailored to local cultural norms.
walkability, Theory of Planned Behavior, public transport, sustainable mobility, Banda Aceh
Public transport is essential for sustainable urban mobility, yet its adoption remains critically low in many developing cities. For countless residents, the daily journey is marked not only by distance but also by discomfort—uneven sidewalks, long walks under the sun, and the uncertainty of when the next bus will come. Walkability plays a crucial role in addressing this issue; a well-connected, safe, and comfortable pedestrian network not only eases access but also invites people to shift from private vehicles to shared, sustainable modes of transportation [1-3].
While cities in developed countries have long studied and invested in walkable environments, mid-sized Southeast Asia often gets left out of the conversation. The role of walkability in shaping transport behavior in these cities remains underexplored. Most existing studies focus on measurable infrastructure—how many meters to the bus stop, how wide the sidewalk is—without deeply considering the human side of the equation: people’s perceptions, attitudes, what their peers think, and whether they feel in control of their mobility choices [4].
Although research in small-city contexts such as Norway [5] demonstrates that perceived walkability strongly influences walking behavior, these findings are rooted in high-infrastructure urban environments. In contrast, mid-sized cities in the Global South often contend with fragmented pedestrian infrastructure and weak institutional capacity, underscoring the need to understand how psychosocial factors influence mobility behavior in these under-researched settings.
Addressing this research gap is vital. Poor pedestrian design, low-density land use, and insufficient policy coordination remain persistent barriers to public transport adoption in many developing cities. A deeper understanding of how walkability interacts with people’s attitudes, social norms, and perceived control can clarify why physical infrastructure alone is often inadequate. Cities can use these insights to create mobility systems that adapt to human behavior and physical layouts.
Banda Aceh, a mid-sized Indonesian city, exemplifies these challenges. Despite the launch of the Trans Koetaradja BRT-Lite system in 2016, public transport ridership remains low due to limited pedestrian access, dispersed urban form, and strong cultural preferences for private mobility [6-8]. The steep decline in traditional modes, such as labi-labi—from over 1,000 units in 2017 to approximately 352 fleets in 2023—signals a dramatic modal shift [9]. Unlike other Southeast Asian cities where socioeconomic factors are the primary determinants of transport behavior, Banda Aceh’s unique religious norms (e.g., gender-segregated seating), poor walkability infrastructure, and scattered residential patterns present distinct challenges.
Previous studies in cities such as Valparaíso (Chile) [10], Jayapura (Indonesia) [11], and urban sub-regions like Pasig (Philippines) [12] have demonstrated the positive impact of walkability on transit adoption. However, these contexts vary in scale, planning capacity, and cultural dynamics. Additional insights from cities, such as Jeddah (Saudi Arabia) [13] and Mosul (Iraq) [14], illustrated how walkability perceptions are shaped by climatic, religious, or post-conflict urban conditions—further supporting the need for context-sensitive analysis in mid-sized cities.
By capturing the joint influence of walkability and psychosocial factors on public transport behavior, this study provides empirical insights from a religiously distinct, infrastructure-limited Southeast Asian setting. Its findings aim to inform urban policy and planning in Banda Aceh and serve as a reference for other mid-sized cities across the Global South facing similar integration challenges between walkability and public transit.
To explore these dynamics, this study applies the Theory of Planned Behavior (TPB) [15] and Partial Least Squares Structural Equation Modeling (PLS-SEM) [16] to analyze how walkability (WALK), environmental attitudes (EA), and psychosocial constructs—attitude (ATT), subjective norms (SN), and perceived behavioral control (PBC)—influence behavioral intention (BI) to use public transport in Banda Aceh.
This literature review is based on the TPB developed by Ajzen [15], which posits that BI is determined by three psychosocial constructs: ATT, SN, and PBC. To enhance this framework, the present study incorporates two additional constructs—WALK and EA, which have gained prominence in shaping sustainable transport decisions, particularly in urban environments of developing countries.
2.1 Attitude and walkability
Attitudes toward public transport are shaped by both personal values and environmental attributes [17]. Studies suggest that walkable environments—characterized by accessibility, safety, and pedestrian comfort—can significantly enhance ATT by improving the overall experience of using public transport [18, 19]. In mid-sized cities with limited infrastructure, sidewalk connectivity, land-use diversity, and perceived safety are particularly influential in shaping perceived convenience and reliability [20, 21]. These elements of the built environment enhance not just physical accessibility, but also foster a sense of safety, social comfort, and belonging—key factors in motivating people to shift from private to public transport. Empirical evidence from Valparaíso and Jayapura highlights how urban design elements like continuous sidewalks, shading, and pedestrian priority directly affect transport-related attitudes [10, 11]. In Southeast Asia, Mee et al. [22] found that willingness to use public transport in Kuala Lumpur & Manila is shaped by perceived convenience, safety, and social acceptability, reinforcing the interactive influence of ATT and walkability in culturally diverse urban contexts. A recent study in Spanish mid-sized cities also found that perceived and actual accessibility significantly affect walking behavior. This highlights the crucial role of user perception in shaping attitudes toward public transport, even in cities with advanced infrastructure. Individuals with strong pro-environmental values also tend to report more favorable attitudes toward public transport and higher BI [23].
2.2 Subjective norms
Subjective norms reflect perceived social pressure to engage or not engage in a particular behavior. In Banda Aceh, the collectivist or religious societies, family influence, and peer approval are central to mobility decisions. Prior research indicates that walkable environments can indirectly reinforce SN by making public transport use more visible, socially accepted, and culturally normalized [19, 24]. Kalhoro et al. [25] showed that subjective norms significantly influence public transport intention, especially when environmental messaging aligns with religious and social values, emphasizing the role of cultural context in shaping SN in developing cities. Despite the growing relevance of walkability, its connection with subjective norms in Southeast Asian urban transport remains largely underexplored—revealing a critical gap in the regional literature.
2.3 Perceived behavioral control
PBC reflects an individual’s perceived ease or difficulty in performing a behavior, often shaped by external conditions such as infrastructure quality, service frequency, and network connectivity [26, 27]. High walkability environments can enhance PBC by lowering physical and psychological barriers to transit use. However, in fragmented systems typical of many cities in the Global South, walkability alone may not increase perceived control, particularly when transit services are unreliable, sparse, or poorly integrated [5, 13].
2.4 Environmental attitudes
EA represents an individual’s concern for environmental sustainability and motivation to engage in eco-friendly behaviors. Prior research shows that EA influences ATT and BI and may also serve as a moderator in extended TPB models [28, 29]. Individuals with strong pro-environmental values are more likely to adopt behaviors that align with sustainability, such as public or active transport. In Southeast Asian urban contexts, environmental attitudes have a positive influence on the intention to use public transport—particularly when supported by awareness campaigns and perceived personal benefits [25, 30].
Despite this, few studies examine how EA interacts with walkability in shaping behavior, especially in cities like Banda Aceh, where environmental awareness is emerging and moral norms are deeply rooted [31].
2.5 Integrating walkability into the TPB framework
Recent literature increasingly supports extending the TPB by incorporating spatial and environmental constructs such as walkability [5, 21]. Stefánsdóttir et al. [5] explored the influence of walkability in a small-city context in Norway, demonstrating its effect on walking behavior. However, comparable evidence from infrastructure-deficient cities in Southeast Asia remains scarce. The current study addresses this critical void by simultaneously integrating WALK and EA into the TPB framework to examine their mediating and moderating roles in shaping transit behavior in Banda Aceh.
ATT reflects an individual’s favorable or unfavorable evaluation of using public transport. Research shows that users with positive perceptions of comfort, affordability, and convenience tend to express stronger intentions to adopt public transport modes [18, 23]. In Banda Aceh, where public transport satisfaction remains low, individuals’ attitudes are likely shaped by their expectations and prior experiences [30].
H1: ATT positively influences BI to use public transport.
SN refers to the perceived social pressure to perform a behavior. In collectivist societies such as Banda Aceh, family approval, peer influence, and religious norms may strongly shape mobility choices [6, 22, 25].
H2: SN positively influences BI to use public transport.
PBC indicates an individual’s perceived ability to perform a behavior, which is affected by infrastructure access, availability, and reliability. In a fragmented cityscape like Banda Aceh, PBC becomes essential to understanding actual transport choices [25, 28].
H3: PBC positively influences BI to use public transport.
WALK is defined here through the 5C framework: Connected, Comfortable, Convenient, Convivial, and Conspicuous. In Banda Aceh, where pedestrian infrastructure is limited and public transport nodes are dispersed, walkability may indirectly shape behavior through psychosocial pathways. By improving accessibility and social visibility, walkable environments can reinforce social expectations (SN) and reduce barriers (PBC) [5, 6, 23].
H4: WALK positively influences SN.
H5: WALK positively influences PBC.
EA captures individual concern for sustainability and pro-environmental behavior. In a city where environmental awareness is emerging and moral norms are deeply rooted. EA may serve as both a personal motivator and a social value cue [25].
H6: EA positively influences BI.
H7: EA positively influences ATT.
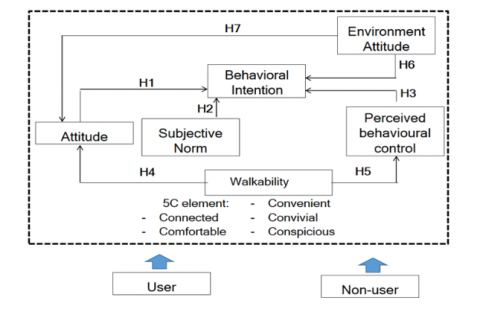
A research concept is described through the framework presented in Figure 1, which integrates TPB constructs with contextual variables WALK and EA. This framework further refines the model by introducing respondent classification into users and non-users of public transport. In this study, users refer to individuals who regularly use public transport (typically at least once per week), including frequent walkers, while non-users rarely or never use public transport and primarily rely on private vehicles. This distinction is based on the regularity of transit use within one's mobility patterns [32, 33]. Individuals who use public transport only occasionally (e.g., once a month or less) are classified as non-users due to their lack of consistent reliance on it for daily commuting [32, 34]. Users generally exhibit more positive attitudes, stronger subjective norms, and greater perceived behavioral control, whereas non-users are often influenced by external barriers, such as unsupportive environments or ingrained habits related to private vehicle use. Understanding this segmentation allows for the development of targeted strategies, particularly in promoting walkability to support sustainable mobility behavior.
Figure 1. Conceptual framework of the study
4.1 Case study
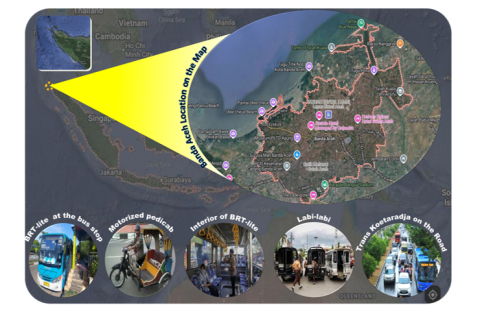
Located at the northern tip of Sumatra Island, Banda Aceh serves as the capital of Aceh Province and is home to approximately 252,899 residents (2022) within an area of 61.36 square kilometers. The city borders the Malacca Strait to the north, The Aceh Besar Regency to the east and south, and the Indian Ocean to the west. A key economic and administrative hub in the region, Banda Aceh plays a vital role in shaping provincial development and urban mobility patterns.
Despite its strategic importance, the city faces significant challenges in promoting public transport adoption, largely due to a high dependence on private vehicles. The current public transport system comprises Trans Koetaradja (BRT-Lite), traditional labi-labi minibusses, and motorized pedicabs. Introduced by the Aceh Transportation Agency, Trans Koetaradja provides a more structured service with fixed routes, scheduled timetables, and designated stops—designed to improve the reliability and accessibility of urban transit in the city.
Figure 2 illustrates the study area's location along with the main types of public transportation available in Banda Aceh. However, despite the implementation of the BRT-Lite system, private vehicles remain the dominant mode of transport, with motorcycles accounting for around 77% of all trips in Banda Aceh. Meanwhile, the use of labi-labi has dropped significantly, from about 1,000 vehicles in 2017 to just 352 registered units today, with only an estimated 80 still in active operation. The occupancy rate of labi-labi passengers is also very low, often below 50%, even during peak hours [9].
Figure 2. Location map of Banda Aceh (Indonesia)
The decline in interest in labi-labi is due to several factors, such as the increasing ownership of private vehicles and the public perception of services as uncomfortable and inefficient. In addition, the emergence of online transportation services such as Gojek, Grab, and Maxim provides more flexible and comfortable travel alternatives, further accelerating the shift from labi-labi to private vehicles or ride-hailing services.
As a region that implements Sharia Law, Banda Aceh also has transportation policies that reflect cultural and religious values. One of the policies implemented in the Trans Koetaradja service is the separation of seats based on gender, as part of an effort to uphold Sharia values in public spaces. Although the Trans Koetaradja service offers very cheap fares (initially charging only 1 rupiah per trip and later becoming free), user adoption is still hampered by several factors, such as low service frequency, long waiting times, and the lack of dedicated bus lanes. In addition, the sustainability of this service is still highly dependent on government subsidies.
The lack of adequate pedestrian infrastructure is also an obstacle to increasing the use of public transportation. The lack of accessibility to bus stops and limited pedestrian paths reduces the attractiveness of Trans Koetaradja for people who have to walk to access the service. Therefore, increasing walkability can be a key strategy in integrating a more effective public transportation system in Banda Aceh.
4.2 Research design
This study adopts a quantitative research design based on TPB to examine how walkability and environmental attitudes influence behavioral intentions to use public transportation in Banda Aceh. This study uses PLS-SEM to examine the hypothesized relationships. The method is well-suited for complex models involving latent variables, especially in exploratory research where theoretical frameworks are still developing. This approach is well-suited for assessing the causal relationships among psychosocial, environmental, and behavioral factors influencing public transportation adoption.
4.3 Sample and population
Using GIS analysis, respondents were purposively selected from locations within 0–400 meters of Trans Koetaradja bus stops. This proximity increases the likelihood that they interact with the system and are influenced by walkability factors. Sub-districts within this zone were randomly selected to enhance spatial representation.
Purposive sampling was chosen over random sampling due to the study’s focus on a specific subgroup—residents who are most likely to walk to access public transport. This method allows for more targeted insights and is commonly used in transport studies where spatial proximity is key to behavioral exposure [35].
The sample size of 500 respondents was determined based on statistical recommendations for PLS-SEM. As a rule of thumb, Hair et al. [36] suggested a minimum of 10 cases per indicator for models with multiple latent constructs to ensure sufficient statistical power.
However, this sampling frame introduces a potential bias, as it excludes residents who live further away from bus corridors and may exhibit different mobility behaviors. This limits generalizability across the entire urban population. Future studies should consider broader sampling strategies to improve external validity.
4.4 Pre-test and questionnaire refinement
Before the main survey, a pre-test was conducted with 30 university students and young professionals in Banda Aceh to evaluate item clarity, sequence, and terminology. Based on the feedback, several items were revised to improve phrasing, response scale appropriateness, and logical flow. This process improved face and content validity, ensuring the questionnaire was comprehensible across diverse demographic backgrounds.
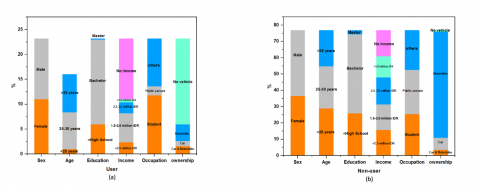
The final version of the questionnaire was distributed through both digital platforms (email and social media) and face-to-face interactions. Participation was voluntary and anonymous, and informed consent was obtained from all respondents. Figure 3 illustrates the demographic and socioeconomic profiles, categorized by public transport users and non-users. This segmentation helps contextualize behavioral intention differences explored in the subsequent analysis.
Figure 3. Demographic and socioeconomic characteristics of respondents for (a) user and (b) non-user
5.1 Validity and reliability analysis
This study emphasizes the importance of using a valid and reliable instrument to ensure that each construct accurately reflects the intended concept [37]. Table 1 presents the results of the validity and reliability tests, including factor loadings, composite reliability (CR), Cronbach’s alpha, and average variance extracted (AVE). These results demonstrate how well each indicator measures its associated variable and confirm the consistency of the measurement model.
The 500 respondents who met the inclusion criteria participated in the survey. This sampling approach was used to ensure the validity and reliability of the research instrument. Validity was assessed using item-total correlations, with items deemed valid if their r-count exceeded the r-table value. Reliability was measured using Cronbach’s alpha, with a threshold of >0.7 signifying acceptable internal consistency.
Convergent validity reflects how strongly the indicators within a construct correlate with one another. This study assessed convergent validity using factor loadings and AVE. According to Fornell and Larcker [38], factor loadings above 0.7 indicate that indicators reliably measure their intended construct, while AVE values above 0.5 show that the construct accounts for at least 50% of the variance in its indicators.
The analysis shows that all indicators have a factor loading above 0.7, which means that each indicator makes a significant contribution to its construct. The AVE value ranging from 0.614 to 0.709 also indicates that the constructs used have strong validity. For instance, the walkability construct has an AVE of 0.709, suggesting a robust relationship between the walkability aspect of the public transportation system and the indicators that assess it.
The reliability of each construct was assessed using Cronbach’s alpha and CR. According to Hair et al. [36], Cronbach’s alpha values of ≥0.7 indicate acceptable internal consistency, while CR values ≥0.7 reflect strong construct reliability. In this study, all reliability values exceeded 0.8, confirming that the measurement model is consistent and dependable. For instance, the attitude construct yielded a CR of 0.920 and an AVE of 0.699, indicating that individuals’ evaluations of public transport were measured with high stability and accuracy. Similarly, the subjective norm construct achieved a CR of 0.917 and an AVE of 0.699, underscoring the substantial influence of social expectations—particularly support from family and peers—on transport decisions.
The results of validity and reliability tests have significant implications for research on public transportation user behavior. Previous studies have shown that pro-environmental attitudes, social norms, and perceived control play a major role in shaping public transportation use behavior [39, 40]. In addition, in the context of urban mobility, it was found that walkability and perceived behavioral control factors influence people's intention to use public transportation [5, 41]. Thus, the findings in this study confirm that factors such as attitude, subjective norm, perceived behavioral control, and walkability are very important in understanding the behavior of public transportation users. Urban planning needs to consider these factors more seriously to increase public participation in public transportation.
5.2 Structural model analysis
5.2.1 Model fit
As shown in Table 2, a low p-value suggests that the model fits the empirical data well [42]. Furthermore, the Standardized Root Mean Square Residual (SRMR) is 0.074 for users and lower for non-users at 0.062, suggesting that the model produces an acceptable level of residual error [43]. The Normed Fit Index (NFI) further supports this interpretation, with a higher fit observed for non-users (0.891) compared to users (0.772), implying that the model aligns more appropriately with the data from non-users.
Table 1. Validity and reliability
|
Construct |
Factor Loading |
Composite Reliability |
Cronbach Alpha |
AVE |
|
Walkability |
|
|
|
|
|
0.8312 |
0.9230 |
0.8955 |
0.7059 |
|
0.8704 |
|
|
|
|
0.8515 |
|
|
|
|
0.7833 |
|
|
|
|
0.8616 |
|
|
|
|
Environmental Attitude |
|
|
|
|
|
0.8155 |
0.9113 |
0.8783 |
0.6726 |
|
0.8017 |
|
|
|
|
0.8446 |
|
|
|
|
0.8077 |
|
|
|
|
0.8306 |
|
|
|
|
Attitude |
|
|
|
|
|
0.8203 |
0.9209 |
0.8926 |
0.6996 |
|
0.8342 |
|
|
|
|
0.8490 |
|
|
|
|
0.8521 |
|
|
|
|
0.8261 |
|
|
|
|
Subjective Norm |
|
|
|
|
|
0.8155 |
0.9172 |
0.8871 |
0.6890 |
|
0.8017 |
|
|
|
|
0.8446 |
|
|
|
|
0.8077 |
|
|
|
|
0.8306 |
|
|
|
|
Perceived Behavior Control |
|
|
|
|
|
0.8084 |
0.9046 |
0.8682 |
0.6549 |
|
0.7893 |
|
|
|
|
0.8212 |
|
|
|
|
0.8290 |
|
|
|
|
0.7978 |
|
|
|
|
Behavioral Intention |
|
|
|
|
|
0.7742 |
0.8885 |
0.8432 |
0.6144 |
|
0.7835 |
|
|
|
|
0.7836 |
|
|
|
|
0.7840 |
|
|
|
|
0.7938 |
|
|
|
Table 2. Model fit
|
Group |
Chi-Square |
P-Value |
SRMR |
NFI |
d_ULS |
d_G |
|
User |
675.849 |
0.001 |
0.074 |
0.772 |
2.562 |
1.138 |
|
Non-User |
783.753 |
0.002 |
0.062 |
0.891 |
1.815 |
0.371 |
The d_ULS (unweighted least squares discrepancy) value is higher for users (2.562) than non-users (1.815), indicating that there is slightly more discrepancy in the user model. The d_G (geodesic discrepancy) value is also higher for users (1.138) than non-users (0.371), indicating that the non-user model is more stable. The model fits the non-user group better than the user group, as indicated by the higher NFI value, lower SRMR, and better distortion measures. However, the model for the user group remains within an acceptable fit range. The results confirm that the model works well for studying how psychosocial, environmental, and contextual factors shape people’s decisions to use public transport in Banda Aceh.
5.2.2 Hypothesis test
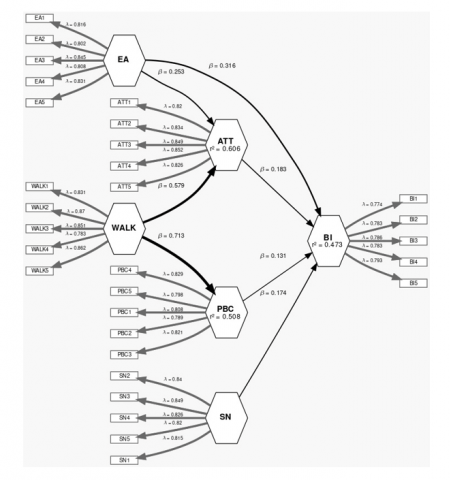
As shown in Table 3, the key variables significantly affect BI's use of public transport through direct and indirect pathways. Figure 4 illustrates the structural equation model derived from the PLS-SEM analysis. This model visualizes the strength and direction of each hypothesized relationship, helping to interpret the significance of key constructs.
Overall, the findings support the extended TPB model in explaining transport intentions in mid-sized Southeast Asian cities. Walkability and environmental attitudes play important indirect roles. Unlike prior research centered on megacities or fully urban areas, this study offers fresh evidence from a mid-sized, religiously governed city in the Global South—showing how walkability, psychosocial factors, and local cultural norms interact in shaping transit behavior. These unique findings highlight why sustainable transport plans need to be customized to fit the social and infrastructure realities of specific urban contexts, especially those often overlooked.
5.2.3 Multi-group analysis
To test for differences in relationships among constructs based on user type, the researchers performed a multi-group analysis. The results are presented in Table 4. The comparison highlights two significant differences between the two groups.
First, PBC has a substantially stronger influence on BI among non-users (β=0.41) compared to users (β=0.13), with a significant group difference (p=0.01). This indicates that non-users are more sensitive to perceived ease and control, such as service reliability, walking access, and infrastructure quality. The result supports earlier findings that infrastructure barriers are a critical determinant for those who are not yet habitual public transport users [49].
Second, the effect of WALK on PBC is also significantly stronger among users (p=0.02), suggesting that walkable environments reinforce perceptions of accessibility and comfort in public transport regular users. Users likely perceive well-connected pedestrian paths as integral to their daily routines, reinforcing transit-oriented behavior.
Table 3. Hypothesis test
|
Hypothesis |
Original Sample |
Standard Deviation |
T-Test |
Sig |
|
Attitude (ATT)→Behavioral Intention (BI) |
0.183 |
0.0715 |
2.5528 |
Significant |
|
Environment Attitude (EA)→Attitude (ATT) |
0.2533 |
0.0535 |
4.7367 |
Significant |
|
Environment Attitude (EA)→Behavioral Intention (BI) |
0.3162 |
0.0638 |
4.9561 |
Significant |
|
Perceived Behavioral Control (PBC)→Behavioral Intention (BI) |
0.1315 |
0.0715 |
1.8387 |
Not Significant |
|
Subjective Norm (SN)→Behavioral Intention (BI) |
0.1737 |
0.0682 |
2.5466 |
Significant |
|
Walkability (WALK)→Attitude (ATT) |
0.579 |
0.0537 |
10.7810 |
Significant |
|
Walkability (WALK)→Perceived Behavioral Control (PBC) |
0.7127 |
0.0391 |
18.2472 |
Significant |
Table 4. Multi-group comparison test
|
Source |
|
User |
Non-User |
|
User |
Non-User |
|
|
|
|
|
Est. |
P1 |
P2 |
Diff |
Mean |
Mean |
P-Value |
Sig. |
|
|
ATT->BI |
0.18 |
-0.07 |
0.24 |
-0.31 |
-0.07 |
0.24 |
0.98 |
No |
|
|
EA->ATT |
0.25 |
0.26 |
0.25 |
0.01 |
0.26 |
0.25 |
0.49 |
No |
|
|
EA->BI |
0.32 |
0.36 |
0.30 |
0.06 |
0.35 |
0.30 |
0.40 |
No |
|
|
PBC->BI |
0.13 |
0.41 |
0.07 |
0.35 |
0.42 |
0.07 |
0.01** |
Yes |
|
|
SN->BI |
0.17 |
0.11 |
0.20 |
-0.08 |
0.13 |
0.19 |
0.67 |
No |
|
|
WALK->ATT |
0.58 |
0.58 |
0.58 |
0.00 |
0.58 |
0.58 |
0.49 |
No |
|
|
WALK->PBC |
0.71 |
0.81 |
0.68 |
0.14 |
0.81 |
0.68 |
0.02** |
Yes |
|
Figure 4. Structural equation model
Other relationships, such as ATT→BI, SN→BI, and EA→BI, show no statistically significant differences between the two groups, implying that these psychosocial factors operate similarly across user types. This consistency suggests that while attitudinal and normative influences are important, physical and structural enablers remain key differentiators between users and non-users in cities like Banda Aceh. These results highlight the importance of targeted interventions. For non-users, increasing walkability and addressing control-related barriers may unlock greater modal shifts. For users, efforts should focus on maintaining infrastructure quality and embedding transit-friendly norms to ensure continued usage.
These findings carry important policy implications. While psychosocial factors such as attitude and social norms shape behavioral intention, structural enablers like walkability and perceived control are decisive, especially for non-users. Improving sidewalk quality, pedestrian connectivity, and stop accessibility can enhance PBC and SN, especially in peripheral areas with limited infrastructure. However, implementation may face budgetary, institutional, and planning challenges. Pilot projects in dense, high-footfall zones—such as schools or markets—can be used to test walkability upgrades. Success can be measured through increases in first-mile walking accessibility, reduced private vehicle dependence, and higher public transport ridership. For current users, reinforcing service consistency and embedding culturally respectful practices (such as gender-sensitive seating) are essential for retaining loyalty and trust in public transport systems.
While this study focuses on psychosocial and spatial factors, future research should incorporate economic variables (e.g., fare affordability, fuel prices, and income levels) to better capture their interplay with walkability and public transport adoption. In Banda Aceh, where Trans Koetaradja fares are heavily subsidized (currently free), perceived cost savings may offset walkability barriers for low-income groups. Conversely, motorcycle dominance suggests that private vehicle costs (e.g., fuel, and maintenance) are not prohibitive enough to deter usage. Research from Kuala Lumpur and Jakarta suggests that walkability becomes more influential when paired with pricing strategies like dynamic fares or congestion charges, especially if supported by psychosocial interventions [25, 50].
5.3 Limitations and future research
This study has several limitations. The purposive sampling focused on residents within a 0–400 meter radius of Trans Koetaradja bus stops, which may limit the generalizability of findings to the broader population of Banda Aceh [35]. Future research should expand sampling frames to include a more diverse geographic and socioeconomic population to improve representativeness. Moreover, the study excluded economic variables—such as fare costs, household income, and fuel prices [51-53]. Including these factors in future models could offer a more comprehensive understanding of public transport adoption dynamics. While this study focused on TPB constructs augmented by walkability and environmental attitudes, other psychosocial variables (e.g., habit strength, perceived safety) and contextual factors (e.g., service frequency, weather) warrant investigation in the local context.
Finally, emerging technologies like computer vision (e.g., Google Street View API) and machine learning can objectively assess walkability metrics (e.g., sidewalk continuity, shading, pedestrian density) at scale. Future studies could leverage these tools to validate perceived walkability scores in Banda Aceh, reducing reliance on self-reported data. For instance, AI-generated heatmaps could identify priority zones for infrastructure upgrades, complementing traditional surveys with real-time spatial analytics.
This study examined how walkability and environmental attitudes, alongside psychosocial variables from the Theory of Planned Behavior (TPB), shape behavioral intention (BI) to use public transport in a mid-sized, religiously influenced city in the Global South. The findings highlight that perceived behavioral control (PBC), attitude (ATT), and environmental attitudes (EA) significantly affect public transport intention. Walkability indirectly influences intention by enhancing PBC and subjective norms (SN), particularly among current users. By integrating environmental and spatial variables into the TPB framework, this study contributes to a more holistic understanding of sustainable mobility behavior in under-researched, infrastructure-limited urban settings. The results suggest that improving pedestrian infrastructure and reinforcing pro-environmental values can increase public transport adoption, especially for non-users.
These findings are relevant for other developing cities facing similar challenges, including limited walkability, dependence on private vehicles, and culturally driven mobility constraints. Policy interventions should focus on localized strategies that align infrastructure upgrades with psychosocial motivation and sociocultural values. Future research could benefit from longitudinal approaches to track behavior changes over time. It should also include economic factors—such as fare costs, fuel prices, and income levels—in the analysis. Moreover, integrating AI-based tools with cultural and behavioral indicators could enhance the precision and scalability of transport behavior models in comparable settings.
This study is supported by a scholarship from the Human Resources Management Agency (BPSDM), Government of Aceh, Indonesia.
|
ATT |
Attitude |
|
AVE |
Average Variance Extracted |
|
BI |
Behavioral Intention |
|
BRT-lite |
Bus Rapid Transit-Lite |
|
CR |
Composite Reliability |
|
Diff |
Difference |
|
d_G |
Geodesic Discrepancy |
|
d_ULS |
Unweighted Least Squares Discrepancy |
|
EA |
Environmental Attitudes |
|
Est |
Estimate |
|
GIS |
Geographic Information System |
|
H1 |
1st Hypothesis |
|
H2 |
2nd Hypothesis |
|
H3 |
3rd Hypothesis |
|
H4 |
4th Hypothesis |
|
H5 |
5th Hypothesis |
|
H6 |
6th Hypothesis |
|
H7 |
7th Hypothesis |
|
NFI |
Normed Fit Index |
|
P1 |
1st Path (Path Coefficient for User) |
|
P2 |
2nd Path (Path Coefficient for Non-User) |
|
PBC |
Perceived Behavioral Control |
|
P-value |
Probability Value |
|
PLS-SEM |
Partial Least Squares Structural Equation Modelling |
|
Sig |
Significance |
|
SN |
Subjective Norms |
|
SRMR |
Standardized Root Mean Square Residual |
|
T-test |
A Statistical Testing |
|
TPB |
Theory of Planned Behaviour |
|
WALK |
Walkability |
[1] De Vos, J., Lättman, K., Van der Vlugt, A.L., Welsch, J., Otsuka, N. (2023). Determinants and effects of perceived walkability: A literature review, conceptual model and research agenda. Transport Reviews, 43(2): 303-324. https://doi.org/10.1080/01441647.2022.2101072
[2] Huang, X.R., Zeng, L., Liang, H.X., Li, D.Y., Yang, X., Zhang, B. (2024). Comprehensive walkability assessment of urban pedestrian environments using big data and deep learning techniques. Scientific Reports, 14(1): 26993. https://doi.org/10.1038/s41598-024-78041-x
[3] Bozovic, T. (2025). Urban walkability and equity in the car-centric city. In Inclusive Cities and Global Urban Transformation: Infrastructures, Intersectionalities, and Sustainable Development. Singapore: Springer Nature Singapore, pp. 77-85. https://doi.org/10.1007/978-981-97-7521-7
[4] Wang, H., Yang, Y.Q. (2019). Neighbourhood walkability: A review and bibliometric analysis. Cities, 93: 43-61. https://doi.org/10.1016/j.cities.2019.04.015
[5] Stefánsdóttir, H., Mouratidis, K., Rynning, M.K., Meyer, S.F. (2024). Perceived walkability and daily walking behaviour in a “small city context”–The case of Norway. Journal of Transport Geography, 121: 104014. https://doi.org/10.1016/j.jtrangeo.2024.104014
[6] Nasution, M.A. (2020). Walkability in Banda Aceh: An approach in urban mobility development. IOP Conference Series: Earth and Environmental Science, 452(1): 012148. https://doi.org/10.1088/1755-1315/452/1/012148
[7] Noer, F., Matondang, A.R., Sirojuzilam, Saleh, S.M. (2017). Effect of space structures against development of transport infrastructure in Banda Aceh by using the concept of transit oriented development. AIP Conference Proceedings, 1903(1): 060002. https://doi.org/10.1063/1.5011556
[8] Ruslan, R., Saleh, S.M., Anggraini, R, Sugiarto, S. (2025). Exploring contributing factors to household vehicle ownership in developing countries: A case of Banda Aceh, Communications, 27(1): D13-D24. https://doi.org/10.26552/com.C.2025.009
[9] Dinas Perhubungan Aceh. (2017). Peningkatan Jaringan Transportasi Berbasis BRT di Banda Aceh. https://itdp-indonesia.org/wp-content/uploads/2020/03/CDIA-PFS-Banda-Aceh-BRT-Report-Indonesia-1.pdf.
[10] Seriani, S., Aprigliano, V., Peña, A., Briones, H., Arredondo, B., Requesens, J., Fujiyama, T. (2025). Evaluating the accessibility of pedestrian sidewalks to connect public transport: A pilot study in Valparaíso, Chile. Applied Sciences, 15(3): 1106. https://doi.org/10.3390/app15031106
[11] Wutoy, R.K.J., Widyastuti, D.T. (2024). Synchronisation of perceived and physical walkability towards transit-oriented district, Jayapura City. IOP Conference Series: Earth and Environmental Science, 1394(1): 012035. https://doi.org/10.1088/1755-1315/1394/1/012035
[12] Nogueira, A.C.C.S., Diaz, C.E.D. (2023). Evaluating public transport accessibility and walkability in Pasig City (Philippines) and their correlation to socioeconomic factors at the Barangay level. Asian Transport Studies, 9: 100117. https://doi.org/10.1016/j.eastsj.2023.100117
[13] Banger, A., Grigolon, A., Brussel, M., Pfeffer, K. (2024). Identifying the interrelations between subjective walkability factors and walking behaviour: A case study in Jeddah, Saudi Arabia. Transportation Research Interdisciplinary Perspectives, 24: 101025. https://doi.org/10.1016/j.trip.2024.101025
[14] Matloob, F.A., Aldeen Ismail, K.J., Alfakhry, A.A. (2024). What impacts walkability in Mosul: The role of accessibility at neighborhood level. International Journal of Sustainable Development & Planning, 19(7): 2579-2586. https://doi.org/10.18280/ijsdp.190714
[15] Ajzen, I. (1991). The theory of planned behavior. Organizational Behavior and Human Decision Processes, 50(2): 179-211. https://doi.org/10.1016/0749-5978(91)90020-T
[16] Hair, J.F., Black, W.C., Babin, B.J., Anderson, R.E. (2019). Multivariate Data Analysis (8th ed.). Cengage Learning.
[17] Ajzen, I. (2005). Attitudes, Personality and Behaviour. Second Edition. New York: Open University Press.
[18] Van Acker, V., Van Wee, B., Witlox, F. (2010). When transport geography meets social psychology: Toward a conceptual model of travel behaviour. Transport Reviews, 30(2): 219-240. https://doi.org/10.1080/01441640902943453
[19] Panter, J.R., Jones, A.P., Van Sluijs, E.M. (2008). Environmental determinants of active travel in youth: A review and framework for future research. International Journal of Behavioral Nutrition and Physical Activity, 5: 1-14. https://doi.org/10.1186/1479-5868-5-34
[20] Giles-Corti, B., Vernez-Moudon, A., Reis, R., Turrell, G., Dannenberg, A.L., Badland, H., Foster, S., Lowe, M, Sallis, J.F., Stevenson, M., Owen, N. (2016). City planning and population health: A global challenge. The Lancet, 388(10062): 2912-2924. https://doi.org/10.1016/S0140-6736(16)30066-6
[21] Zhu, X.M., Lee, C. (2008). Walkability and safety around elementary schools: Economic and ethnic disparities. American Journal of Preventive Medicine, 34(4): 282-290. https://doi.org/10.1016/j.amepre.2008.01.024
[22] Mee, C.K., Subramaniam, G., Ating, R., Separa, L.A.C. (2022). Willingness to use public transport in Kuala Lumpur & Manila. Environment-Behaviour Proceedings Journal, 7(21): 411-419. https://doi.org/10.21834/ebpj.v7i21.3751
[23] Orrego-Oñate, J., Marquet, O. (2025). The role of perceived and objective accessibility in shaping walking behavior: Insights from mid-sized Spanish cities. Transportation Research Part A: Policy and Practice, 192: 104340. https://doi.org/10.1016/j.tra.2024.104340
[24] Zhang, D., Schmöcker, J.D., Fujii, S., Yang, X. (2016). Social norms and public transport usage: Empirical study from Shanghai. Transportation, 43: 869-888. https://doi.org/10.1007/s11116-015-9625-y
[25] Kalhoro, M., Au Yong, H.N., Ramendran SPR, C. (2021). Understanding the factors affecting pro-environment behavior for city rail transport usage: Territories’ empirical evidence—Malaysia. Sustainability, 13(22): 12483. https://doi.org/10.3390/su132212483
[26] Ewing, R., Cervero, R. (2010). Travel and the built environment: A meta-analysis. Journal of The American Planning Association, 76(3): 265-294. https://doi.org/10.1080/01944361003766766
[27] Mokhtarian, P.L., Cao, X. (2008). Examining the impacts of residential self-selection on travel behavior: A focus on methodologies. Transportation Research Part B: Methodological, 42(3): 204-228. https://doi.org/10.1016/j.trb.2007.07.006
[28] Bamberg, S. (2003). How does environmental concern influence specific environmentally related behaviors? A new answer to an old question. Journal of Environmental Psychology, 23(1): 21-32. https://doi.org/10.1016/S0272-4944(02)00078-6
[29] Donald, I.J., Cooper, S.R., Conchie, S.M. (2014). An extended theory of planned behaviour model of the psychological factors affecting commuters' transport mode use. Journal of Environmental Psychology, 40: 39-48. https://doi.org/10.1016/j.jenvp.2014.03.003
[30] Chan, T.J., Halmee, N.S.M., Samson, J. (2022). Factors influencing pro-environmental behavior to use public transport: A predictive approach. In Proceedings of the International Conference on Communication, Language, Education and Social Sciences (CLESS 2022). Atlantis Press, pp. 213-228. https://doi.org/10.2991/978-2-494069-61-9_21
[31] Shi, H.X., Wang, S.Y., Zhao, D.T. (2017). Exploring urban resident’s vehicular PM2.5 reduction behavior intention: An application of the extended theory of planned behavior. Journal of Cleaner Production, 147: 603-613. https://doi.org/10.1016/j.jclepro.2017.01.108
[32] Lachapelle, U., Frank, L.D., Sallis, J.F., Saelens, B.E., Conway, T.L. (2016). Active transportation by transit-dependent and choice riders and potential displacement of leisure physical activity. Journal of Planning Education and Research, 36(2): 225-238. https://doi.org/10.1177/0739456X15616253
[33] Palm, M., Allen, J., Liu, B., Zhang, Y., Widener, M., Farber, S. (2021). Riders who avoided public transit during COVID-19: Personal burdens and implications for social equity. Journal of the American Planning Association, 87(4): 455-469. https://doi.org/10.1080/01944363.2021.1886974
[34] Iravani, H., Rao, V. (2020). The effects of New Urbanism on public health. Journal of Urban Design, 25(2): 218-235. https://doi.org/10.1080/13574809.2018.1554997
[35] Etikan, I., Musa, S.A., Alkassim, R.S. (2016). Comparison of convenience sampling and purposive sampling. American Journal of Theoretical and Applied Statistics, 5(1): 1-4. https://doi.org/10.11648/j.ajtas.20160501.11
[36] Hair, J.F., Hult, G.T.M., Ringle, C.M., Sarstedt, M. (2017). A Primer on Partial Least Squares Structural Equation Modeling (PLS-SEM). Second Edition. SAGE Publications, Inc., USA.
[37] Kline, R.B. (2016). Principles and Practice of Structural Equation Modeling. Fourth Edition. New York: The Guilford Press.
[38] Fornell, C., Larcker, D.F. (1981). Evaluating structural equation models with unobservable variables and measurement error. Journal of Marketing Research, 18(1): 39-50. https://doi.org/10.1177/002224378101800104
[39] Möser, G., Bamberg, S. (2008). The effectiveness of soft transport policy measures: A critical assessment and meta-analysis of empirical evidence. Journal of Environmental Psychology, 28(1): 10-26. https://doi.org/10.1016/j.jenvp.2007.09.001
[40] Lai, W.T., Chen, C.F. (2011). Behavioral intentions of public transit passengers–The roles of service quality, perceived value, satisfaction and involvement. Transport Policy, 18(2): 318-325. https://doi.org/10.1016/j.tranpol.2010.09.003
[41] Zhao, G., Cao, M., De Vos, J. (2024). Exploring walking behaviour and perceived walkability of older adults in London. Journal of Transport & Health, 37: 101832. https://doi.org/10.1016/j.jth.2024.101832
[42] Fotopoulos, C.V., Psomas, E.L. (2010). The structural relationships between TQM factors and organizational performance. The TQM Journal, 22(5): 539-552. https://doi.org/10.1108/17542731011072874
[43] Hu, L.T., Bentler, P.M. (1999). Cutoff criteria for fit indexes in covariance structure analysis: Conventional criteria versus new alternatives. Structural Equation Modeling: A Multidisciplinary Journal, 6(1): 1-55. https://doi.org/10.1080/10705519909540118
[44] Bamberg, S., Ajzen, I., Schmidt, P. (2003). Choice of travel mode in the theory of planned behavior: The roles of past behavior, habit, and reasoned action. Basic and Applied Social Psychology, 25(3): 175-187. https://doi.org/10.1207/S15324834BASP2503_01
[45] Bockarjova, M., Steg, L. (2014). Can protection motivation theory predict pro-environmental behavior? Explaining the adoption of electric vehicles in the Netherlands. Global Environmental Change, 28: 276-288. https://doi.org/10.1016/j.gloenvcha.2014.06.010
[46] Ababio-Donkor, A., Saleh, W., Fonzone, A. (2020). The role of personal norms in the choice of mode for commuting. Research in Transportation Economics, 83: 100966. https://doi.org/10.1016/j.retrec.2020.100966
[47] Ng, P.Y., Phung, P.T. (2021). Public transportation in Hanoi: Applying an integrative model of behavioral intention. Case Studies on Transport Policy, 9(2): 395-404. https://doi.org/10.1016/j.cstp.2020.10.012
[48] Ratanawichit, P., Arifwidodo, S.D., Anambutr, R. (2025). Neighbourhood walkability, recreational walking, and their associations with physical activity and well-being in Bangkok, Thailand. Urban Science, 9(5): 154. https://doi.org/10.3390/urbansci9050154
[49] Ghazali, W.N.W.W., Ponrahono, Z., Bachok, S., Sharaai, A.H., Rabe, N.S., Shukri, N.S.M., Sunoto, Y.N. (2021). Travel mode choice intention in reducing traffic congestion in Kajang, Selangor. Planning Malaysia, 19(4): 269-279. https://doi.org/10.21837/pm.v19i18.1051
[50] Sihombing, A., Ramadhan, A.K., Saskia, C.S. (2022). Accessibility and permeability in transit area. Case Studies in Jakarta-Depok Train Stations. Evergreen, 9(2): 538-546. https://doi.org/10.5109/4794185
[51] Cervero, R. (2003). Road expansion, urban growth, and induced travel: A path analysis. Journal of the American Planning Association, 69(2): 145-163. https://doi.org/10.1080/01944360308976303
[52] Litman T. (2020). Evaluating Public Transportation Health Benefits. Victoria, BC, Canada: Victoria Transport Policy Institute.
[53] Pereira, R.H., Schwanen, T., Banister, D. (2017). Distributive justice and equity in transportation. Transport Reviews, 37(2): 170-191. https://doi.org/10.1080/01441647.2016.1257660