Christina Sari*![]() | Ismiyati
| Ismiyati![]() | Mudjiastuti Handajani
| Mudjiastuti Handajani![]() | Yudi Basuki
| Yudi Basuki![]()
© 2025 The authors. This article is published by IIETA and is licensed under the CC BY 4.0 license (http://creativecommons.org/licenses/by/4.0/).
OPEN ACCESS
First-mile and last-mile connectivity remains a significant challenge in developing cities as inadequate feeder systems often hinder public transport efficiency. While prior studies have examined access and egress mode choices, few have explored how income levels and travel distance shape commuters’ travel mode behavior in Indonesia. This study addresses this gap by analyzing the influence of income level and travel distance on mode selection for first-mile and last-mile trips in Jakarta’s commuter rail system. This study used a multinomial logit model (MNL) to examine the hypotheses across 24 Jakarta Kota–Bogor stations. The findings show that lower-income commuters prefer to walk and use microtransit and Bus Rapid Transit (BRT), while higher-income groups prefer private vehicles and ride-hailing services. In addition, travel distance strongly influences mode choice, with walking decreasing significantly as the distance increases. The results also highlight a high private vehicle dependency for first-mile access and a tendency for ride-hailing in last-mile travel, reflecting a wide gap in Jakarta’s feeder system. This study recommends expanding and integrating feeder transport, improving pedestrian infrastructure, unifying fares across modes, and regulating ride-hailing services to enhance connectivity. These measures can promote sustainable urban mobility and reduce dependency on private vehicle.
commuter rail, first-mile, last-mile, mode choice, socioeconomic, travel distance
Recent phenomena indicate that horizontal urban development is advancing rapidly, especially in metropolitan cities, which raises daily trip mobility, particularly toward the city center [1]. Enhancing the practicality of rail transportation for daily mobility can meet the high demand for travel between suburban areas and the city center [2]. Extensive research over the last few years has focused on multimodal development to enhance the efficiency of rail transit systems [2, 3]. Rail transit stations, often found in residential areas or office clusters, that are easily accessible influence the probability of individuals choosing rail transit for their travel [4]. Consequently, the accessibility of rail transit has become a key focus of research in the past few years.
An analysis of the commuters’ characteristics regarding first-and-last-mile movements between transit stations and their origin or destination points is essential to ensure seamless public transportation integration [2, 5]. The analysis pays particular attention to the dominant first-mile stage—also known as the access stage—which connects residential areas to transit stations, especially for commuting purposes, and the last-mile stage—referred to as the egress stage—which extends from transit stations to homes or residential areas [3, 6]. The effectiveness of first-and-last-mile facilities directly affects the service quality and transportation network connectivity in residential areas and transit stations [7]. Standard modes for facilitating these stages include walking, cycling, bus services, BRT, car commuting (e.g., park-and-ride), and ride-hailing, collectively called feeder services [3, 8, 9]. Among these modes, walking remains the most universally accessible mode for first-and-last-mile connectivity. Moreover, developing non-motorized transport infrastructure, such as sheltered sidewalks adjacent to transit stations, is imperative [10]. The initial purpose of bus and microtransit feeders is to integrate with rail transit to provide an expanded range of services [11]. At the same time, the modal share of car usage for first-and-last-mile stages varies across cities, depending on the availability of parking facilities and the implementation of regulatory policies.
Previous studies have explained that specific characteristics of passengers, including socioeconomic status, are crucial in shaping travel mode preferences [2, 12, 13]. Numerous studies in the past few years have increasingly focused on the factors influencing mode selection during the first-and-last-mile stages, which correspond to increased demand for enhanced public transportation accessibility, particularly in rail systems [14, 15]. Multiple studies have revealed that income levels significantly affect reliance on motorcycle transportation. Higher-income individuals spend more to shorten travel duration and distance. In contrast, lower-income groups prefer residential options on the peripheries of urban areas in favor of accessible transit hubs [16, 17]. Moreover, socioeconomic variables, such as income groups, availability of private vehicles, and proficiency in digital literacy—particularly concerning ride-hailing applications—substantially influence the transportation mode selections for first-and-last-mile travel [18, 19]. Given these factors, examining this issue in developing countries, such as Indonesia, is necessary.
The focus of this research is the Greater Jakarta Metropolitan Area. This urban cluster is classified as a mega-city within the Indonesian context, inhabiting almost 30 million citizens [20], making it the second-most populated metropolitan area in Asia after Tokyo [21]. In particular, commuter rail networks are important in accommodating the growing commuter population. One of the main challenges lies in the different destinations across the Greater Jakarta Metropolitan Area. Residential areas, business districts, and commercial hubs demand several transport solutions for first-and-last-mile connections [22, 23]. For instance, stations in high-density residential areas in central Jakarta are more accessible due to the availability of informal transport modes. In contrast, suburban areas, particularly those far from transit lines, often struggle with longer travel times and fewer available options [17, 24].
Improving first-and-last-mile connectivity is essential in increasing public transport use, especially in developing cities like Jakarta. While many prior studies have explored mode choice, few have examined how income levels shape a developing country’s behavior of first-mile and last-mile travel modes. This research addresses this gap by analyzing how income and travel distance affect commuter mode choices in Jakarta's rail network, developing two hypotheses that investigate the related variables.
Prior studies mainly focused on factors such as station accessibility, travel distance, and multimodal integration and often overlooked income-based differences in mode choice. This research adds to the limited literature on developing cities, where income disparities significantly shape first-and-last-mile travel behavior. This study introduces a statistical model linking travel distance, income, and mode choice for first-and-last-mile connectivity in a developing country context. This research also examines the income of access and egress travel modes to commuter rail station corridors, which influences public transportation as a feeder to transit stations in suburban and urban areas. Through this study, the researchers expect the findings to contribute to the broader study on sustainable urban mobility and equitable transport planning by bridging gaps in the literature and offering insights relevant to other developing cities.
First-and-last-mile access has been a significant focus in the study of public transportation. Station spacing, walkability, bicycle infrastructure, and accessibility to transport services have all been the subjects of studies [25, 26]. The selection of access or egress modes, such as shared mobility, has been the focus of academic attention in the last few years because an integrated multimodal transportation system can increase ridership and transit scope [3, 27]. Previous studies have explored various elements influencing passengers’ first-and-last-mile access and egress mode selection, categorized as trip characteristics, passengers’ socioeconomic characteristics, specific mode characteristics, and features of the built environment, infrastructure, and station area [7, 28].
The most important considerations for passengers while selecting a method of transportation are distance, egress time, and accessibility. They typically consider walking or cycling for shorter distances, and as the distance increases, they choose public transportation [29-31]. India’s commuters rely on buses and autorickshaws for trips to metro stations that are typically longer [31].
Travel duration and frequency heavily influence the commuter’s decision-making regarding transport mode is heavily influenced. The longer the entry and exit times, the more inconvenient the travel is. Therefore, commuters are unlikely to use public transportation, especially if the travel time is too long [32, 33]. However, since intercity trips are typically much longer than intracity trips, the effect of entry and exit times on satisfaction depends primarily on the total distance traveled [34]. In this respect, the negative impact of long entry and exit times decreases for longer journeys. Furthermore, the primary mode of transport chosen influences the time factor; commuters are generally more willing to accept slower boarding and alighting times if that mode offers a significantly better level of service than other modes [15].
A rising number of studies suggests that variables like socioeconomic characteristics [2], features of a station (e.g., parking availability and its frequency), and details of a trip (e.g., travel cost and time) can influence station mode choice [35]. Those without cars often rely on public transportation and prefer to live closer to bus stops [36]. Some researchers have found that riders are more likely to ride bicycles to their stops if public transportation improves, such as reducing stops and adding more frequency [37]. Other studies have revealed that the odds of using public transportation decrease after a certain distance from a station [4, 38, 39].
Previous research on entry and exit transport choices has focused on developed countries such as the Netherlands, the United States, and China. It emphasized various modes of travel, such as bicycles and cars, and services like systematic feeders. However, only a few studies tackled this topic in developing countries in the Global South, where transport modes vary widely. In these regions, informal modes of transport, such as paratransit, play a critical role in meeting travel needs as they provide important first-and-last-mile connectivity for large parts of the population [7, 31]. Furthermore, most studies focus on the entry or exit stage, emphasizing the entry mode choice. However, connectivity on both ends of the route is important as it affects the entire transport service. Transport availability and user preferences may differ between the entry and exit stages. In summary, previous research [2, 37, 40, 41] does not mention any connection between passengers’ different destinations and their decision-making of the travel mode for commuting to public transit based on their income.
3.1 Research approach
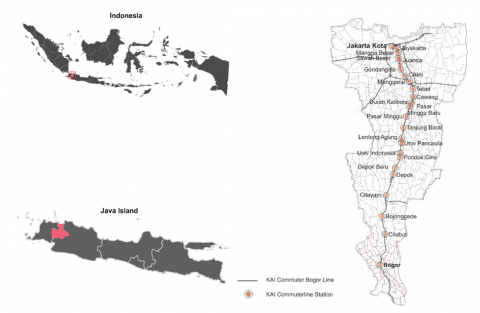
The study has two significant hypotheses. First is the conceptual relationship between income level and choice of access and egress travel mode, in which the former significantly influences the latter. Second is how travel distance significantly affects the choice of access and egress travel mode. This research focused on the Jakarta Kota–Bogor commuter rail corridor station, which includes 24 stations (Figure 1) in the Jakarta Metropolitan Area. This corridor connects the megapolitan city of Jakarta with the city of Bogor in Indonesia. Of the 24 stations, sixteen are in the Province of DKI Jakarta, while eight are in the Province of West Java. Along this line, Manggarai Station is the central transit hub for commuters transferring to other routes. Jakarta Kota Station and Bogor Station are commuters’starting and ending points.
Figure 1. Study area
3.2 Data collection
To examine the hypotheses in this study, we conducted intercept and onboard surveys to capture the commuter households’travel patterns of access and egress. This study carried out the surveys on weekdays during busy morning hours because the data used were single-purpose trips (home to destination) to analyze access and egress travel modes at the commuter rail station. The researcher intercepted commuters at 24 commuter rail stations at their trips’starting points and destinations. The researcher also surveyed those who were on board during their trip. The survey period was from June to August 2022. The researcher interviewed 1.032 respondents from 24 commuter rail stations who participated in a face-to-face household survey. The present study considered a cleared sample set of 932 (nine hundred thirty-two). The survey targeted individuals aged 18 years and above, and all data were self-reported through a structured questionnaire. Additionally, the survey occurred during morning peak hours, primarily capturing work and school commuters. This detail may underrepresent off-peak travelers, part-time workers, retirees, and leisure commuters, leading to a bias toward structured travel patterns.
3.3 Data analysis method
To model the mode choice behavior, this study used the multinomial approach. Through this approach, the researcher analyzed how income and distance influence the travel mode choice for the first-and-last-mile to the station. The modes of choice for feeder access to commuter rail stations are walking, Jaklingko, private transport, BRT, and ride-hailing. Meanwhile, the mode choices for feeder egress from the station to the final destination are walking, microtransit, Jaklingko, BRT, and ride-hailing. Jaklingko is a low-occupancy free feeder in Jakarta with a fixed route from a residential area to a station or bus terminal. As for microtransit, it is similar to Jaklingko, but it is not free; commuters must pay for its service.
Table 1. Variables description
|
Variable Name |
Description |
|
Income Above UMR |
Monthly household income above 5 million (IDR) |
|
Income Below UMR |
Monthly household income below 5 million (IDR) |
|
Distance |
Distance between origin (home) to commuter rail (access) (in km); Distance between destination and commuter rail (egress) (in km) (Derived from origin-destination location) |
This study’s independent variables (Table 1) are the travel distance (from home to station and from station to destination) and passengers’socioeconomic status. The socioeconomic (X1) variable is the household income, classified into two categories, high and low incomes, based on Indonesian minimum wages. The travel distance (X2) variable is the distance from home to station and conversely. Five dependent variables were as such: walking (Y1), private vehicle (Y2), ride-hailing (Y3), BRT (TransJakarta) (Y4), and Microtransit (JakLingko) (Y5) are the probabilities that a first-and-last-mile chooses from the commuter rail station to the destination. By definition, these three probabilities add up to 1. In these equations, xi (i=1,2,3…n) denotes the attribute of an alternative relevant to the considered choice, a1 and a2 are the intercepts, and b1, b2, ... are the coefficients of independent variables.
$\begin{gathered}\mathrm{P}(\text {Walking})= \frac{\mathrm{e}^{a_1+\mathrm{b}_1 \mathrm{x}_1}}{1+\mathrm{e}^{a_1+\mathrm{b}_1 \mathrm{x}_1}+\mathrm{e}^{a_2+\mathrm{b}_2 \mathrm{x}_1}+\mathrm{e}^{a_3+\mathrm{b}_3 \mathrm{x}_1}+\mathrm{e}^{a_4+\mathrm{b}_4 \mathrm{x}_1}}\end{gathered}$ (1)
$\begin{gathered}\mathrm{P}(\text {Jaklingko})=\frac{e^{a_2+b_2 x_1}}{1+e^{a_1+b_1 x_1}+e^{a_2+b_2 x_1}+e^{a_3+b_3 x_1}+e^{a_4+b_4 x_1}}\end{gathered}$ (2)
$\begin{gathered}\mathrm{P}(\mathrm{BRT})= \frac{e^{a_3+b_3 x_1}}{1+e^{a_1+b_1 x_1}+e^{a_2+b_2 x_1}+e^{a_3+b_3 x_1}+e^{a_4+b_4 x_1}}\end{gathered}$ (3)
$\begin{gathered}{\mathrm{P}(\text {Ride-hailing})=} \frac{e^{a_4+b_4 x_1}}{1+e^{a_1+b_1 x_1}+e^{a_2+b_2 x_1}+ e^{a_3+b_3 x_1}+ e^{a_4+b_4 x_1}}\end{gathered}$ (4)
$\mathrm{P}(\text{Private vehicle})=1-\begin{gathered}
\frac{e^{a_1+b_1 x_1}}{1+e^{a_1+b_1 x_1}+e^{a_2+b_2 x_1}+e^{a_3+b_3 x_1}+e^{a_4+b_4 x_1}}- \\
\frac{e^{a_2+b_2 x_1}}{1+e^{a_1+b_1 x_1}+e^{a_2+b_2 x_1}+e^{a_3+b_3 x_1}+e^{a_4+b_4 x_1}}- \\
\frac{e^{a_3+b_3 x_1}}{1+e^{a_1+b_1 x_1}+e^{a_2+b_2 x_1}+e^{a_3+b_3 x_1}+e^{a_4+b_4 x_1}}- \\
\frac{e^{a_4+b_4 x_1}}{1+e^{a_1+b_1 x_1}+e^{a_2+b_2 x_1}+e^{a_3+b_3 x_1}+e^{a_4+b_4 x_1}}
\end{gathered}$ (5)
4.1 First-mile and last-mile passenger characteristics
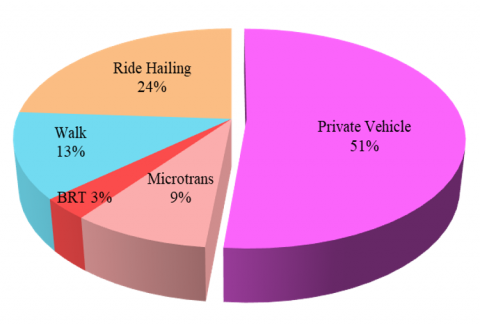
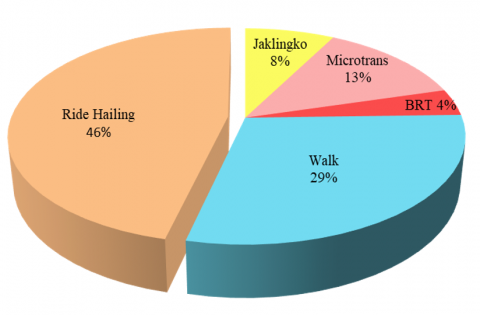
The researcher interviewed a total of 932 respondents in this study. In first-mile travel (Figure 2), the survey shows that private vehicles are the dominant mode (51%), followed by ride-hailing (24%), walking (13%), microtransit (9%), and BRT with the lowest percentage (3%). Meanwhile, ride-hailing increases significantly to 46% in last-mile travel, while walking rises to 29%, followed by microtransit (13%), Jaklingko (8%), and BRT remains low at 4%. This distinction indicates that many passengers disregarded the public feeder transport system in Greater Jakarta for first-mile trips, making them rely more on private vehicles. In contrast, in last-mile travel (Figure 3), the unreliability of public transport modes forces users to switch to more flexible but expensive ride-hailing services.
Figure 2. Mode share access-first mile
One of the significant indications of the Jakarta Metropolitan Area’s ineffective feeder system is the high dependency on private vehicles for first-mile travel, which accounts for 51% of total users. According to the feeder transport theory, an effective mode should reduce private vehicle usage by providing affordable, convenient, and reliable public transport alternatives [40]. However, in Jakarta, the survey results indicate that more than half of the passengers still use private vehicles to reach the station, demonstrating a lack of efficient feeder services. This phenomenon is also observed in other developing cities, such as Bangkok and Manila, where inadequate structured feeder services led people to opt for private vehicles or ride-hailing for their first-mile trips [42, 43]. On the contrary, in cities with well-developed feeder systems, such as Seoul and Tokyo, private vehicle usage for first-mile travel is significantly lower due to extensive and well-integrated feeder bus networks [15].
Figure 3. Mode share egress last-mile
Aside from the high dependency on private vehicles for first-mile travel, the survey also reveals that ride-hailing dominates last-mile travel, increasing from 24% to 46%. This surge reflects the inefficiency of public transport in accommodating travel from transit stations to final destinations, prompting users to rely on much more flexible and faster ride-hailing options, such as motorcycles or online taxis. According to the feeder transport theory, an integrated public transport system should provide high accessibility at a low cost. However, in the case of the Jakarta Metropolitan Area, the lack of well-structured feeder services results in excessive reliance on ride-hailing, which is unsustainable in the long run [44]. In Mumbai and Lagos, there is a similar case, where informal transport modes such as auto-rickshaws and shared taxis replace official feeder services due to the unreliability of public transit [45]. However, ride-hailing usage for last-mile trips in Singapore and Guangzhou is lower due to the well-integrated feeder buses with unified payment systems linked to MRT and BRT, making public transportation more competitive [2, 8].
The increase in walking in last-mile travel from 13% (first-mile) to 29% (last-mile) suggests that many destinations are within walking distance from transit stations. However, this percentage is still relatively low compared to other cities such as Tokyo and Hong Kong, where walking in last-mile travel reached 40-50% due to well-designed urban planning prioritizing pedestrian access [1, 46]. Furthermore, the survey shows that microtransit and Jaklingko play a more significant role in last-mile travel than first-mile travel, with microtransit usage increasing from 9% (first-mile) to 13% (last-mile); meanwhile, Jaklingko only appears in last-mile travel with an 8% share. Different from São Paulo, feeder bus integration with the primary public transport system is much better, making it a more competitive mode than ride-hailing [14].
Table 2. Access and egress and income according to modes
|
|
Walk |
Jaklingko |
Microtransit |
BRT |
Ride-Hailing |
Private Vehicle |
|
Mean |
Mean |
Mean |
Mean |
Mean |
Mean |
|
|
Access |
||||||
|
Distance (m) |
0.64 |
- |
0.52 |
0.22 |
11.96 |
20.5 |
|
Income Above UMR (IDR) |
0.59 |
- |
0.43 |
0.43 |
27.63 |
32.47 |
|
Income Below UMR (IDR) |
12.63 |
- |
0.91 |
0.91 |
17.21 |
41.11 |
|
Egress |
||||||
|
Distance (m) |
0.72 |
1.85 |
0.39 |
0.39 |
57.21 |
- |
|
Income Above UMR |
0.63 |
0.71 |
1.73 |
1.17 |
43.11 |
- |
|
Income Below UMR |
11.44 |
10.1 |
14.96 |
17.56 |
21.88 |
- |
On the other hand, the low utilization of BRT in both first-mile (3%) and last-mile (4%) travel indicates that Jakarta's TransJakarta system is not yet fully functioning as a primary feeder transport for commuter rail users. Meanwhile, in Bogotá and Mexico City, BRT systems are more well-integrated with commuter rail services, making them the preferred choice for first-mile and last-mile travel [44].
Respondents who live close to the station, within less than 300 meters, primarily use walking as their mode of transport. Respondents with 300-600 meters of distance commonly use walking and cycling, but ride-hailing services are increasingly utilized, especially at stations lacking other facilities. For respondents living 600-1,200 meters away, they no longer use active modes (walking and cycling). Instead, many opt for private motorcycles, ride-hailing, and small-capacity public transport. Private motorcycles and ride-hailing services increase significantly for respondents at longer distances (1,200-3,000 meters). Passengers only use BRT Trans Jakarta when they travel distances greater than 3,000 meters. However, private motorcycles and ride-hailing services dominate as the primary first-mile modes for passengers traveling to the station across all distance categories. The distance from respondents' homes to the station can exceed 3,000 meters, making active modes such as walking and cycling completely unused. They prefer vehicle-based modes of choice, especially private vehicles.
The transportation mode choice for respondents traveling from the station to their final destination also varies (Table 2). Respondents with destinations close to the station (within 300 meters) prefer walking, especially those who alight at Jakarta Kota Station, Manggarai Station, and Tebet Station. Meanwhile, respondents traveling 300-600 meters from the station to their final destination tend to use a mix of walking and ride-hailing, with an increase in ride-hailing usage. Motorized modes dominate 600-1,200 meters distance, primarily ride-hailing and microtransit (small public transport vehicles). Respondents traveling from the final station to their destination predominantly use ride-hailing in urban stations. In contrast, those arriving at suburban stations, such as Depok and Citayam, are more likely to use microtransit. Bus Rapid Transit (BRT) is widely used by passengers whose final destination is more than 3,000 meters from the station, although ride-hailing (both online and conventional) remains dominant.
The chart of first-mile and last-mile travel patterns along the Jakarta-Bogor commuter rail corridor reveals a critical dependency on motorized transport modes, particularly private motorcycles and ride-hailing services, due to the limited integration of public transit feeders. Private motorcycles, ride-hailing, and shared minibuses dominate the first-mile access, especially for 600-3,000 meters, while walking is only viable within a 600-meter radius of the station. Last-mile travel patterns vary, with ride-hailing services dominant in urban stations, while shared minibuses and microtransit are more prevalent in suburban stations like Depok and Citayam.
This pattern indicates a different transportation choice dynamic compared to first-mile travel, where private vehicle usage was previously high. In contrast, passengers use public transportation-based modes in last-mile travel. These modes share results for the first mile and several challenges for commuter rail users in the Jakarta Metropolitan Area’s feeder transportation system. Furthermore, this result proves that rail commuters highly depend on motorcycle-based modes for home-to-work travel behavior.
The feeder transport concept ensures efficient connectivity between residential areas and primary public transport systems, such as commuter rail and BRT in urban transportation systems. The result of the survey on first-mile travel (from origin to transit hub) and last-mile travel (from transit hub to final destination) reveals significant differences in mode choices, indicating challenges in the feeder system's integration within the Jakarta Metropolitan Area.
Based on these findings, the researcher proposed several policy recommendations to improve the efficiency of the feeder transport system in the Jakarta Metropolitan Area. First, feeder bus and microtransit services must be expanded and better integrated with commuter rail to reduce dependency on private vehicles for first-mile travel and ride-hailing for last-mile travel. Second, pedestrian infrastructure around transit stations should be improved to encourage more walking. Third, BRT connectivity with commuter rail stations must be optimized to function as a more effective feeder transport mode. Fourth, fare integration and a unified ticketing system should be implemented across commuter rail, BRT, microtransit, and Jaklingko to improve modal transfers. By adopting strategies based on the feeder transport theory, Jakarta has a high probability of reducing dependency on private vehicles and ride-hailing while at the same time creating an efficient, convenient, and sustainable public transportation system.
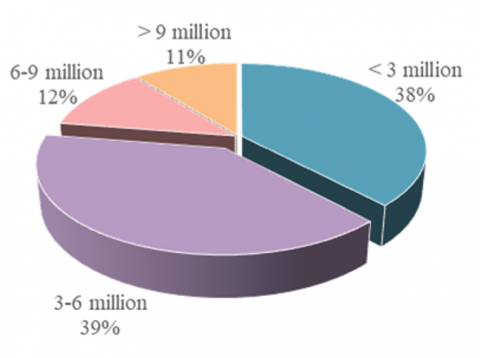
This study categorizes respondents' income based on the Jakarta Regional Minimum Wage (UMR), set at approximately 5.06 million monthly IDR in 2024. Figure 4 shows that 38% of the respondents earn below 3 million IDR, significantly below the Jakarta UMR. This group likely consists of informal sector workers, freelancers, or low-income suburban residents. Meanwhile, 39% of the respondents earn between 3 and 6 million IDR, placing them around or slightly above the Jakarta UMR. This group represents lower-middle-class workers who worked in formal sectors, such as office workers, industrial laborers, or service employees. 12% of the respondents earn between 6 and 9 million IDR, and the remaining 11% earn more than 9 million IDR; both groups have an income above the Jakarta UMR. This data indicates that while high-income individuals use commuter line transportation, they represent only a tiny portion of the total users. The chart shows that commuter rail users are predominantly from income groups earning below 6 million IDR (77%). These findings align with global urban transport studies, emphasizing that affordable and efficient last-mile connectivity is the key factor in increasing public transit ridership, particularly in developing cities where income disparities strongly influence transportation choices [2].
Figure 4. Breakdown of the respondents by income group
4.2 First-and-last-mile mode choice
The researcher used the results of the Pearson test analysis in this study to assess the fit of the current model against the saturated model, considering that the goodness-of-fit test is available for binary responses. The final result yielded a P value of 0.998, significant at a 95% confidence level. Therefore, this provides sufficient evidence that the model fits the data well. The model choice mode results show a Nagelkerke R² value of 54.2%, indicating that low income below UMR and distance explain 54.2% of the variability in transportation mode choice. Conversely, the model choice for high income above UMR has a Nagelkerke R² value of 33.5%, indicating that high income and distance only have a minor influence on travel mode.
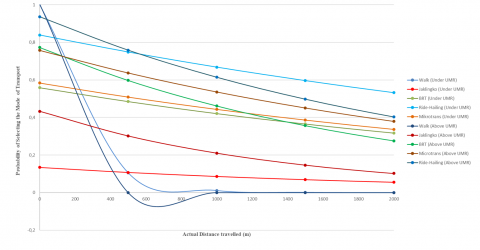
The multinomial logit model (MNL) (Table 3) presented in Figure 5 illustrates the probability of selecting various first-mile transportation modes based on income level (above or below the minimum wage/UMR) and travel distance (from home to the commuter rail station). The analysis differentiates mode choice behavior between income groups, providing insights into how economic capacity influences commuter decisions over varying distances. The transport modes examined include walking, Jaklingko (integrated microtransit), BRT, ride-hailing, and private vehicles, each showing distinct probability trends regarding distance and income level.
The results indicate that walking is the most probable mode for short distances, particularly among low-income commuters (below UMR). However, its probability declines sharply beyond 500 meters, and it is even more pronounced among higher-income commuters (above UMR), suggesting that individuals with higher income levels are less inclined to walk, even for short distances. This pattern aligns with findings from Pucher et al. [47], who observed that in Mumbai, lower-income populations tend to rely on walking for first-mile travel due to financial constraints and limited access to alternative transport options. In Dhaka [7], higher-income groups are more inclined to ride rickshaws as their travel mode choice than the lower-income groups.
Table 3. Model estimation result (Access mode choice)
|
|
Walk |
Jaklingko |
Microtransit |
BRT |
Ride-Hailing |
Private Vehicle |
|
Above UMR |
|
|
|
|
|
|
|
Income |
276.283 |
- |
193.130 |
-4.724 |
1.615 |
2.369 |
|
Distance |
-0.341 |
- |
-0.213 |
0.001 |
0.000 |
0.000 |
|
Goodness -of-fit = 1.000 |
|
|
|
|
|
|
|
Final log likehood = 68.210 |
|
|
|
|
|
|
|
-2 log likehood = 123.610 |
|
|
|
|
|
|
|
Below UMR |
|
|
|
|
|
|
|
Income |
9.994 |
- |
-0.530 |
-1.024 |
1.884 |
1.511 |
|
Distance |
-0.010 |
- |
-0.002 |
0.000 |
0.000 |
0.000 |
|
Goodness-of-fit = 0.998 |
|
|
|
|
|
|
|
Final log likehood = 234.633 |
|
|
|
|
|
|
|
-2 log likehood = 616.417 |
|
|
|
|
|
|
Table 4. Model estimation result (Egress mode choice)
|
|
Walk |
Jaklingko |
Microtransit |
BRT |
Ride-Hailing |
Private Vehicle |
|
Above UMR |
|
|
|
|
|
|
|
Income |
22.174 |
-0.027 |
1.140 |
1.223 |
2.681 |
- |
|
Distance |
-0.021 |
-0.001 |
0.000 |
-0.001 |
0.000 |
- |
|
Goodness -of-fit = 1.000 |
|
|
|
|
|
|
|
Final log likehood = 97.867 |
|
|
|
|
|
|
|
-2 log likehood = 235.083 |
|
|
|
|
|
|
|
Below UMR |
|
|
|
|
|
|
|
Income |
5.955 |
-1.865 |
0.399 |
0.235 |
1.649 |
- |
|
Distance |
-0.004 |
0.000 |
0.000 |
0.000 |
0.000 |
- |
|
Goodness-of-fit = 0.860 |
|
|
|
|
|
|
|
Final log likehood = 290.095 |
|
|
|
|
|
|
|
-2 log likehood = 742.098 |
|
|
|
|
|
|
Figure 5. Model choice of access mode choice
Figure 6. Model choice of egress mode choice
As indicated in the model, BRT usage remains relatively stable regardless of travel distance, meaning that its attractiveness does not significantly change as commuters travel farther from home. However, lower-income commuters (below UMR) use BRT more commonly than higher-income commuters (above UMR). This result suggests that BRT is perceived as an affordable but time-consuming mode, making it less appealing to wealthier commuters who prioritize speed and convenience.
Ride-hailing exhibits a strong negative correlation with distance for lower-income commuters, indicating that those earning below UMR only use ride-hailing for short first-mile trips, most likely due to cost constraints. However, higher-income commuters continue to use ride-hailing at longer distances, suggesting that affordability is a significant barrier for lower-income groups. Similar findings have been reported in Dhaka [28], where motorcycle taxis and app-based ride-hailing services primarily serve middle- and high-income passengers for first-mile travel due to their speed and ability to avoid traffic jams.
Private vehicle usage remains high among higher-income commuters across all distances, whereas for lower-income commuters, its probability declines sharply beyond 1,000 meters. This result implies that private vehicle ownership and usage correlate closely with economic status, with lower-income individuals unable to afford car or motorcycle trips for first-mile travel. Similar cases have been documented in other research [48], where higher-income commuters depend more on private vehicles for short-distance first-mile trips, primarily due to a lack of reliable feeder services and the perceived benefits of comfort, safety, and efficiency [15].
The findings from this model highlight significant contrasts in mode choice based on income and distance, revealing apparent differences in travel behavior between higher- and lower-income commuters. Lower-income commuters rely more on walking, Jaklingko, and BRT, while higher-income commuters are likelier to use private vehicles and ride-hailing services for first-mile travel. These contrasts emphasize the need for targeted policies to improve feeder transport accessibility, affordability, and efficiency. Enhancing microtransit services such as Jaklingko to serve longer distances, improving pedestrian infrastructure to encourage walking, and integrating BRT with commuter rail through better connectivity and scheduling are critical in reducing reliance on private vehicles and ride-hailing services. Policies like fare integration across ride-hailing and public transport or demand-based pricing mechanisms for private vehicle use could also help to balance mode choice behavior and promote sustainable first-mile travel.
The last-mile mode (Table 4) for the low-income group (below UMR) results show a Nagelkerke R² value of 56.1%, and the model choice for income above UMR shows a Nagelkerke R² value of 59%, indicating that income and distance influence travel mode. Figure 6 shows the probability of last-mile mode choice towards the final destination. The probability of walking as a last-mile mode is high at short distances, particularly under 400 meters, but declines rapidly as distance increases. The decline is also rapid among higher-income commuters (above UMR), suggesting a greater reluctance to walk than lower-income commuters (below UMR). This finding aligns with previous research, where low-income commuters depend on walking due to cost constraints and limited access to affordable transport alternatives [2].
Jaklingko, as an integrated microtransit service, demonstrates a low probability for last-mile travel, particularly among lower-income commuters (below UMR), and this probability decreases further with increasing distance. This result suggests that commuters do not perceive Jaklingko as an efficient feeder mode for last-mile connectivity, likely due to the limited service coverage, inconsistent frequencies, and lack of direct integration with rail stations. The probability of selecting BRT as a last-mile mode remains relatively stable across distances, with higher adoption among lower-income commuters (below UMR). However, the data indicate that BRT is not a dominant last-mile choice, suggesting that passengers may not view it as a convenient feeder option. In Jakarta, the low probability of BRT for last-mile trips may indicate poor connectivity, lack of direct feeder routes, or perceived inconvenience compared to other modes. Addressing these issues through dedicated last-mile BRT feeders or improved transfer facilities could increase BRT’s role as a viable last-mile option [21].
Ride-hailing services exhibit a significant contrast in adoption between income groups. Higher-income commuters (above UMR) consistently prefer ride-hailing services even at longer distances. However, lower-income commuters (below UMR) experience a sharp decline in ride-hailing probability as distance increases. These findings suggest that ride-hailing remains an expensive and financially restrictive option for lower-income individuals, but higher-income commuters highly favor it because of its convenience and speed. For Jakarta, integrating ride-hailing into public transport networks through fare subsidies, shared ride incentives, or designated pick-up zones could improve accessibility and affordability for last-mile travel [21, 48].
Microtransit, an alternative feeder mode, demonstrates a gradual decline in probability over increasing distances, but it is used relatively evenly across income groups. This result suggests that microtransit remains accessible for low- and high-income commuters, making it a versatile last-mile option. However, its probability does not dominate other modes, indicating competition from ride-hailing among higher-income users and walking among lower-income users.
For private vehicles, high-income individuals use them more frequently, with probabilities reaching up to 60%, and they continue to use them for distances of up to 2 kilometers with a probability of 20%. On the contrary, low-income individuals tend to abandon private vehicles for longer trips. Meanwhile, ride-hailing services are the most stable mode for high-income groups, maintaining a probability of >50% even for distances beyond 2 kilometers. However, ride-hailing is highly sensitive to low-income groups, who reduce their usage of online transport services after 800 meters.
The analysis of first-mile and last-mile graphs indicates that travel distance and income level are crucial in mode choice. For short distances (0-400 meters), walking is the primary mode, particularly for low-income individuals, with a 100% probability at the starting point, which declines sharply after 400 meters. In contrast, high-income individuals often continue walking up to around 800 meters before switching to another mode. For medium to long distances (800 meters to 5 kilometers), online ride-hailing services and private vehicles have become the preferred modes, especially among individuals earning above UMR, with a probability of up to 70% at 5 kilometers. Meanwhile, Bus TransJakarta remains a stable mode used by both income groups, with a probability ranging between 30% and 40% across various distances.
Studies on passengers’ choice of station have found that while some opt for the nearest one, others are willing to travel further to access other stations that offer better services [29]. Public transit stations’ characteristics, such as availability of parking, frequency of service, location, and type of the station, significantly influence access mode and station choice [40, 41]. The aforementioned studies assumed individuals have similar access modes and station choice preferences. However, it is possible to have diversity in preferences for travel decisions, including access modes and station choice, which means that individuals may prioritize specific factors, such as travel time or features of the built environment, differently based on their unique circumstances [49]. When measuring modality style, populations can be classified based on sociodemographic characteristics influencing travel mode choices [50].
These findings align with Meng et al.’s research [2] on home-based public transport trips in Singapore. The study highlighted that accessibility is the primary factor influencing first-mile mode choice, whereas parking fees impact first-mile mode decisions. The study also found that individuals opt for walking for shorter distances and prefer public transportation and private vehicles for longer trips. Additionally, research conducted at Dhaka [7] indicates that higher-income individuals rely more on rickshaws as a non-motorized mode for commuting. However, contrary to this study’s findings, higher-income groups use non-motorized modes for access and egress stages more than lower-income groups. This study proves that socioeconomic factors like income correlated strongly with public transport choice modes.
Travel distance and income level are key factors in transport mode selection in first-and-last-mile contexts. Strategies to enhance accessibility and integrate transportation modes should consider these factors to improve travel efficiency and convenience across different population groups. Expanding feeder transport services is essential in improving first-mile and last-mile connectivity. Increasing the coverage and frequency of microtransit and BRT services can reduce dependency on private vehicles and improve station access. Better integration of feeder services with commuter rail, such as dedicated feeder bus stops and seamless transfers, would encourage greater use of public transport. Enhancing pedestrian infrastructure is also crucial; wider sidewalks, pedestrian crossings, and covered walkways near stations can promote walking as a more viable first-mile and last-mile mode, especially for shorter trips.
This study focuses on income level and travel distance as key socioeconomic factors in mode choice, but other variables such as age, gender, and employment status may also influence decisions. Women and elderly commuters, for example, may have different safety and accessibility needs. Future research should incorporate a broader range of sociodemographic factors for a more comprehensive analysis. This study is limited to Jakarta’s commuter rail system, making it less applicable to cities with different urban layouts, transport networks, or socioeconomic conditions. However, comparative studies across multiple cities could provide insights into how regional factors shape first-mile and last-mile travel.
Lastly, this study does not explore the impact of transport policies, infrastructure investments, or technological innovations such as ride-sharing platforms, e-scooters, and sustainable mobility solutions. Future research could assess how these advancements influence commuters’ behavior and improve first-mile and last-mile connectivity.
This study examines the influence of income level and travel distance on first-mile and last-mile mode choices among Jakarta commuter rail users. The findings reveal that socioeconomic status significantly affects transport decisions, with lower-income commuters relying more on cost-effective modes such as walking, microtransit, and BRT. At the same time, higher-income groups prefer private vehicles and ride-hailing services. Travel distance further influences mode selection, with walking being dominant for short trips but quickly declining in favor of motorized modes as distance increases.
The findings of this study provide several insights for future regulations. First, commuters use rail mode for access and egress to travel longer distances, consistent with prior studies. However, the results also imply that commuter trips on the egress stage are relatively longer in terms of time and distance, further distinguishing our findings from those of other metropolitan regions. The increased travel time in the egress stage indicates an inadequacy in the commuter transit system.
Secondly, the connectivity between rail terminals and feeder services is crucial in improving rail service. Commuting by train, an efficient alternative to the bus, might alleviate traffic jams. Nevertheless, this research reveals that the commuter train is infeasible for the last mile, which is impractical for commuters due to the prolonged trip duration. The model for mode choice indicates that rail commuters possibly rely more on motorized transit (MT) mode to reach their destination. A well-integrated service across MT and rail modes might facilitate the availability of effective last-mile connectivity. Bus services such as microtransit, paratransit, and Jaklingko are proven inconsistent and inefficient, having zero designated stops at or close to rail stations. As a result, commuters are forced to walk more to access these modes, further increasing transfer times. Implementing feeder services across rail stations and busy business districts could be feasible. Additionally, establishing designated stops for microtransit, paratransit, and Jaklingko near rail stations would improve the accessibility of feeder services and decrease trip durations.
Lastly, paratransit services are fundamental to Jakarta's transportation system. The findings of this study indicate that many suburban commuters, particularly high-income individuals, depend on them. Therefore, restricting paratransit services without alternative options is unacceptable from the perspective of inclusive transportation. Additionally, tariff structures and regulatory policies should be mindful of affordability and passenger price sensitivity. By doing so, Jakarta can have a more inclusive, efficient, and sustainable commuter rail system, reducing dependency on private vehicles and promoting greater use of public transportation for first-mile and last-mile connectivity.
This paper is part of doctoral research at Universitas Diponegoro and is supported by the Department of Civil Engineering, Universitas Trisakti. Funding was supported by Universitas Trisakti (Grant No.: 0615/PDP/FTSP-LPPM/VII/2024) and Departemen Teknik Sipil, Fakultas Teknik Sipil dan Perencanaan Universitas Trisakti, funded the APC.
[1] Chakraborty, A., Sen, S., Pal, S., Maitra, B. (2025). Priority areas of intervention for development of walking, bicycling and motorized feeder facilities as first-and-last mile connectivity with metro stations. Transportation Research Procedia, 82: 175-194. https://doi.org/10.1016/j.trpro.2024.12.036
[2] Meng, M., Koh, P.P., Wong, Y.D. (2016). Influence of socio-demography and operating streetscape on last-mile mode choice. Journal of Public Transportation, 19(2): 38-54. http://doi.org/10.5038/2375-0901.19.2.3
[3] Venter, C.J. (2020). Measuring the quality of the first/last mile connection to public transport. Research in Transportation Economics, 83: 100949. https://doi.org/10.1016/j.retrec.2020.100949
[4] Krygsman, S., Dijst, M., Arentze, T. (2004). Multimodal public transport: An analysis of travel time elements and the interconnectivity ratio. Transport Policy, 11(3): 265-275. https://doi.org/10.1016/j.tranpol.2003.12.001
[5] Oeschger, G., Caulfield, B., Carroll, P. (2025). User characteristics and preferences for micromobility use in first- and last-mile journeys in Dublin, Ireland. Travel Behaviour and Society, 38: 100926. https://doi.org/10.1016/j.tbs.2024.100926
[6] Halldórsdóttir, K., Nielsen, O.A., Prato, C.G. (2017). Home-end and activity-end preferences for access to and egress from train stations in the Copenhagen region. International Journal of Sustainable Transportation, 11(10): 776-786. https://doi.org/10.1080/15568318.2017.1317888
[7] Rahman, M., Akther, M.S., Recker, W. (2022). The first-and-last-mile of public transportation: A study of access and egress travel characteristics of Dhaka’s suburban commuters. Journal of Public Transportation, 24: 100025. https://doi.org/10.1016/j.jpubtr.2022.100025
[8] Zhao, S.C., Wu, N., Wang, X.Z. (2018). Impact of feeder accessibility on high-speed rail share: Wuhan–Guangzhou Corridor, China. Journal of Urban Planning and Development, 144(4): 1-8. https://doi.org/10.1061/(ASCE)UP.1943-5444.0000475
[9] Liu, L.M., Kong, H., Liu, T.L., Ma, X.L. (2022). Mode choice between bus and bike-sharing for the last-mile connection to urban rail transit. Journal of Transportation Engineering, Part A: Systems, 148(5): 1-9. https://doi.org/10.1061/JTEPBS.0000663
[10] Jehle, U., Coetzee, C., Büttner, B., Pajares, E., Wulfhorst, G. (2022). Connecting people and places: Analysis of perceived pedestrian accessibility to railway stations by Bavarian case studies. Journal of Urban Mobility, 2: 100025. https://doi.org/10.1016/j.urbmob.2022.100025
[11] Calabrò, G., Le Pira, M., Inturri, G., Ignaccolo, M., Pluchino, A. (2023). A simulation-optimization approach to solve the first and last mile of mass rapid transit via feeder services. Transportation Research Procedia, 69: 767-774. https://doi.org/10.1016/j.trpro.2023.02.234
[12] Basbas, S., Papagiannakis, A., Baraklianos, I., Nikiforiadis, A., Campisi, T. (2023). Does gender matter in daily urban mobility? Exploring travel perceptions, attitudes, and behaviours. International Journal of Transport Development and Integration, 7(2): 67-75. https://doi.org/10.18280/ijtdi.070201
[13] Aderibigbe, O.O., Gumbo, T. (2022). Influence of socio-economic attributes on travel behaviour in the rural areas of Nigeria: Towards a sustainable rural planning and development. Urban, Planning and Transport Research, 10(1): 181-199. https://doi.org/10.1080/21650020.2022.2072946
[14] Costa, P.C., Cunha, C.B., Arbex, R.O. (2021). A simulation-optimization model for analyzing a demand responsive transit system for last-mile transportation: A case study in São Paulo, Brazil. Case Studies on Transport Policy, 9(4): 1707-1714. https://doi.org/10.1016/j.cstp.2021.06.019
[15] Eom, J.K., Lee, K.S., Lee, J. (2023). Exploring micromobility mode preferences for last-mile trips from subway stations. Journal of Public Transportation, 25: 100054. https://doi.org/10.1016/j.jpubtr.2023.100054
[16] Andani, I.G.A., La Paix Puello, L., Geurs, K. (2021). Modelling effects of changes in travel time and costs of toll road usage on choices for residential location, route and travel mode across population segments in the Jakarta-Bandung region, Indonesia. Transportation Research Part A: Policy and Practice, 145:81-102. https://doi.org/10.1016/j.tra.2020.12.012
[17] Dharmowijoyo, D.B.E., Susilo, Y.O., Karlström, A. (2016). Relationships among discretionary activity duration, its travel time spent and activity space indices in the Jakarta Metropolitan Area, Indonesia. Journal of Transport Geography, 54: 148-160. https://doi.org/10.1016/j.jtrangeo.2016.05.012
[18] Yudhistira, M.H., Indriyani, W., Pratama, A.P., Sofiyandi, Y., Kurniawan, Y.R. (2019). Transportation network and changes in urban structure: Evidence from the Jakarta Metropolitan Area. Research in Transportation Economics, 74: 52-63. https://doi.org/10.1016/j.retrec.2018.12.003
[19] Hasibuan, H.S., Sodri, A., Harmain, R. (2021). The carrying capacity assessment of two MRTStations transit-oriented development areas in Jakarta. Indonesian Journal of Geography, 53(1): 78-86. https://doi.org/10.22146/ijg.51968
[20] Martinez, R., Masron, I.N. (2020). Jakarta: A city of cities. Cities, 106: 102868. https://doi.org/10.1016/j.cities.2020.102868
[21] Benita, F. (2023). Exploring non-mandatory travel behavior in Jakarta City: Travel time, trip frequency, and socio-demographic influences. Transportation Research Interdisciplinary Perspectives, 21: 100896. https://doi.org/10.1016/j.trip.2023.100896
[22] Berawi, M.A., Saroji, G., Iskandar, F.A., Ibrahim, B.E., Miraj, P., Sari, M. (2020). Optimizing land use allocation of transit-oriented development (TOD) to generate maximum ridership. Sustainability, 12(9): 3798. https://doi.org/10.3390/su12093798
[23] Ellisa, E., Ramadityo, R. (2019). Spatial development and utilization of public spaces in surrounding commuter line stations. WIT Transactions on The Built Environment, 182: 253-265. https://doi.org/10.2495/UT180241
[24] Hasibuan, H.S., Permana, C.T. (2022). Socio-cultural characteristics of people and the shape of transit-oriented development (TOD) in Indonesia: A mobility culture perspective. Journal of Transport and Land Use, 15(1): 295-314. https://doi.org/10.5198/jtlu.2022.1997
[25] Liu, Z.L., Jia, X.D., Cheng, W. (2012). Solving the last mile problem: Ensure the success of public bicycle system in Beijing. Procedia - Social and Behavioral Sciences, 43: 73-78. https://doi.org/10.1016/j.sbspro.2012.04.079
[26] Zuo, T., Wei, H., Chen, N., Zhang, C. (2020). First-and-last mile solution via bicycling to improving transit accessibility and advancing transportation equity. Cities, 99: 102614. https://doi.org/10.1016/j.cities.2020.102614
[27] Shaheen, S., Chan, N. (2016). Mobility and the sharing economy: Potential to facilitate the first-and last-mile public transit connections. Built Environment, 42(4): 573-588. https://doi.org/10.2148/benv.42.4.573
[28] Rahman, M.H., Sadeek, S.N., Ahmed, A., Rifaat, S.M., Abrar, M. (2021). Effect of socio-economic and demographic factors on ride-sourcing services in Dhaka City, Bangladesh. Transportation Research Interdisciplinary Perspectives, 12: 100492. https://doi.org/10.1016/j.trip.2021.100492
[29] Givoni, M., Rietveld, P. (2007). The access journey to the railway station and its role in passengers’ satisfaction with rail travel. Transport Policy, 14(5): 357-365. https://doi.org/10.1016/j.tranpol.2007.04.004
[30] Bergman, Å., Gliebe, J., Strathman, J. (2011). Modeling access mode choice for inter-suburban commuter rail. Journal of Public Transportation, 14(4): 23-42. https://doi.org/10.5038/2375-0901.14.4.2
[31] Goel, R., Tiwari, G. (2016). Access-egress and other travel characteristics of metro users in Delhi and its satellite cities. IATSS Research, 39(2): 164-172. https://doi.org/10.1016/j.iatssr.2015.10.001
[32] Cervero, R. (2001). Walk-and-ride: Factors influencing pedestrian access to transit. Journal of Public Transportation, 3(4): 1-23. https://doi.org/10.5038/2375-0901.3.4.1
[33] Gutiérrez, J., Cardozo, O.D., García-Palomares, J.C. (2011). Transit ridership forecasting at station level: An approach based on distance-decay weighted regression. Journal of Transport Geography, 19(6): 1081-1092. https://doi.org/10.1016/j.jtrangeo.2011.05.004
[34] Oeschger, G., Caulfield, B., Carroll, P. (2023). Investigating the role of micromobility for first- and last-mile connections to public transport. Journal of Cycling and Micromobility Research, 1: 100001. https://doi.org/10.1016/j.jcmr.2023.100001
[35] Young, M., Blainey, S. (2018). Railway station choice modelling: A review of methods and evidence. Transport Reviews, 38(2): 232-251. https://doi.org/10.1080/01441647.2017.1326537
[36] Beimborn, E.A., Greenwald, M.J., Jin, X. (2003). Accessibility, connectivity, and captivity: Impacts on transit choice. Transportation Research Record: Journal of the Transportation Research Board, 1835(1): 1-9. https://doi.org/10.3141/1835-01
[37] Ton, D., Shelat, S., Nijënstein, S., Rijsman, L., van Oort, N., Hoogendoorn, S. (2020). Understanding the role of cycling to urban transit stations through a simultaneous access mode and station choice model. Transportation Research Record: Journal of the Transportation Research Board, 2674(8): 823-835. https://doi.org/10.1177/0361198120925076
[38] Shao, C.Y., Xia, J.C., Lin, T.G., Goulias, K.G., Chen, C.M. (2015). Logistic regression models for the nearest train station choice: A comparison of captive and non-captive stations. Case Studies on Transport Policy, 3(4): 382-391. https://doi.org/10.1016/j.cstp.2015.06.002
[39] Cervero, R. (2007). Transit-oriented development’s ridership bonus: A product of self-selection and public policies. Environment and Planning A: Economy and Space, 39(9): 2068-2085. https://doi.org/10.1068/a38377
[40] Givoni, M., Rietveld, P. (2014). Do cities deserve more railway stations? The choice of a departure railway station in a multiple-station region. Journal of Transport Geography, 36: 89-97. https://doi.org/10.1016/j.jtrangeo.2014.03.004
[41] Chakour, V., Eluru, N. (2014). Analyzing commuter train user behavior: A decision framework for access mode and station choice. Transportation, 41(1): 211-228. https://doi.org/10.1007/s11116-013-9509-y
[42] Iamtrakul, P., Chayphong, S. (2023). Challenges of sustainable mobility: Context of car dependency, suburban areas in Thailand. Geographica Pannonica, 27(2): 145-158. https://doi.org/10.5937/gp27-42183
[43] Fillone, A., Mateo-Babiano, I. (2018). Do I walk or ride the rickshaw? Examining the factors affecting first- and last-mile trip options in the historic district of Manila (Philippines). Journal of Transport and Land Use, 11(1): 237-254. https://doi.org/10.5198/jtlu.2018.1077
[44] Cervero, R., Dai, D. (2014). BRT TOD: Leveraging transit oriented development with bus rapid transit investments. Transport Policy, 36: 127-138. https://doi.org/10.1016/j.tranpol.2014.08.001
[45] Kandt, J. (2018). Heterogeneous links between urban form and mobility: A comparison of São Paulo, Istanbul and Mumbai. Journal of Transport and Land Use, 11(1): 721-745. https://doi.org/10.5198/jtlu.2018.1359
[46] Zhang, M. (2004). The role of land use in travel mode choice: Evidence from Boston and Hong Kong. Journal of the American Planning Association, 70(3): 344-360. https://doi.org/10.1080/01944360408976383
[47] Pucher, J., Korattyswaroopam, N., Ittyerah, N. (2004). The crisis of public transport in India: Overwhelming needs but limited resources. Journal of Public Transportation, 7(4): 1-20. https://doi.org/10.5038/2375-0901.7.4.1
[48] Sunitiyoso, Y., Rahayu, W.A., Nuraeni, S., Nurdayat, I.F., Pambudi, N.F., Hadiansyah, F. (2022). Role of ride-hailing in multimodal commuting. Case Studies on Transport Policy, 10(2): 1283-1298. https://doi.org/10.1016/j.cstp.2022.04.013
[49] Vij, A., Carrel, A., Walker, J.L. (2013). Incorporating the influence of latent modal preferences on travel mode choice behavior. Transportation Research Part A: Policy and Practice, 54: 164-178. https://doi.org/10.1016/j.tra.2013.07.008
[50] Keskisaari, V., Ottelin, J., Heinonen, J. (2017). Greenhouse gas impacts of different modality style classes using latent class travel behavior model. Journal of Transport Geography, 65: 155-164. https://doi.org/10.1016/j.jtrangeo.2017.10.018