Buseif O.M Mahashhash*![]() | Nur Izzi Md. Yusoff
| Nur Izzi Md. Yusoff![]() | Muhamad Razuhanafi Mat Yazid
| Muhamad Razuhanafi Mat Yazid![]() | Muhammad Ali Mubaraki
| Muhammad Ali Mubaraki![]() | Sri Atmaja P. Rosyidi
| Sri Atmaja P. Rosyidi![]()
© 2023 IIETA. This article is published by IIETA and is licensed under the CC BY 4.0 license (http://creativecommons.org/licenses/by/4.0/).
OPEN ACCESS
Road traffic collisions (RTCs) represent a significant public health challenge, particularly in countries with elevated mortality rates from such incidents. In Libya, the scarcity of digitized RTC data hampers robust analysis and subsequent intervention strategies. This study aims to bridge this gap by meticulously transforming over 2,300 hard-copy RTC reports from the Ajdabiya Traffic Police Department archives into a structured electronic database. For this analysis, 1,255 rural freeway incidents were scrutinized using a Binary logit model (BLM) to ascertain determinants of injury severity. It was found that head-on collisions, elevated speeds, the use of private cars, and weekend incidents markedly increased the likelihood of severe injuries. Examination of investigative reports disclosed a significant deficiency in traffic safety awareness among enforcement personnel, coupled with suboptimal law enforcement. To augment road safety in Libya, the enforcement of traffic laws, speed regulation, and activation of emergency medical services are identified as primary interventions. Additionally, the establishment of an integrated, multi-source database is imperative to advance traffic safety research and policy development.
injury severity, Libya, logistic regression, road traffic mortality, rural freeway, traffic crash, road safety
The escalating rates of fatalities and injuries associated with Road Traffic Collisions (RTCs) have escalated road safety into a pressing global issue. Developing countries, particularly those rich in Eastern Mediterranean resources, are witnessing a surge in RTC-related death rates. As depicted in Figure 1, Libya has reported the second-highest road traffic mortality rate among these countries. With an estimated death rate of 26.1 per 100,000 population in 2018 [1], RTCs in Libya account for 11% of all hospital deaths, becoming the third leading cause of hospital morbidity [2]. Therefore, the identification and understanding of primary factors related to RTC injury severity are fundamental in tackling this issue, given its significant contribution to injury, death, and economic loss.
A multitude of research efforts, particularly in developed countries, have been dedicated to discerning the factors associated with RTC severity. Comprehensive literature reviews, such as the one conducted by Christoforou et al. [3], have demonstrated that certain factors are intrinsically linked to increased RTC injury severity. Concurrently, other factors have been associated with a decrease in injury severity, while the effects of some remain controversial. Interestingly, Garrido et al. [4] observed that the influence of certain factors on RTC injury severity varies across countries, likely due to differences in enforced laws, driver behavior, and vehicle fleets.
Figure 1. Traffic road death rate per100k in Eastern Mediterranean-rich countries [1]
Despite RTC death rates in Libya being more than three times that of the European Union [2], there is a paucity of studies focusing on RTCs within the country. The initial efforts to study traffic accidents in Libya were taken by Makki in the early 1980s, who based his studies [5, 6] on summary statistical reports issued by the Traffic and Licensing Department (containing information such as population, number of vehicles, number of accidents, number of deaths and number of infections). Subsequent research, including studies by Hamza [7] and Belker and Bensaleh [8], also relied on these statistical reports. More recent studies, such as the one by Yahya and Ismail [9], analyzed traffic accidents in Libya using accident statistics reports issued by the Traffic and Licensing Office in Tripoli. The only deviation in data source was observed in the second part of Hamza's study [7], where injury patterns were examined using a sample of car occupants gathered through questionnaires and medical records.
Previous analyses by Makki [6], Hamza [7], Belker and Bensaleh [8] and Yahya and Ismail [9] employed a simple linear regression model, considering only two independent factors (population and number of vehicles). It should be noted that Makki [5] and the second part by Hamza [7] were merely descriptive studies, as tabulation and the chi-square test were used to achieve the rest of the study's objectives.
All regression analysis results indicated a correlation between the increasing vehicle number and increasing crash rates and severity; also, there is a linear link between population and deaths. Only analysis result in Yahia and Ismail [9] population factor was insignificant. Compared to the investigated developing countries, Libya has been found to have the highest rate of road fatalities among the countries investigated [6].
Descriptive studies further revealed that RTCs are one of the leading causes of death, especially among males aged 15-25 years, and account for nearly half of all deaths on main coastal roads, which are inadequately equipped with ambulance services [5]. Additionally, only 8.2% of drivers and 7% of front-seat passengers were found to be wearing seatbelts; 53% of unbelted drivers sustained head and neck injuries (neck and head trauma), and 93% of those injuries were transported to the hospital by private cars without receiving first aid at the scene of the accidents [7].
A review of the literature highlights the limited scope and data inadequacy of injury studies in Libya. The illogical is that the previous studies only relied on two independent factors (i.e., population and the number of vehicles), which rendered the linear regression model incapable of explaining the actual state of the problem. In conclusion, no previous study using detailed and reliable crash data has been implemented.
To address this gap, the present study employs a logistic regression model (i.e., BLM) to investigate the factors influencing injury severity in RTCs occurring on the rural freeways of Ajdabiya, Libya. The model utilizes detailed and reliable data extracted from relevant RTC investigation reports.
2.1 Data collection
Reliable and accurate data regarding the circumstances of RTCs, road geometry, traffic characteristics, and the weather should be used to guarantee the success of any traffic safety study. The scarcity of such studies in Libya could be attributed to the lack of a comprehensive database for such information. Due to this limitation, the RTCs database was constructed based on a study area with an RTCs data archive that could reflect the state of traffic safety in the country. As it was not feasible to develop a detailed state-level database, The rural freeway roads located in the municipality of Ajdabiya (i.e., El Brega Road, Tobruk Road, El Kufra Road, Benghazi Road, and Maradah Road) were selected as a representative of the road traffic safety situation in Libya given their geographical location importance, functioning to link the east to the west and the north to the south, and the availability of a full investigation reports archive at Ajdabiya Traffic Police Department.
Traffic crash data were extracted from 2,328 handwritten RTCs investigation reports for both urban and rural freeway crashes from the year 2001 to 2010. A manual transcribing methodology was adopted to establish the RTCs database from these reports since data mining (i.e., software) was not feasible as they were written in the Arabic language. Initially, data was collected separately for each year (2001 to 2010). The ten years were merged into one Excel file to build the database, then translated into English, classified, and coded. Data merging and translation processes resulted in some duplicate cases and the emergence of structural errors discovered during data cleaning using IBM SPSS Statistics 22 software. Duplicate cases were removed, and coding errors were corrected. Accident severity (dependent variable) was defined as a binary variable representing two levels of injury severity (0 or 1). No outliers of accident severity were observed, and no missing data was found since the data was collected on a case-by-case basis using the police report number.
The database was organized based on the chronological and spatial data of RTCs. Various factors related to the general information on collision, such as vehicle, driver, and passenger(s) information and the injury severity, as stated in the accompanying medical reports, were used to describe each case. Meanwhile, the traffic data, road geometry, and pavement information were excluded due to the absence of such information and a database at the Road Authority in Libya.
2.2 Data sample
According to the raw data obtained, despite only 53% of RTCs occurring on the rural freeways, they recorded more than 80% of overall deaths. Therefore, only 1,255 crash cases that occurred on the rural freeways were considered in this study. The rural freeway data sample revealed that 67.65% (i.e., two-thirds) of RTCs are solely single-vehicle crashes.
2.3 Descriptive analysis of data sample
Crash severity is the level of injury a victim is exposed to in a traffic crash and can be classified in several ways. Typically, the KABCO scale is used to classify the injury levels: fatal injury (K), incapacitating injury (A), non-incapacitating injury (B), minor injury (C), and property damage-only injury (O). Nevertheless, in states with a large area, long roads, and low traffic volume, crash data usually have very low frequencies for some of the categories of the KABCO scale. Therefore, combining fatal and severe injury could prove useful in identifying prevalent risk factors [10].
In this study, the KABCO scale for injury severity in road traffic crashes was defined as a binary variable of two levels of injury: 1) non-severe injury=0 and 2) severe injury or fatal =1. In other words, the dichotomous classification was conducted by classifying the response variable as a binary target variable to ensure decreased bias via selection [11].
The variable descriptions are shown in Table 1, and all binary predictors were reasonable with a 0/1 code, no data were missing, and the continuous variable revealed a reasonable range. We also looked at how a continuous variable (Driver age) related to accident severity and found no discernible effect (Table 2). However, the following analysis employed driver age as a control variable.
Table 1. Descriptive statistics of explanatory variables
|
Variable |
Code |
Description / Value |
Number of Traffic Crashes |
Number of Severe Crashes |
Percentage of Severe Crashes (%) |
|
Severity |
SACC |
Non-severe injury = 0 |
746 |
|
59.4 |
|
Severe injury or fatal = 1 |
509 |
|
40.6 |
||
|
Days of week |
WE |
Weekdays = 0 |
1089 |
||
|
Weekend = 1 |
166 |
95 |
57.2 |
||
|
Day time |
TIM |
Day time = 0 |
735 |
||
|
Night = 1 |
520 |
268 |
51.5 |
||
|
Level grade |
LGRA |
Not level = 0 |
690 |
|
|
|
Level = 1 |
565 |
299 |
52.9 |
||
|
Horizontal alignment |
HALL |
Straight = 0 |
1102 |
||
|
H-curve = 1 |
153 |
92 |
60.1 |
||
|
Rollover collision |
AROV |
No rollover collision = 0 |
615 |
||
|
Rollover collision = 1 |
640 |
329 |
51.4 |
||
|
Animal collision |
AANI |
No animal collision = 0 |
1104 |
||
|
Animal collision = 1 |
151 |
49 |
32.5 |
||
|
Head-on collision |
AHON |
No head-on collision = 0 |
1125 |
||
|
Head-on collision = 1 |
130 |
104 |
80.0 |
||
|
Rear-end collision |
AREN |
No rear-end collision = 0 |
1146 |
||
|
Rear-end collision = 1 |
109 |
36 |
33.0 |
||
|
Sideswipe-o collision |
ASSO |
No sideswipe collision = 0 |
1168 |
||
|
Sideswipe collision = 1 |
87 |
52 |
59.8 |
||
|
Human cause factor |
CHUM |
No human cause = 0 |
886 |
||
|
Human cause = 1 |
369 |
194 |
52.6 |
||
|
Tyre burst cause factor |
CTIR |
No tyre burst cause = 0 |
971 |
||
|
Tyre burst cause = 1 |
284 |
154 |
54.2 |
||
|
Driver speed cause factor |
CDSP |
No driver speed cause = 0 |
1023 |
||
|
Driver speed cause = 1 |
232 |
146 |
62.9 |
||
|
Animal cause factor |
CANI |
No animal cause = 0 |
1085 |
||
|
Animal cause = 1 |
170 |
54 |
31.8 |
||
|
Weather cause factor |
CWEA |
No weather cause = 0 |
1158 |
||
|
Weather cause = 1 |
97 |
51 |
52.6 |
||
|
Roadways' defects* |
CROA |
No road cause = 0 |
1193 |
||
|
Road cause = 1 |
62 |
34 |
54.8 |
||
|
Vehicle cause factor |
CVEH |
No vehicle cause = 0 |
1214 |
||
|
Vehicle cause = 1 |
41 |
13 |
31.7 |
||
|
Private car** |
VPRV |
No Private car = 0 |
636 |
||
|
Private car = 1 |
619 |
361 |
58.3 |
||
|
Minibus** |
VMIN |
No minibus = 0 |
1098 |
||
|
Minibus = 1 |
157 |
80 |
51.0 |
||
|
Tractor-trailer** |
VTRC |
No tractor-trailer = 0 |
1105 |
||
|
Tractor-trailer = 1 |
150 |
45 |
30.0 |
||
|
Van** |
VVAN |
No van = 0 |
1155 |
||
|
Van = 1 |
100 |
54 |
54.0 |
||
|
* - Roadways' defects include potholes, bumps, skiddy surfaces, pavement edge, road faults, blow-ups, spalling. ** - Vehicles were classified depending on use, passengers transport, commodities, or for private purposes. |
|||||
Table 2. Continuous variable (driver's age) distributions by injury severity
|
Severity |
Variable |
No |
Mean |
Sd |
Min |
p25 |
p50 |
p75 |
Max |
|
No severity |
AGE |
609.00 |
36.71 |
11.39 |
17.00 |
28.00 |
34.00 |
44.00 |
74.00 |
|
Severity |
AGE |
646.00 |
36.84 |
12.06 |
14.00 |
28.00 |
34.00 |
44.00 |
74.00 |
|
Total |
AGE |
1255.00 |
36.77 |
11.74 |
14.00 |
28.00 |
34.00 |
44.00 |
74.00 |
2.4 Logistic regression analysis
Several techniques have been used to assess the injury severity caused by RTCs, with the commonly implemented being the BLM, ordered logit model, and hierarchical logit model. Nevertheless, BLM has been frequently used for injury severity assessment when the severity is defined as a discrete outcome with two possible categories. Road safety researchers prefer this modelling method because the logistic function is between 0 and 1, which is not ordinarily the situation with other possible functions [12]. Moreover, the frequent use of BLMs to analyse crash severity could also be because BLM is the most straightforward model for interpreting the results [13]; Therefore, researchers tend to utilize BLM in the analysis of injury severity to obtain direct explanations, such as Eboli et al. [14], Miqdady and de Oña [15], and Olszewski et al. [16].
In this study, injury severity in crashes was defined as a binary variable. The binary logistic regression model was thus developed to predict the injury severity in rural freeway crashes by using the binary model in the analysis.
BLM can be formed as follows:
$\log \left[\frac{P_i}{1-P_i}\right]=\alpha+\beta_1 x_{i 1}+\beta_2 x_{i 2}+\cdots+\beta_k x_{i k}$ (1)
where,
$P_i$=Prob (yi/xi) is the response probability of being modelled, and yi is the first ordered level of y
α=Intercept parameter
β=Vector parameters
$x_i$ =Vector of explanatory variables.
The odds ratio for dichotomous explanatory variable x, which takes the value of 1 or 0, can be expressed as the ratio of the predicted number of times that an event will occur (x=1) to the predicted number of times it will not occur (x=0). The value of 1 indicates that the event will absolutely occur, and 0 indicates that the event will not occur. The following formula can illustrate this condition:
$O R=\frac{\pi(1) /[1-\pi(1)]}{\pi(0) /[1-\pi(0)]}$ (2)
where,
OR=Odds ratio
π(1) ⁄ [1-π(1)] =Odds that the event will occur when x=1
π(0) ⁄ [1-π(0)] =Odds that the event will not occur x=0
Methodological limitations exist in the logistic model as it is a fixed-parameter model and cannot reveal heterogeneity. However, this limitation can be advantageous in some cases, allowing for direct and non-overlapping explanations. In this study, using BLM is most appropriate to obtain clear and concise results. Straightforward results can provide specific suggestions that can be implemented to improve road safety, particularly in the context of institutional weaknesses in Libya.
2.5 Model building strategy
The model building strategy was divided into three stages: 1) foundational analysis, 2) stepwise selection method, and 3) model fitness valuation. In this study, statistical software (STATA 15) was used for all analyses.
The foundational analysis stage involved two steps in which a univariable analysis was conducted to test the independent associations between each predictor and the outcome being the first step. For conceptual reasons, only statistically significant variables or those decided to a priori are incorporated in the model. Further, the associated collinear pairs for retaining only one of the variables were identified through a collinearity analysis in the second step.
All the variables first considered in this study are as shown in Table 1, and Table 2. A level of significance (p-value) of less than 0.10 was chosen instead of the traditional level of 0.05, as adopted by Shinstine et al. [10]. The outcomes of the bivariate analysis are shown in Table 3; Only eleven variables were selected (variable with p<0.10) following the univariable investigation, In addition to driver age as a control variable.
Out of the 12 identified coded variables, the multicollinearity problem was found to exist only with animal collision (AANI) and animal cause factor (CANI). AANI was later excluded from the selection, but CANI was maintained as the presence of an animal on the road was oftentimes the leading cause of animal-related crashes. At the end of the first stage, only nine variables made it through the selection.
Table 3. Univariable analysis result
|
Variable |
Code |
p-value |
|
Days of week |
WE |
*** |
|
Horizontal alignment |
HALL |
*** |
|
Animal collision |
AANI |
*** |
|
Head-on collision |
AHON |
*** |
|
Rear-end collision |
AREN |
*** |
|
Sideswipe-opposite collision |
ASSO |
*** |
|
Driver speed factor |
CDSP |
*** |
|
Animal factor |
CANI |
*** |
|
Vehicle factor |
CVEH |
*** |
|
Private car |
VPRV |
*** |
|
Tractor-trailer |
VTRC |
*** |
|
***- p < 0.10 is the level of significance. |
||
In the second stage, the variables selection included a stepwise backward selection method for selecting predictors. As a result, two more variables were eliminated from the model: HALL (p-value=0.281˃0.05) and CVEH (p-value=0.062˃0.05). The final model variables were determined based on the first and second stages of the model-building strategy.
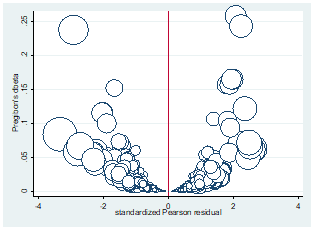
Finally, the third stage involved the valuation of the model's fitness, including an assessment of its overall performance (i.e., systematic component) and variables (i.e., case analysis). The model adequacy must first be evaluated before it can be accepted as the final model using familiar approaches, including a goodness-of-fit statistic such as Hosmer-Lemeshow tests (H-L). Considerable previous studies have applied such approaches to test and validate the null hypothesis that a fitted model is correct, and a p-value below 0.05 would indicate that the model is not acceptable [17]. In this study, the model was found to fit well based the evaluation of an H-L chi-squared test with p-value=0.4299˃0.05.
Figure 2. Illustration of combined information on multiple leverage statistics
Nevertheless, Hosmer et al. [18] stressed that before assuming a model is "fit," other measures should be considered to ensure the fitness was propped over the entire set of covariate patterns. Therefore, the outliers and influential points (i.e., case analysis assessment) were diagnosed using graphical assessment approaches, and covariate patterns were generally considered for the diagnostic statistics. As shown in Figure 2, the graphical assessment results indicate no effect of outliers or influential cases on the model.
3.1 BLM results
This study examined 1,255 rural freeway crash records, whereby the odds ratio (OR) was used for model interpretation purposes. The results of the final BLM model are shown in Table 4, with details on the estimated parameter and p-values of the predictors.
Table 4. Parameter estimation and OR for the BLM
|
Severity |
OR |
Std. Err. |
p-value |
95% CI of OR |
|
|
Driver's age |
1.004 |
0.005 |
0.486 |
0.994 |
1.014 |
|
Days of week |
1.443 |
0.260 |
0.042* |
1.014 |
2.054 |
|
Head on collisions |
3.782 |
0.894 |
0.000*** |
2.380 |
6.009 |
|
Rear end collision |
0.396 |
0.088 |
0.000*** |
0.256 |
0.613 |
|
Driver speed factor |
1.552 |
0.2`53 |
0.007** |
1.128 |
2.136 |
|
Animal Cause factor |
0.423 |
0.078 |
0.000*** |
0.295 |
0.606 |
|
Private car |
1.401 |
0.179 |
0.008** |
1.091 |
1.799 |
|
Tractor trailer |
0.400 |
0.084 |
0.000*** |
0.265 |
0.603 |
|
Constant |
0.829 |
0.182 |
0.039 |
0.539 |
1.276 |
|
* p<0.05, **p<0.01, *** p<0.001. CI denotes confidence interval. |
|||||
In the final model, only seven of the tested variables had significant impacts on the injury severity of rural freeway crashes at a significance level of 95%. The seven variables were then grouped into five main risk factors, which included temporal characteristics, type of collision, human factor, environmental factor, and vehicle characteristics.
3.1.1 Temporal characteristics
RTCs occurring during weekends (Friday and Saturday) were found to significantly contribute to the injury severity in rural freeway crashes than on weekdays with an OR of 1.44, which meant the probability of severe and vicious collision increased by 44% on weekends as compared to weekdays. The finding was in agreement with the findings observed in previous studies such as Zhang et al. [19] and Yu and Abdel-Aty [20]. In general, more severe crashes during the weekend are expected with the assumption that most of the drivers during weekend travel might not be commuters who are familiar with the road and roadside characteristics. Nevertheless, some studies have assumed that RTCs occurring on weekdays could be more severe than those on weekends [21, 22].
3.1.2 Collision type
Two types of road traffic collisions were found influencing injury severity in rural freeway crashes, namely head-on and rear-end. Head-on collisions were more likely to result in severe injuries, in which the probability of severe injuries could increase by 278% (OR = 3.782) compared to other collisions. This finding was entirely consistent with the findings of many previous studies, such as Conroy et al. [23], and Wali et al. [24]. It is an intuitive fact that a head-on collision increases the likelihood of severe injuries in which the injury severity is attributable to the inelastic collision's impact. Seat belt use should be considered to enhance occupants' safety during an inelastic collision. According to Hamza [7], only 8.2% of Libyan drivers and 7% of front-seat passengers use seat belt, thus resulting in 53% of unbelted drivers sustaining injuries to the head and neck section.
In contrast, rear-end collisions were much less likely to result in severe injuries in which the probability of injury severity was found to decrease by 60% (OR = 0.396). This finding was in line with the finding of Kim et al. [25]. Nevertheless, there is still some debate regarding the influence of rear-end collisions on injury severity. For example, Yasmin and Eluru [26] reported that drivers involved in rear-end collisions were more likely to sustain severe injuries than those involved in head-on or angular collisions.
3.1.3 Human factor
High-speed was found to be the main human-related factor influencing injury severity in rural freeway crashes in which the probability of injury severity increased by 55% (OR = 1.552). Previous studies also substantiated this finding, such as Ma et al. [27] and Elvik [28]. High-speed is considered one of the risky driving behaviours that lead to traffic accidents, according to a survey conducted by Javid and Al-Neama. [29] in Oman to investigate driver distraction factors. The results indicate that 43% of respondents admitted that high speed is the leading cause of accidents. Furthermore, Siregar and Tjahjono [30] developed the power model of the speed-traffic safety relationship and concluded that the increase in speed is responsible for the rise in the number of accidents and fatalities. Generally, speed limits are higher on state roads compared to their urban counterparts, which could be one possible reason for this high probability. In Libya, drivers often exceed speed limits, especially in the absence of speed control on deteriorated rural freeways due to outdated life and lack of maintenance, which affects the road's quality. As is well known, roads with low design requirements are more dangerous than well-designed roads, even with speed restrictions and low traffic [31]. These combined conditions often lead to severe and tragic traffic accidents.
3.1.4 Environmental factor
Also, animals involved in RTCs are a significant environmental factor. In the present study, approximately 83% of these animals were camels (i.e., large size and long legs). Animal collisions were much less likely to result in severe injuries in which the probability of injury severity was found to decrease by 57% (OR = 0.423). Nevertheless, this finding contrasted with the finding by Al Shimemeri and Arabi [32], who concluded vehicle collisions with animals with high body weight and long legs, such as camels, could cause significant injury to passengers. Such contradiction could be justified by Libyan drivers' familiarity and social interaction, who generally flash their headlights to warn opposite-direction drivers of potential hazards on the road. Such alerts allow the drivers to reduce their speed pre-emptively, thus reducing collision severity.
3.1.5 Vehicle type
Two types of vehicles were found to be significant determinants of injury severity in rural freeway crashes, namely a private car, and a tractor-trailer. Commuting by private car was more likely to result in severe injuries, in which the probability of injury severity was found to increase by 40% (OR = 1.401) compared to other vehicle types. In contrast, the probability of injury severity was found to decrease by 60% (OR = 0.34) among tractor-trailer occupants. These findings were in line with those obtained by Zhu and Srinivasan [33], who found that heavy vehicle occupants suffered less severe injury. Thus, we can say that severity of a collision could be linked to vehicle mass, with vehicle weight identified as a crucial factor in assessing the fatality risk of vehicle occupants [34]. Consequently, a more massive amount of kinetic energy caused by the collision might be absorbed more by light vehicles compared to their heavier counterparts [3].
3.2 Review of investigation reports
Police crash reports are perhaps the most omnipresent source of traffic crash data. In Libya, these reports could provide helpful information for prosecution purposes and must be available in an organised and easy-to-read format to ensure justice. Furthermore, data in these reports is necessary for inferential analysis, notably in road safety enhancement programmes. Therefore, reviewing these reports for development and improvement purposes would be positively reflected in scientific research results. In the present study, the review included:
(1) Police investigation reports' form and writing style.
(2) Investigations by Police Officers and the Availability of Crash Information.
(3) The concept of road safety for road users, traffic police officers, and relevant government institutions.
3.2.1 Police investigation reports writing style
It was found that there was no standard form for the handwritten investigation reports. Also, police officers are not aware of the information that should be legible due to the gravity of many police reports. Furthermore, police reports are not typed in an ideal situation; nevertheless, this has been impossible because of the lack of computerisation in Ajdabiya police department.
3.2.2 Investigations
By Police Officers and The Availability of Crash Information. In most crash investigation reports, limited evidence was observed, and most charges were for speeding. Other factors that could cause erratic driving and crashes, such as ill-health, medical conditions, mechanical failure of the vehicle, poor road conditions, or climatic conditions, were mostly not considered when indicting. In addition, weak investigation and inference procedures resulted in limited evidence. Drivers' previous traffic violation reports, which could prove useful for prosecution, were also found excluded from the crash investigation reports. Furthermore, the traffic police system has no record of drivers' previous violations to date.
3.2.3 Road safety concept
A review of investigation reports revealed that no information about seat belts was found, which led this study to conclude that most vehicle users do not use seat belts while driving. In other words, road safety awareness is absent among the majority of Libyan people, including traffic police. In addition, although many modern cars were involved in road accidents, airbags were not mentioned in the investigation records. This may be because many second-hand cars imported to Libya are without airbags. Most likely, it was deployed in previous accidents and was not replaced. Therefore, importing used cars should be regulated to guarantee that they meet safety standards.
Above all, it is astonishing that the investigative reports include no mention of ambulance services, which revealed the absence of ambulance services on rural freeways. Without a doubt, the probability of death would likely increase among people sustaining severe injuries in RTCs due to the lack of ambulance services. Such findings indicate governmental institutions' lack of road safety awareness and the weakness of traffic law implementation.
Police accident reports are anticipated to continue to be a popular source of traffic accident data in the foreseeable future; thus, some measures should be taken to enhance their quality. Specifically,
This study aims to conduct an injury severity analysis employing reliable and detailed RTCs data. To achieve this objective, RTCs data for ten years (2001-2010) was obtained from investigative reports housed in the archive of Ajdabiya Traffic Police Department. More than 2,300 handwritten investigation reports were reviewed and then transformed into an electronic format to create an RTCs database. Even while just 53% of RTCs occurred on highways, they accounted for more than 80% of total fatalities, according to the database. Therefore, only 1,255 rural freeway-related collisions were considered for this investigation. BLM model was developed based on 1,255 RTCs records. It was found that risk factors such as weekends, head-on crashes, high-speed, and travel by private car were more likely to increase the likelihood of injury severity in rural freeway crashes. On the other hand, rear-end collisions, crashes involving camels, and being a tractor-trailer occupant were most likely to result in less severe injuries. Furthermore, the review of police investigation reports revealed that reports are handwritten, lack a uniform format, and are not computerized. Also, police officers are low performance, lack traffic safety concepts, and neglect the implementation of laws.
The present study concluded that driving on weekends, Head-on collisions, high speed, and travelling in a private car contribute to an increase in injury severity. Additionally, the lack of efficiency of police officers and the failure of law enforcement. All These combined factors played a role in high road traffic death rate in Libya.
The findings of this study could help transportation agencies in Libya to better understand the effects of various factors influencing crash severity and thus identify effective countermeasures to reduce severe RTCs consequences.
Therefore, the following measures should be considered:
(1) Improvement of the data recording system of RTCs, starting from the police investigation reporting processes and working towards establishing a multisource database.
(2) Enforcement of seat belt use regulations could have a meaningful impact on saving lives, especially in head-on collisions.
(3) Speed control measures on freeways, particularly on weekends, may substantially influence the reduction of injury severity.
(4) Activation of ambulance services, especially on long rural freeways such as Kufra Road and Tobruk Road, where the distance between residential communities may reach 300 km or more.
(5) Legalizing and regulating the import of second-hand cars and ensuring their compliance with safety standards.
Nevertheless, this study was not without limitations, which should be considered when applying the findings. Lack of data such as traffic data, traffic volume, roadway geometry, and pavement information resulted in some factors being excluded from the analysis, which limited predictability and hampered the future strategies' effectiveness in reducing injury severity. A multisource database would be needed to determine these fundamental factors' effects on the injury severity of rural freeway RTCs. Such a multisource database should be implemented for future work to understand RTCs' injury severity better.
In addition, suggestions were made for future research methodologies in the analysis of accident severity and frequency to enhance road safety, and it is as follows:
(1) To account for individual-level heterogeneity in data, a random parameter model such as Mixed logit model is suggested for future injury severity research to reveal unobserved heterogeneity. The analysis should include all categories of factors affecting accident severity.
(2) Count data regression models allow the researcher to estimate the expected number of events (traffic accidents) for an observation unit (number). Count regression models, such as negative binomial models, are suggested for future research to analyse accident frequency in Libya.
The authors are grateful to Ajdabiya Traffic Police Department for their cooperation and permission to acquire data from their archive and to Universiti Kebangsaan Malaysia for funding this study (GUP-2021-025).
[1] WHO. (2018). Global status report on road safety 2018: Summary.
[2] WHO. (2007). Health system Profile-Libya. Cairo: EMRO regional health systems observatory.
[3] Christoforou, Z., Cohen, S., Karlaftis, M.G. (2010). Vehicle occupant injury severity on highways: An empirical investigation. Accident Analysis & Prevention, 42(6): 1606-1620. http://doi.org/10.1016/j.aap.2010.03.019
[4] Garrido, R., Bastos, A., de Almeida, A., Elvas, J.P. (2014). Prediction of road accident severity using the ordered probit model. Transportation Research Procedia, 3: 214-223. http://doi.org/10.1016/j.trpro.2014.10.107
[5] Mekky, A. (1984). Road traffic accidents in rich developing countries: The case of Libya. Accident Analysis & Prevention, 16(4): 263-277. http://doi.org/10.1016/0001-4575(84)90021-6
[6] Mekky, A. (1985). Effects of rapid increase in motorization levels on road fatality rates in some rich developing countries. Accident Analysis & Prevention, 17(2): 101-109. http://doi.org/10.1016/0001-4575(85)90013-2
[7] Hamza, M.A.D. (2005). A study of road accidents, causalities and their injury patterns in Libya. Newcastle University. http://hdl.handle.net/10443/225
[8] Belker, M.S., Bensaleh, B.M. (2010). Analytical comparison study of traffic accidents in Libya. Journal of Engineering Research (Al-Fateh University), 14(1): 79-88.
[9] Yahia, H.A., Ismail, A. (2013). An analysis of traffic accidents in Libya, and some mitigation strategies. Australian Journal of Basic and Applied Sciences, 7(4): 285-290.
[10] Shinstine, D.S., Wulff, S.S., Ksaibati, K. (2016). Factors associated with crash severity on rural roadways in Wyoming. Journal of Traffic and Transportation Engineering, 3(4): 308-323. http://doi.org/10.1016/j.jtte.2015.12.002
[11] Jung, S., Qin, X., Oh, C. (2016). Improving strategic policies for pedestrian safety enhancement using classification tree modeling. Transportation Research Part A: Policy and Practice, 85: 53-64. http://doi.org/10.1016/j.tra.2016.01.002
[12] Kleinbaum, D.G., Dietz, K., Gail, M., Klein, M., Klein, M. (2010). Logistic Regression: A Self-learning Text. Springer, New York, USA. https://doi.org/10.1007/978-1-4419-1742-3
[13] Mujalli, R.O., de Oña, J. (2013). Injury severity models for motor vehicle accidents: A review. Proceedings of the Institution of Civil Engineers-Transport, 166(5): 255-270. http://doi.org/10.1680/tran.11.00026
[14] Eboli, L., Forciniti, C., Mazzulla, G. (2020). Factors influencing accident severity: An analysis by road accident type. Transportation Research Procedia, 47: 449-456. http://doi.org/10.1016/j.trpro.2020.03.120
[15] Miqdady, T. de Oña, J. (2020). Identifying the factors that increase the probability of an injury or fatal traffic crash in an urban context in Jordan. Sustainability, 12(18): 7464. http://doi.org/10.3390/su12187464
[16] Olszewski, P., Szagała, P., Rabczenko, D., Zielińska, A. (2019). Investigating safety of vulnerable road users in selected EU countries. Journal of Safety Research, 68: 49-57. http://doi.org/10.1016/j.jsr.2018.12.001
[17] Al-Ghamdi, A.S. (2002). Using logistic regression to estimate the influence of accident factors on accident severity. Accident Analysis & Prevention, 34(6): 729-741. http://doi.org/10.1016/S0001-4575(01)00073-2
[18] Hosmer, D.W., Lemeshow, S., Sturdivant, R.X. (2013). Model-building strategies and methods for logistic regression. Applied Logistic Regression, 89-151. https://doi.org/10.1002/9781118548387.ch4
[19] Zhang, G., Yau, K.K., Chen, G. (2013). Risk factors associated with traffic violations and accident severity in China. Accident Analysis & Prevention, 59: 18-25. http://doi.org/10.1016/j.aap.2013.05.004
[20] Yu, R., Abdel-Aty, M. (2013). Investigating the different characteristics of weekday and weekend crashes. Journal of Safety Research, 46: 91-97. http://doi.org/10.1016/j.jsr.2013.05.002
[21] Quddus, M.A., Wang, C., Ison, S.G. (2009). Road traffic congestion and crash severity: Econometric analysis using ordered response models. Journal of Transportation Engineering, 136(5): 424-435. http://doi.org/10.1061/(ASCE)TE.1943-5436.0000044
[22] Shrestha, P.P., Shrestha, K.J. (2017). Factors associated with crash severities in built-up areas along rural highways of Nevada: A case study of 11 towns. Journal of Traffic and Transportation Engineering, 4(1): 96-102. http://doi.org/10.1016/j.jtte.2016.08.003
[23] Conroy, C., Tominaga, G.T., Erwin, S., Pacyna, S., Velky, T., Kennedy, F., Coimbra, R. (2008). The influence of vehicle damage on injury severity of drivers in head-on motor vehicle crashes. Accident Analysis & Prevention, 40(4): 1589-1594. http://doi.org/10.1016/j.aap.2008.04.006
[24] Wali, B., Khattak, A.J., Xu, J. (2018). Contributory fault and level of personal injury to drivers involved in head-on collisions: Application of copula-based bivariate ordinal models. Accident Analysis & Prevention, 110: 101-114. http://doi.org/10.1016/j.aap.2017.10.018
[25] Kim, K., Nitz, L., Richardson, J., Li, L. (1994). Analyzing the relationship between crash types and injuries in motor vehicle collisions in Hawaii. Transportation Research Record, 1467: 9-13.
[26] Yasmin, S., Eluru, N. (2013). Evaluating alternate discrete outcome frameworks for modeling crash injury severity. Accident Analysis & Prevention, 59: 506-521. http://doi.org/10.1016/j.aap.2013.06.040
[27] Ma, Z., Zhao, W., Steven, I., Chien, J., Dong, C. (2015). Exploring factors contributing to crash injury severity on rural two-lane highways. Journal of Safety Research, 55: 171-176. http://doi.org/10.1016/j.jsr.2015.09.003
[28] Elvik, R. (2013). A re-parameterisation of the Power Model of the relationship between the speed of traffic and the number of accidents and accident victims. Accident Analysis & Prevention, 50: 854-860. http://doi.org/10.1016/j.aap.2012.07.012
[29] Javid, A.M., Al-Neama, Y.M. (2018). Identification of factors causing driver’s distraction in Oman. Journal of Applied Engineering Science, 16(2): 153-160. http://doi.org/10.5937/jaes16-16669
[30] Siregar, M.L., Tjahjono, T. (2021). Speed change and traffic safety power model for inter-urban roads. Journal of Applied Engineering Science, 19(3): 853-861. http://doi.org/10.5937/jaes0-29180
[31] Ghadi, M.Q. (2023). Multilevel analysis of road accident frequency: The impact of the road category. International Journal of Transport Development and Integration, 7(2): 123-130. http://doi.org/10.18280/ijtdi.070207
[32] Al Shimemeri, A., Arabi, Y. (2013). A review of large animal vehicle accidents with special focus on Arabian camels. Journal of Emergency Medicine, Trauma & Acute Care, 2012(1): 1-7. http://doi.org/10.5339/jemtac.2012.21
[33] Zhu, X., Srinivasan, S. (2011). A comprehensive analysis of factors influencing the injury severity of large-truck crashes. Accident Analysis & Prevention, 43(1): 49-57. http://doi.org/10.1016/j.aap.2010.07.007
[34] Gabler, H.C., Hollowell, W.T. (1998). The aggressivity of light trucks and vans in traffic crashes. SAE Transactions, 107: 1444-1452. http://doi.org/10.4271/980908