Gargi Patil*![]() | Tarun Khandelwal
| Tarun Khandelwal![]()
© 2023 IIETA. This article is published by IIETA and is licensed under the CC BY 4.0 license (http://creativecommons.org/licenses/by/4.0/).
OPEN ACCESS
One of the major challenges facing Indian cities today is the need to generate and manage local-level finances, improve the quality and frequency of bus services, and develop multimodal transport systems. This study examines the generation and management of local finances, the enhancement of bus services, and the development of multimodal transport systems in Indian cities, specifically Pune, Bangalore, and Indore. Selected for their similarity in size and high rankings on domestic indices—Ease of Living Index (EoLI), Municipal Performance Index (MPI), and Swachh Bharat Mission—these cities provide a representative analysis of broader urban transport issues. A ratio analysis of financial allocations for bus service management and procurement within city budgets was conducted, utilizing a descriptive methodology and secondary data from municipal documents, official websites, scholarly articles, and news reports. The findings reveal critical insights into the fiscal challenges and potential solutions for public transportation systems in India, highlighting the necessary financial commitments for improving bus service quality and ridership. Furthermore, the study suggests recommendations based on best practices for advancing sustainable urban bus transportation in line with Sustainable Development Goal 11.2, offering a valuable reference for policymakers in allocating resources effectively for public transit infrastructure.
mass transit, public finances, sustainable transportation, urban economics, Pune, Indore, Bangalore
As of 2021, approximately 56% of the global population resided in urban areas, with urbanisation trends increasingly observed worldwide [1]. Notably, China, India, and Nigeria are projected to account for approximately 35% of global urban population growth from 2018 to 2050. Urbanisation, encompassing both rural-to-urban migration and natural demographic growth within urban regions, necessitates rigorous definition and understanding [2].
In India, urban populations have increased from 377 million in 2011 to 498 million in 2021 [1]. Though the rate of urbanisation has risen from 31% to 35% over the same period, this proportion remains relatively small compared to other emerging economies. For instance, China displays an urbanisation rate of 45%, Indonesia 54%, Mexico 78%, and Brazil 87% [3]. Consequently, the definition of 'urban areas' within India's unique context requires careful attention.
According to the 2011 Census of India, 'urban areas' are defined as all locations with a municipality, municipal corporation, cantonment board, or notified town area committee, termed as ‘Census Towns’. Additionally, all places satisfying the following criteria are classified as ‘Statutory Towns’: a minimum population of 5000, with at least 75% of the male working population engaged in non-agricultural pursuits, and a population density of at least 400 persons per sq. km.
The steady rise in India's urbanisation, as evidenced by the increase in cities from 5161 in 2001 to 7935 in 2011 according to the 2011 Census of India, has been paralleled by a significant upsurge in economic activities, income levels, and consequently, vehicular growth. This growth, however, has not been matched by a comparable development in public transportation systems, a responsibility of the Urban Local Bodies (ULBs) as mandated by the 12th Schedule of the Indian Constitution. The lack of quality public transportation systems, crippled further by inadequate sources of local revenue, poses a substantial challenge for municipal governments. As India aspires to elevate itself from a lower middle-income to an upper middle-income country, efficient multimodal public transportation, underpinned primarily by bus services and metros, will be pivotal in enhancing urban mobility and ridership [4-6].
With the implementation of the 74th Constitution Amendment Act (CAA) in 1992, ULBs were assigned the responsibility of constructing infrastructure such as roads, flyovers, street lights, parking spaces, and bus stops. However, they often find themselves financially incapable of meeting the infrastructural demands of the cities [7]. The disconnect between urban planning and land use plans, as observed in many Indian cities, contrasts starkly with the guidelines laid out under the National Urban Transport Policy (NUTP) in 2006 [8].
Allocations for urban transport vary greatly, with 20%-40% of revenue expenditure and 40%-90% of capital expenditure being dedicated, depending on the city. However, large portions of these funds are earmarked for road and flyover construction and maintenance, leaving public bus transport significantly underfunded. This underinvestment has undermined state transport undertakings and Special Purpose Vehicles (SPVs), pushing commuters towards private transportation modes such as two-wheelers, cars, and other intermediate public transport modes like auto-rickshaws, taxis, Uber, and Ola [9].
As of 2021, India ranked sixth among the world's largest vehicle producers [10]. The mobility of the urban population is influenced by rapid urbanisation, increasing motorisation, and a declining share of Non-Motorized Transport (NMT) [11]. With urbanisation and population growth, an upward trend in the number and sales of private passenger vehicles has been observed, leading to congestion, vehicular pollution, and road accidents [12]. To address these issues, a shift towards sustainable modes of commuting, such as buses, metros, Mass Rapid Transit System (MRTS), trams, monorails, suburban rails, cycling, and walking is needed [13].
The present study aligns with the 11th United Nations (UN) Sustainable Development Goal (SDG Target 11.2) which advocates for a safe, affordable, accessible, and sustainable transport system. Accordingly, the findings will assist select ULBs in determining the necessary financial allocation to improve bus services and facilitate commuter mobility. Encouraging public over private transportation modes would promote a sustainable transport system, enhancing quality of life, economic activities, and environmental sustainability [10].
The study will contribute significantly to the growing issues of local transportation in urban areas by mapping the required financial resources with easy, feasible, affordable and sustainable transport solutions. Lastly, the findings would interest readers in understanding the various challenges of public transportation systems in India and recognise some solutions for the future, which would improve the quality of life or livability, economic activities and environmental sustainability in the country.
This study aims to shed light on the relationship between public bus transportation services and city-level finances in select ULBs across India. Cities such as Bangalore, Indore, Pune, and Pimpri Chinchwad have been selected for their unique transport conditions and high-ranking positions on domestic indices such as the Ease of Living Index (EoLI), Municipal Performance Index (MPI), and Swatch Bharat Mission. The study will contribute to understanding the challenges of public transportation systems in India and provide insights for future solutions to improve livability, economic activities, and environmental sustainability.
The paper is structured into sections: an introduction outlining the research objectives, a literature review on ULBs and their transport, and financial challenges, and finally, the findings of the study with relevant recommendations.
i. What are the issues faced by ULBs in providing an efficient bus transport system?
ii. How much of the total annual budget must a city spend, in order to provide decent quality bus transport service?
iii. How much capital expenditure is necessary for a city, to meet the requirement of buses, in order to encourage the shift to sustainable mass transit systems from the existing private and fossil fuel-driven modes?
2.1 Implications of the study
While there is ample literature on urban transportation challenges, a comprehensive examination of the specific challenges faced by cities in India is limited. The precise budget allocation for providing a decent bus transport system is often missing from urban planning literature. There is a lack of specific guidelines regarding how much a city should invest in buses as per their population and budget constraints.
The above research questions address crucial gaps in the existing literature by examining specific financial challenges and funding requirements for buses in the backdrop of the current population of each of the selected cities. The questions fill gaps in the existing literature by offering practical insights into the financial and operational aspects of bus transport in selected Indian cities. Finally, the questions will help in establishing a financial benchmark for urban planners, making budget allocation (for buses) more transparent and efficient. Determining an appropriate budget allocation will aid in establishing a financial framework for effective and accessible bus transport, which is vital for improving the quality of life in Indian cities.
2.2 Methodology and tools used
The research is based on secondary data and has used descriptive methodology and relevant quantitative tools such as percentages and ratios to analyse the data. The study has been conducted mainly for the year 2019-2020. The researchers have selected this year (2019-2020) considering the fact that revised amounts (which are more reliable) from the city’s budgets were available as against the budgeted amounts.
The first research question has been addressed by critically reviewing the existing literature to identify urban transportation-related challenges in India. The second question has been addressed from the budgetary analysis of the Indian cities' existing revenue and expenditure patterns. The final question has been addressed by studying the population data (from the Census of India) and the selected cities' budgets to understand the funding requirements for buying new buses and maintaining old buses.
The literature review is divided into three parts; the first part discusses the importance of transportation in cities across the world. The second section highlights the need for adequately financing public transit in urban areas, especially in emerging economies like India. The final section of the literature review provides justification for the selection of the four cities of Bangalore, Indore, Pune and Pimpri Chinchwad.
3.1 Importance of transportation in cities
Urban transport and mobility is a system that helps access work, education, leisure and other services. It acts as a catalyst to the economy's growth and development and is also called the ‘life and blood of the cities’ [14]. However, many cities in India are plagued with the growth of private vehicles such as two-wheelers and cars on one hand and on the other hand, with poor and inefficient services of mass transit modes such as public buses, trams, rails and Bus Rapid Transit System (BRTS). This problem is further complemented by an insufficient metro network and a lack of footpaths and cycle tracks [15-17]. As a result, cities cannot cope with the issues of vehicular pollution, rising road accidents, low parking spaces and congestion [18].
Creating a vast network of efficient and sustainable transport systems requires cities to rely heavily on mass transit systems of metro, monorail, trams, rails and other public transport systems, namely buses, BRTS, light rail systems and cycles, footpaths and shared vehicles for the first and last mile connectivity [19]. An efficient public transport system should have the following characteristics: affordability, reliability, accessibility, safety, security, easy ticketing, comfortable, clean, frequent, timely and sustainable [20-22].
To make public transport systems affordable and address the problems associated with ticketing, fare-free public transportation was introduced by Templin, Germany. This led to a 12-fold increase in passengers within a few years. Further, twelve municipalities in France introduced similar fare-free transportation that allowed the ridership of public transport to increase from 1.9 million passengers in 2008 to 5.5 million passengers by the end of 2015 [23-25].
Among the sustainable transport modes, public transport buses have been considered the most feasible mode of mass transit - as the services can be provided on the existing road infrastructure and already present bus stops, since building separate lanes, flyovers, rail tracks and others are not required. Hence, buses are cost-effective compared to other public transport modes [26].
ULBs and State governments are required to provide city-specific transport systems. In most cities, bus services are struggling with inefficient and unreliable services and cannot meet the rising demand of commuters. As per the Comprehensive Mobility Plan (CMP), in order to provide decent bus services, a city should have 55 buses per lakh of population [27]. The bus service providers in most of the cities do not meet the standards of running 55 buses for every one lakh population. The buses running on the road are also overcrowded, unreliable, delayed, unsafe and provide unpleasant travelling experiences to the users [15-17].
The urban transport dedicated policies such as NUTP emphasise the importance of public modes of transportation over private ones. In addition to that, a centrally sponsored scheme titled ‘Jawaharlal Nehru National Urban Renewal Mission’ (JNNURM) introduced in 2005, was the major contributor in supplying and funding buses to the cities across the country. Policies initiatives such as the High-Powered Expert Committee (HPEC), 2011, the 12th Five-Year Plan, 2012, and the National Transport Development Policy Committee (NTDPC), 2013, have discussed the funding requirement for urban transport and have focused on encouraging public transport systems. However, they do not clearly prescribe the finances allocated specifically to the improvement of bus services and other managerial challenges that the ULBs face, in providing sustainable bus transport services [4].
In the backdrop of poor public transport services and the growth of private transport modes clogging the city roads, the study aims to estimate the required number of buses and the required finances for the select cities of Pune, Pimpri Chinchwad, Bangalore and Indore in India. This would help to understand the shortage of buses in each of the selected cities and the funds needed to purchase the remaining buses to meet the increasing demand. In addition, comparing these four cities would help readers understand their best practices regarding services and management, which can be learnt and implemented in other Indian cities for improved performance and ridership.
3.2 Deficient status of local-level finances
An efficient urban transport system is vital for the growth process to be inclusive and sustainable. For an emerging economy like India, an efficient and sustainable urban transport system holds utmost importance on several parameters like improving mobility, ridership and cost-effectiveness. Further, the state of urban transportation is one of the required indicators in ascertaining the livability index of the city. A financially sustainable urban transport service is also crucial for enhancing productivity and thereby supporting Indian industries and services to become competitive with international standards [3]. Thus, it will be a good idea to look at investment requirements for Indian urban infrastructure, including local transportation - refer to Table 1.
Table 1. Urban transport investment requirement from 2010-2030 (in Rs. Trillion) (20 years time period)
|
Reports |
Working Group |
|||
|
Indicators |
HPEC |
MGI |
Urban |
Sprawl |
|
Transit |
4.49 |
17.64 |
5.56 |
10.55 |
|
Urban Roads |
17.29 |
8.9 |
9.17 |
12.08 |
|
Others |
0.9 |
0.5 |
0.27 |
0.15 |
|
Total |
22.68 |
27.04 |
15 |
22.78 |
Source: Author's compilation from multiple sources. Note: Rs.1 trillion = 1 Lakh Crore
According to the HPEC report of 2011, around Rs.39.2 lakh crores is required for adequate infrastructure development in the country, which consists of urban roads, urban transport, traffic supporting infrastructure, street lighting, water supply, sewerage, solid waste management, stormwater drains and others. This amount is exclusive of Operations and Management (O&M) costs. Of this, individually, for building urban roads, Rs.17.3 lakh crores (44%) and Rs.8.90 lakh crores would be required, as estimated by the HPEC and McKinsey Global Institute (MGI), respectively, for a time frame of 20 years starting from 2010 to 2030 [28] - refer to Table 1. The O&M costs are estimated separately at Rs.19.9 lakh crores [29].
A close examination of Municipal Finances in India since independence reveals that it has been insignificant to the country's overall public finance. Urban finance in India has been largely characterised by a poor resource base, lack of autonomy, low capacity to mobilise revenues, high dependence on central and state-level transfers and grants-in-aid, and external financial management inefficiencies [30]. It is therefore, imperative to undertake studies for building the revenue base of ULBs, make them financially sustainable, and improve the local transport systems since providing local public transportation is a huge cost for cities and largely exceeds city budgets. Hence, adequate financing of urban infrastructure and transportation facilities is a significant and unavoidable problem facing ULBs in India [31].
From the above, it is thus clear that urban areas in India are deficient in providing basic urban services and facilities even at the present level of population and this happens mainly due to the lack of financial resources available with the cities, which are limited to tax and non-tax revenue, fees and fines, user charges, grants-in-aid and loans. Since the rate of rural-to-urban migration will continue to increase in the near future, it is necessary that various amenities will have to be created at a faster rate, than what the cities have already accomplished and therefore the need for innovative financing mechanisms. Further, in the days of globalisation, the capacity of urban areas to attract foreign investments will also be adversely affected if the local transportation facilities among others are not up to the mark [3].
3.3 Justification for the selection of the cities
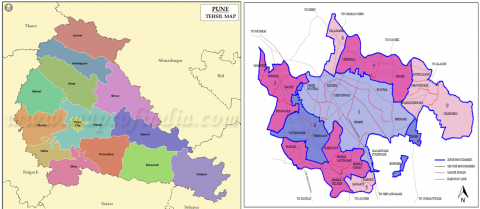
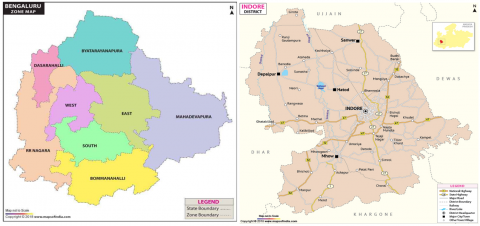
Four ULBs of Pune, Pimpri Chinchwad, Bangalore and Indore have been selected for the present study and there are maps in Figure 1.
i. Pune, a city with 66 lakhs population [32], is ranked as the ninth most populated city and seventh largest in terms of area in India [33]. The city holds a very important role in the growth process as a cultural capital and is popularly known as the ‘Oxford of the East’ (with a prominent existence of colleges and universities). It was recently ranked second in terms of the most livable city in India, in 2020 under the ‘Ease of Living Index (EOLI)’ that was released by the Ministry of Housing and Urban Affairs (MoHUA). The city ranks fifth on the Municipal Performance Index (MPI) that was also released by MoHUA - which examines the sectoral performance of 111 municipalities and provides a granular understanding of a municipality's functionalities [34]. Pune Municipal Corporation (PMC) governs the largest (non-capital) city of Pune in Maharashtra, with an area of 516 sq. km [35].
ii. Pimpri Chinchwad city, which ranks 18th in India and 69th in the EOLI, is the satellite city of Pune governed by Pimpri Chinchwad Municipal Corporation (PCMC), having an area of 177 sq. km. and a population of 23 lakhs [36]. The city ranked fourth on the MPI, which was released in 2020 [34]. PCMC has emerged as a famous industrial town and hosts a variety of small, medium and large-scale enterprises. It is an emerging city that provides affordable housing and a decent standard of living.
The bus transport service is provided by Pune Mahanagar Parivahan Mahamandal Limited (PMPML) in both the cities of Pune and Pimpri Chinchwad [37, 38]. However, the city transport services provided by PMPML, which is a Special Purpose Vehicle (SPV), seem inefficient while meeting the growing mobility demands of the twin cities of Pune and Pimpri Chinchwad. The SPV of PMPML is also suffering from poor financial health, as it is funded by local bodies of PMC and PCMC [8]. Among the metropolitan cities in the country, Pune has the worst public transport system in place [39]. In addition, the BRTS services launched in 2006, have failed to take off successfully owing to poor planning, design and inappropriate implementation, resulting in accidents, less number of buses and absence of adequate non-motorised transport infrastructure (cycle tracks and footpaths) along the BRTS routes [40].
Pune Metropolitan Region (PMR), which includes the twin cities of Pune and Pimpri Chinchwad, has observed significant growth in industrial and service sectors, resulting in rapid population growth and migration over the last 20 years (2000-2020). During the same time frame, the population of both cities has increased by around 90% and the number of vehicles increased by 700%. Based on the data that was collected from the Regional Transport Office (RTO), the number of vehicles has increased to 49,79,985 in 2017 from 7,88,223 in 1997 [41].
Figure 1. Maps of Pune (top left), Pimpri Chinchwad (top right), Bangalore (bottom left) and Indore (bottom right)
Source: [42-44].
Table 2. Crucial facts of the selected cities (2022-2023)
|
City |
State |
Population |
Metropolitan Population |
Area (in sq. km.) |
Bus Operator |
|
Pune & Pimpri Chinchwad |
Maharashtra |
6688000 |
6975000 |
693 |
PMPML |
|
Bengaluru |
Karnataka |
11644000 |
11750000 |
712.54 |
BMTC |
|
Indore |
Madhya Pradesh |
2707000 |
2992000 |
130.17 |
AiCTSL |
Notes: Pune & Pimpri Chinchwad Pune and Pimpri Chinchwad have been clubbed together in the Table-2, since they share the bus transport facility provided by PMPML. Source: Author's compilation from multiple sources [32-34, 51-53].
iii. Bangalore, the third largest city in India and the capital city of the state of Karnataka state holds its importance in terms of the IT hub of India. It ranks fourth in the list of technology clusters of the world [45]. The city has been ranked first on the EoLI framework in 2020 [34]. The city falls under the jurisdiction of Bruhat Bengaluru Mahanagara Palike (BBMP), administering an area of 712.54 sq. km. The Bengaluru Metropolitan Transport Corporation (BMTC) is the agency that manages and operates the bus transport services for the city [46]. The BMTC bus services have been one of the country's profit-making urban public bus transport undertakings [47].
iv. Indore, governed by the Indore Municipal Corporation (IMC), is a city in Madhya Pradesh. It is the sixth largest city in the country with an area of 525 sq. km. Ranked 14th in terms of population, the city has been featured for the fourth time in a row as the cleanest city in the country (until 2019) under the Central government's cleanliness survey - Swachh Bharat Abhiyan [48]. The city also ranks first on the MPI until 2021. Atal Indore City Transport Services Ltd. (AiCTSL), which is an SPV model, provides the city bus services. The operator has been known to run one of the most successful and efficient models of BRTS in India, named - iBus. Furthermore, they have a range of services provided, such as city bus, Atal City Bus (midi buses), sky bus (intercity and interstate AC buses), iBike (public bicycles), iRide (rental bike service of 2-wheelers) and on-call taxi services, which makes commuting easier for the citizens [49]. They have also collaborated with private operators to run buses, ensure service quality and provide real-time bus information and computerised ticketing facilities for commuters [50].
Referring to Table 2, which shows the crucial facts of the selected cities for the study [51-53]. Considering the wide experience of these four selected cities in terms of city bus services, where Bangalore and Indore are performing better as compared to Pune and Pimpri Chinchwad. The model adopted by Bangalore and Indore are, however different, where the former having the largest area and a large number of buses and the latter being technologically advanced, with BRTS and Public-Private Partnership (PPP) - as some of its characteristic features. Therefore, the growing twin cities of Pune and Pimpri Chinchwad have lessons to learn from the other two selected cities.
In both the cities of Pune and Pimpri Chinchwad, under PMPML, there are about 1619 buses (as against 2181 scheduled) that go around each day, carrying about 11 lakhs passengers (daily) over 378 total routes [54]. Of the total number of buses, PMPML has 150 electric buses; the rest are diesel or CNG buses [55]. Almost all the privately contracted buses are either CNG or electric. However, the worrying factor is that - this number of people using public bus transport is out of 66 lakhs of the combined population of the two cities in 2023 - indicating that citizens still prefer to use private modes of transportation. This is mainly because public bus services offered by cities often lack quality, reliability and most importantly the city level finances are not enough to provide for more buses. Thus, cities need to generate local-level finances and improve the quality and frequency of their bus services to increase ridership [56].
Table 3. Estimation of annual maintenance charges for all buses
|
City |
Total Buses |
Monthly Maintenance Cost (per Bus) |
Monthly Maintenance Cost (All Buses) (in Rs. crores) |
Annual Maintenance Cost (All Buses) (in Rs. crores) |
|
Pune (PMC) and Pimpri-Chinchwad (PCMC) |
2181 |
25,000 |
5.45 |
65.43 |
|
Bangalore |
6767 |
25,000 |
16.91 |
203.01 |
|
Indore |
2321 |
25,000 |
5.80 |
69.63 |
Source: Author's Calculations.
Table 4. Bus transport availability versus requirement (as per latest available data)
|
City |
[a] Fleet Size |
Metropolitan Population |
[b] Required Fleet Size as per Norms-55 Buses/Lakh |
[b-a] Surplus |
Available Buses per Lakh Population |
|
Pune and Pimpri-Chinchwad |
2181 |
6975000 |
3836 |
-1655 |
31.27 |
|
Bangalore |
6767 |
11750000 |
6463 |
305 |
57.59 |
|
Indore |
2321 |
2992000 |
1646 |
675 |
77.57 |
Source: Author's Calculation.
Around 55 transport buses are required per 1 lakh population in each city [57]. Buying and maintaining a bus is an expensive function for the ULBs in the country, who are already financially weak - as is also seen from the existing literature. Each electric bus costs around Rs.2 crores, a diesel bus costs around Rs.45 lakhs, while CNG bus costs up to Rs.35 lakhs [58]. Due to the high price of the buses, PMPML usually ropes in private contractors for operating a few buses [59].
The life span of each bus is about 9.6 years; hence, each city will have to keep making capital investments for bus transport at least once in 9.6 years. It is imperative to upgrade buses from time to time, since the breakdown of PMPML-owned (Diesel and CNG) buses earlier (before 2015-16) stood at over 30 breakdowns daily. However, with the presence of electric buses in PMPML's fleet, the breakdowns have been reduced to 20 per day [58].
Further, the per kilometer cost for a diesel bus is Rs.30, while for a CNG bus, it is Rs.20, and for an electric bus, it is Rs.10. An electric bus has to be recharged for three hours, following which it can be operated for 150 km. For three hours of charging an electric bus, PMPML incurs an expenditure of approximately Rs.1500. On the other hand, the cost to run a diesel bus is Rs.4500 for a distance of 150 km, and this showcases how much PMPML can save by employing more electric buses over the diesel buses [58].
The transport body of PMPML (which administers the bus transport service in PMC and PCMC) spends around Rs.25,000 per month on maintaining a regular bus, which makes it Rs.3 lakhs (per bus) per month - refer to above Table 3. The PMPML has been, facing huge losses in terms of maintenance costs for the regular diesel and CNG buses along with e-buses and minibuses [57]. Therefore, for the total number of buses, the maintenance cost becomes Rs.65.43 crores annually, which is a small share in their annual budgets of Rs.6765 crores for PMC and Rs.4620 crores for PCMC respectively (however excluding buying of new buses) [60, 61]. Thus, increasing the amount spent on maintenance will increase the effective number of buses running, decrease the breakdown rate and improve the frequency of buses in the twin cities. The above analysis, therefore, provides an evaluation of PMPML, showcasing the fleet of buses and finances required from both the ULBs of Pune and Pimpri Chinchwad to support their bus transport systems and improve ridership.
For Bangalore, 6767 buses go around in the city per day. The maintenance cost for the total number of buses is estimated at Rs.17 crores monthly, which becomes Rs.203 crores annually. This calculated amount is what the BMTC needs to give out of its annual budget of Rs.7067 crores (2019-2020), just for the maintenance of the existing buses and does not include the capital investment required for buying of new buses - refer to the above Table 3.
It should be noted that, in Bangalore, the effective number of buses on the road has declined from 85% to 58% between 2019-2020 and 2021-2022, thereby reducing the fleet of buses below the optimal level of operation. Pre-Covid, with a fleet utilisation of 85%, the shortage of buses is estimated at 704 and post-covid, with a fleet utilisation of 58%, the lack of buses is estimated to be more than 2,500.
In Indore, there are around 2321 buses as of 2017-18. Thus, the bus maintenance cost for AiCTSL in Indore is Rs.5.8 crores per month, which becomes Rs.69 crores annually. This is the amount that Indore had to shell out of its annual budget of Rs.4,824 crores in 2018-2019 (excluding buying of new buses).
From the above Table 4, the total available fleet of buses on a given day is taken for calculation along with the metropolitan population of the cities. The above table showcases the difference in the number of buses available (at present) compared to the number of buses required per one lakh population in the selected cities. The surplus of buses stands at 675 for AiCSTL in Indore, 305 for BMTC in Bangalore and a shortage of 1655 buses for PMPML in Pune and Pimpri Chinchwad cities. This indicates that the cities of Indore and Bangalore provide approximately 77.5 and 57.59 buses for every one lakh of the population, as against the required number of 55 buses - which in turn reflects the efficient allocation of resources and quality bus transport system. On the other hand, with Pune and Pimpri Chinchwad there is less than 60% availability of required buses and hence the pressing need for improvement either through better maintenance of existing bus fleet or by procuring new buses (while increasing the capital expenditure).
As can be seen from the above analysis, there is a shortage of buses in Pune and Pimpri Chinchwad, and hence it becomes necessary to estimate the cost for increasing the overall fleet of buses. A diesel bus costing around Rs.45 lakhs about 6.54% (Rs.744.75 crores) of their combined budget (Rs.11385 crores) should be allocated for buying new diesel buses, excluding the O&M costs. However, aligning with the environmental and sustainability viewpoints, it is recommended to prioritise the usage of e-buses, which cost about Rs.2 crores per bus. The e-buses have the potential for savings in terms of reduced O&M costs, lesser running expenses and fewer breakdowns. With an e-bus costing more than Rs.2 crores, about 29.08% (Rs.3310 crores) of their combined budget (Rs.11385 crores) should be allocated for buying new e-buses, which will also help in controlling the air population and improve the environment in the twin cities and lastly, will aid in achieving SDG-11.2.
4.1 What can Pune and Pimpri Chinchwad learn from Bangalore, Indore and global best practices?
Based on the assessment of the funds needed to purchase the required number of buses by selected ULBs, it can be observed that a large part of the city's funds from the (transport) budget get exhausted on the purchase of new buses, excluding the O&M costs. Therefore, purchasing new buses from the existing city budget (without any support from the State and Central Government) is not feasible for the selected ULBs - to provide improved services to the commuters. In this scenario, the possible options that PMPML (for Pune and Pimpri Chinchwad) can look at are described below;
i. Both the cities of Pune and Pimpri Chinchwad can raise quotations for the required number of buses under the centrally funded schemes like Smart City Mission (SCM) and Atal Mission for Rejuvenation and Urban Transformation (AMRUT), which were introduced in 2015. Under such schemes, the cities could request the Central Government to fund the purchase of buses either fully or partially. With an adequate number of buses, these cities would then be able to provide quality transport services, thereby raising the ridership and eventually would be able to make some operational profits, as in the case of Bangalore transport services.
ii. Further, under the SCM scheme, the Pune Metro Project is being constructed and implemented by the Maha Metro, connecting the twin cities, which is likely to complement buses and will aid in easing private vehicular congestion and reduce air and noise pollution [62].
iii. AiCSTL in Indore represents a city where the availability of buses per lakh of population is around 2.5 times more than as compared to PMPML. The fleet of buses at AiCSTL comprises of different sizes of buses, which allows them to cater to citizen’s needs, in an efficient manner. This can easily be implemented in Pune, Pimpri Chinchwad and other cities in the country.
iv. Further, AiCSTL in Indore is able to provide a better quality of services by incorporating smart infrastructure into the existing system, such as fast ticketing, real-time information on the buses, apps for live tracking, route details, digital route maps with real-time data, etc., which help the commuters by providing a smooth and easy travelling experience. Along with the bus services, they have created a wide network of multi-modal transport systems with auto rickshaws, taxis, ibikes and ibicycle or cycle sharing, complementing the existing public transport system.
v. The interventions of private operators in the transport system with regulations have helped in catalysing the system into a model of improved, convenient and efficient services for the users in Indore. Privatisation and low-cost technology implementation is a crucial takeaway from Indore [50]. Pune and Pimpri Chinchwad can, therefore, learn from the example of Indore and transform conventional bus services into smart transportation and multimodal systems to provide for the combined population of twin cities.
vi. The local taxes in Singapore make it expensive to procure private vehicles. This should be considered a strategy with dual intentions - one that helps raise finances for the ULBs and other that discourages using private cars and bikes in a city [63].
vii. The city of Seoul, which is the capital of South Korea, planned various modes of public transportation to ease traffic congestion and first among them was the Bus Rapid Transit System (BRTS). To deliver and promote the required public transport, Seoul created more than 400 bus routes, wherein buses were colour-coded. The local government, therefore, committed itself to providing more public vehicles instead of creating additional roadways for private vehicles. Another intervention for controlling traffic congestion and supporting buses was enhancing subway rail transport [39].
viii. To mitigate automobile-caused negative externalities, the cities of Hasselt in Belgium and Templin in Germany devised an innovative plan. The plan was to subsidise public vehicles instead of private vehicles [24]. To reduce the number of private vehicles plying on the road, the city made its buses fare-free. That is, the city buses were free of cost to be travelled in. This not only encouraged the movement of people from private to public modes of transport but also reduced congestion on city roads [39].
ix. Smart fare strategies often leverage technology to make fare payment easier and more user-friendly, improving the convenience of using public transportation. For example; contactless smart cards, such as London's Oyster card and Hong Kong's Octopus card, allow passengers to tap their card at entry and exit points, automatically calculating and deducting the fare based on the distance travelled. These cards can also be used for other services like buses, trams, and retail transactions.
4.2 Limitations of the study
Due to a lack of adequate and transparent literature, some findings have not been extended over multiple years. Research in this area, therefore, would require extensive data collection and analysis. The Census of India data is old and outdated (since the Census survey was delayed due to the COVID-19 pandemic); hence, relevant predictions may not be very accurate. Furthermore, the city budgets were in regional languages and, therefore, had to be translated into English, which was a tedious process. Lastly, urban challenges, budget allocations and capital expenditures can vary significantly from one city to another and the provided recommendations may not account for this diversity.
Along with providing environmentally friendly transport options, encouraging citizens to use them and shift from private to public transport options is also imperative. Cities like Pune and Pimpri Chinchwad can provide an efficient and sustainable transportation network; it is only a matter of converting words into actions as laid down in various transport policies.
It can thus be concluded that, in all the selected cities, a majority of bus transport projects are financially supported by city budgets [64]. It is observed that the higher the dependence on local budgets, the lower the speed of initiating new bus transport projects in India. Thus, innovative financing mechanisms to fund sustainable urban transportation, MRTS and bus transport projects must be devised and used in most Indian cities, along with improved allocations from the Center and State Governments.
In terms of the policy recommendation for financing the public urban transport system, one solution is to use some amount of collected local taxes and user charges for improvements. ULBs could levy charges on people (like retailers, real-estate owners, employers, etc.), who directly get benefited from the construction and services of public transport facilities, for example; construction of a metro rail in a particular area may be granted higher Floor Space Index (FSI) at an extra cost by the local government. Additionally, taxes and fees can be imposed on the citizens, whose travelling choices are unfavourable to the economy, such as private transport users. Such fees and user charges could include tolls on urban roads, congestion charges, pollution charges, higher fuel taxes and parking fees [65, 66].
Further, ‘smart fare and product strategies’ can also be used, providing many unexplored opportunities. Smart fares could be applied to daytime pricing or distance-based pricing or providing premium services at a higher fare. Smart fare strategies that are technology-enabled could be implemented to improve the overall public transport efficiency.
Moreover, specified discounts like loyalty schemes could help increase the annual revenue per passenger and thereby help in improving overall customer satisfaction. Technological advancements can be implemented to design sophisticated and easy-to-understand fare structures [65]. Furthermore, alternate sources for funding, such as carbon trade, advertising on buses and at metro stations and higher parking costs for private vehicles, can encourage the ridership of buses and metro [67, 68].
Thus, several innovative financing mechanisms can be utilised to fund local public transportation in cities from emerging economies like India - only if the local governments are willing to implement the same. These innovative financing options will become necessary in due course of time, for the cities to provide for safe, affordable, accessible and sustainable urban transportation services - as is also envisaged in the 11th UN-SDG.
[1] World Bank. (2023). Urban population (% of total population). World Urbanization Prospects: 2018 Revision.
[2] World Urbanization Prospects. (2018). Department of economic and social affairs population division.
[3] RIS. (2018). Mass rapid transportation systems in India - A background paper. Mass rapid Transport Systems for Urban Areas: Opportunities and Challenges. http://www.ris.org.in/sites/default/files/AIIB%20MRTS%20Meeting%20Background%20Note.pdf.
[4] Airy, A., Chandiramani, J. (2019). Urban transport policy in India: A Review. International Journal of Public Sector Performance Management, 5(3/4): 399-414. https://doi.org/10.1504/IJPSPM.2019.10022464
[5] UN. (2019). World Population Prospects 2019. https://population.un.org/wpp/Download/Standard/Population/, accessed on Aug. 19, 2019.
[6] The World Bank. (2019). GNI per capita (constant 2015 US$) - India. https://data.worldbank.org/indicator/NY.GNP.PCAP.KD?locations=IN, accessed on Sept. 7, 2019.
[7] The Constitution (Seventy-Fourth Amendment) Act (1992). Official Portal of the MoHRD, Government of India. https://www.india.gov.in/my-government/constitution-india/amendments/constitution-india-seventy-fourth-amendment-act-1992, accessed on Sept. 17, 2021.
[8] Airy, A., Patil, G. (2019). Is India financing urban transport in the right direction? International Journal of Innovative Technology and Exploring Engineering, 8(11): 142-147. https://doi.org/10.35940/ijitee.K1260.0981119
[9] Arkatkar, S.S. (2018). Traffic operations and capacity analysis in India. The International Journal of Transportation, 10(2): 65-67. https://doi.org/10.1080/19427867.2017.1374007
[10] Verma, A., Harsha, V., Subramanian, G.H. (2021). Evolution of urban transportation policies in India: A review and analysis. Transportation in Developing Economies, 7(2): 25. https://doi.org/10.1007%2Fs40890-021-00136-1
[11] Baindur, D. (2015). Urban transport in India: Challenges and recommendations - IIHS RF paper on urban transport. Indian Institute for Human Settlements, pp. 1-40. https://doi.org/10.24943/9789387315167
[12] SIAM. (2023). Automobile domestic sales trends. https://www.siam.in/statistics.aspx?mpgid=8&pgidtrail=14.
[13] Kaulgud, H. (2013). Modern trams (light rail transit) for cities in India. FICCI. https://smartnet.niua.org/sites/default/files/resources/Modern%20Trams.pdf.
[14] Gwilliam, K.M. (2002). Cities on the move: A World Bank urban transport strategy review (English). Washington, D.C.: World Bank Group.
[15] Singh, S.K., Padam, S. (2001). Urbanisation and urban transport in India: The sketch for a policy. Social Science Research Network, pp. 1-50. http://doi.org/10.2139/ssrn.573181
[16] Pucher, J., Korattyswaroopam, N., Ittyerah, N. (2004). The crisis of public transport in India: Overwhelming needs but limited resources. Journal of Public Transportation, 7(3): 95-113. https://doi.org/10.5038/2375-0901.7.3.5
[17] Reddy, S.B., Balachandra, P. (2011). Dynamics of urban mobility: A comparative analysis of megacities of India. Indira Gandhi Institute of Development Research, pp. 12-32.
[18] Singh, S.K. (2012). Urban transport in India: Issues, challenges, and the way forward. European Transport/Trasporti Europei, 1-26.
[19] Pardo, C. (2015). Sustainable urban transport. Shanghai Manual - A Guide for Sustainable Urban Development in the 21st Century. http://www.un.org/esa/dsd/susdevtopics/sdt_pdfs/shanghaimanual/Chapter%204%20-%20Sustainable%20urban%20transport.pdf.
[20] Eboli, L., Mazzulla, G. (2012). Performance indicators for an objective measure of public transport service quality. European Transport, 51: 1-4. http://hdl.handle.net/10077/6119.
[21] Anderson, R., Condry, B., Findlay, N., Brage-Ardao, R., Li, H.J. (2013). Measuring and valuing convenience and service quality: A review of global practices and challenges from mass transit operators and railway industries. International Transport Forum Discussion Papers, 1-47. https://doi.org/10.1787/5k3z04gb6zs1-en
[22] Dhingra, C. (2011). Measuring public transport performance: Lessons for developing cities. Sustainable Urban Transport Technical Document, 9(11): 1-50.
[23] Fearnley, N. (2013). Free fares policies: Impact on public transport mode share and other transport policy goals. International Journal of Transportation, 1(1): 75-90. https://doi.org/10.14257/ijt.2013.1.1.05
[24] Gabaldón-Estevan, D., Orru, K., Kaufmann, C., Orru, H. (2019). Broader impacts of the fare-free public transportation system in Tallinn. International Journal of Urban Sustainable Development, 11(3): 332-345. https://doi.org/10.1080/19463138.2019.1596114
[25] Kębłowski, W. (2018). A “New May 1968” in Aubagne? Free Public Transport and Why we Don't Pay to Ride Elevators, 102-109.
[26] Transport for NSW. (2014). Customer Satisfaction Index 2014. New South Wales: NSW Government, https://www.transport.nsw.gov.au/sites/default/files/media/documents/2017/customer-satisfaction-index-and-appendix-2014.pdf, accessed on Nov. 17, 2023.
[27] Parisar. (2020). Lakh ko Pachaas: Parisar to steer SUM Net's Maharashtra Bus Campaign. https://parisar.org/what-we-do/urban-transport/programmes/sustainable-urban-mobility-network-sum-net/lakh-ko-pachaas-parisar-to-steer-sum-net-s-maharashtra-bus-campaign#:~:text=With%20this%20as%20the%20central,%2C%20Nashik%2C%20Aurangabad%20and%20Amaravat.
[28] MGI. (2010). India's urban awakening: Building inclusive cities, sustaining economic growth. Executive summary. https://www.mckinsey.com/~/media/McKinsey/Business%20Functions/Operations/Our%20Insights/Urban%20awakening%20in%20India/MGI_Indias_urban_awakening_executive_summary.pdf.
[29] HPEC. (2011). Urbanization in India - HPEC report and recommendations. Report on Indian Urban Infrastructure. and Services. https://icrier.org/pdf/FinalReport-hpec.pdf.
[30] Jain, M., Joshi, R. (2015). Municipal finances in India: Unresolved issues and way forward. The 21st Century India, 1-42.
[31] Rao, M.G., Bird, R.M. (2010). Urban governance and finance in India. Rotman School of Management Working Paper, 1568858: 1-43. http://doi.org/10.2139/ssrn.1568858
[32] Pune Census (2023). Population Census. https://www.census2011.co.in/census/city/375-pune.html#:~:text=The%20current%20estimate%20population%20of,based%20on%20past%20growth%20rate, accessed on Jul. 01, 2023.
[33] India TV. (2023). Pune bigger than Mumbai! Largest city in Maharashtra and 7th in India. https://www.indiatvnews.com/news/india/pune-become-biggest-city-maharashtra-mumbai-no-more-largest-city-pune-7th-big-city-in-india-715993/, accessed on Jul. 01, 2023.
[34] PIB. (2021). Bengaluru, Pune, Ahmedabad best cities in EoLI 2020 (Million Plus Category). Ministry of Housing & Urban Affairs. https://pib.gov.in/PressReleasePage.aspx?PRID=1702417, accessed on Jul. 12, 2022.
[35] PMC. (2012). Revised City Development Plan (CDP) of Pune City - 2041. Pune Municipal Corporation.
[36] PCMC (2014). System of assisting residents and tourists through helpline information (SAARTHI). Pimpri Chinchwad Municipal Corporation. https://www.pcmcindia.gov.in/pdf/SARATHI.pdf.
[37] Pimpri and Chinchwad Population 2023. Population Census. https://www.census2011.co.in/census/city/376-pimpri-and-chinchwad.html#:~:text=The%20current%20estimate%20population%20of,was%20postponed%20due%20to%20Covid., accessed on Jul. 14, 2023.
[38] The Times of India. (2014). PMPML struggles to maintain buses. https://timesofindia.indiatimes.com/city/pune/PMPML-struggles-to-maintain-buses/articleshow/40024773.cms, accessed on Sep. 20, 2021.
[39] Khandelwal, T. (2017). Subsidy in Parking. In Transforming India 2030: Strategies for Sustainable Development Goals, Pune, New Delhi, pp. 285-312.
[40] Joshi, E. (2019) 12 years and 1100 crores behind it, Pune BRTS fails to solve commuter woes. Citizen Matters. https://citizenmatters.in/pune-bus-rapid-transit-brts-shortcomings-13365, accessed on Jun. 16, 2021.
[41] Kulkarni, S., Rashid, A. (2017). In 20 years, population of Pimpri-Chinchwad, Pune increased by 90%, traffic by 700%. The Indian Express. https://indianexpress.com/article/cities/pune/in-20-years-population-of-pimpri-chinchwad-pune-increased-by-90-traffic-by-700-4748301/, accessed on Aug. 13, 2020.
[42] Pune Taluka Map. Maps of India. https://www.mapsofindia.com/maps/maharashtra/tehsil/pune.html, accessed on Apr. 23, 2023.
[43] Indore district map. Maps of India. https://www.mapsofindia.com/maps/madhyapradesh/districts/indore.html, accessed on Apr. 23, 2023.
[44] Petkar, A.S., Macwan, J.E.M., Takkekar, D.L. (2015). Residential development trend analysis in a fast growing Indian city. International Journal of Engineering Research & Technology, 4(7): 675-681. http://doi.org/10.17577/IJERTV4IS070477
[45] Industries in Karnataka. Karnataka.com. https://www.karnataka.com/industry/, accessed on Aug. 23, 2023.
[46] Verma, M., Verma, A., Ajith, P., Sindhe, S. (2014). Urban bus transport service quality and sustainable development: Understanding the service gaps. Indian Journal of Transport Management, 38(2): 98-112.
[47] Hanumappa, D., Ramachandran, P., Sitharam, T.G., Lakshamana, S., Mulangi, R.H. (2016). Performance evaluation of premium services in Bangalore Metropolitan Transport Corporation. Transportation Research Procedia, 17: 184-192. https://doi.org/10.1016/j.trpro.2016.11.074
[48] India Today. (2019). Sonia Gandhi as interim Congress chief: Why wait for non-Gandhi party chief is futile. https://www.indiatoday.in/news-analysis/story/sonia-gandhi-interim-congress-president-rahul-gandhi-1709698-2020-08-10, accessed on Apr. 27, 2021.
[49] AiCTSL. http://www.citybusindore.com/, accessed on Aug. 23, 2023.
[50] Sharma, A.K., Gupta, A. (2009). Indore city bus: A novel experiment in urban transport. Great Lakes Herald, 3(2): 15-41. https://www.greatlakes.edu.in/pdf/indoreCity.pdf.
[51] City Census 2011. Population Census. https://www.census2011.co.in/city.php., accessed on Apr. 05, 2023.
[52] Bangalore Population 2023. Population Census, https://www.census2011.co.in/census/city/448-bangalore.html, accessed on Apr. 05, 2023.
[53] Indore Population 2023. Population Census, https://www.census2011.co.in/census/city/299-indore.html, accessed on Mar. 03, 2023.
[54] Pune Mahanagar Parivahan Mahamandal LTD-Dashboard. https://www.pmpml.org/.
[55] Indian Express. (2021). Low running cost, zero breakdowns push Pune’s PMPML to add 500 e-buses to fleet. https://indianexpress.com/article/cities/pune/pune-pmpml-to-soon-add-500-electric-buses-to-its-fleet-7543793/, accessed on Dec. 23, 2022.
[56] Sengupta, J. (2020). PMPML plans jingles & advertisements to improve ridership. The Times of India. https://timesofindia.indiatimes.com/city/pune/pmpml-plans-jingles-ads-to-improve-ridership/articleshow/74274098.cms, accessed on Aug. 2, 2020.
[57] Ranjan, R. (2019). PMPML spends Rs.25,000 per month per bus on maintainance. The Bridge Chronicle. https://www.sakaltimes.com/pune/pmpml-spends-rs-25000-month-bus-maintenance-35135, accessed on Aug. 2, 2020.
[58] Nag, D. (2021). Low running cost, zero breakdowns & more benefits! Pune’ s transport undertaking to add 500 e-buses to its fleet. Financial Express. https://www.financialexpress.com/business/infrastructure-low-running-cost-zero-breakdowns-more-benefits-punes-transport-undertaking-to-add-500-e-buses-to-its-fleet-2341612/, accessed on Sep. 28, 2022.
[59] Vaidya, A. (2018). Monday Musings: Electric buses for Pune? At what cost? https://www.hindustantimes.com/pune-news/monday-musings-electric-buses-for-pune-at-what-cost/story-RqD9zLErFviK1gZymTH0yL.html/, accessed on Sept. 13, 2022.
[60] HT Pune Correspondent. (2019). Pune Municipal Corporation presents ₹6,765 crore budget, Mulik focuses on Ahmednagar road. Hindustan Times. https://www.hindustantimes.com/pune-news/pune-municipal-corporation-presents-rs-6-765-crore-budget-mulik-focuses-on-ahmednagar-road/story-W5XbcQtRsXcILpTmB3iQMN.html/, accessed on Aug. 11, 2020.
[61] HT Indore Correspondent. (2019). Rs 4,620 crore Pimpri Chinchwad Municipal Corporation draft budget sees no hike in taxes. Hindustan Times. https://www.hindustantimes.com/pune-news/rs-4-620-crore-pimpri-chinchwad-municipal-corporation-draft-budget-sees-no-hike-in-taxes/story-9XU5Irlij9cqQbPoouLuNP.html/, accessed on Aug. 11, 2020.
[62] More, D. (2023). Finally, big cheer for commuters as Pune Metro gears up to touch down at Shivajinagar after May 15. the Indian Express. https://indianexpress.com/article/cities/pune/big-cheer-commuters-pune-metro-shivajinagar-after-may-15-8549109/, accessed on Sept. 16, 2023.
[63] Chen, Z.N., Yang, Z.F., Wappelhorst, S. (2022). Overview of Asian and Asia-Pacific passenger vehicle taxation policies and their potential to drive low-emission vehicle purchases. White Paper-International Council on Clean Transportation. https://theicct.org/wp-content/uploads/2022/01/Asia-Vehicle-Tax_whitepaper_final.pdf.
[64] Nalle, V.I.W., Syaputri, M.D., Krisnanto, W., Tjandra, O.C.P. (2023). Public participation in bus transit policymaking: The case of Semarang International Journal of Transport Development and Integration, 7(3): 235-245. https://doi.org/10.18280/ijtdi.070307
[65] Anne, G. (2017). Financing public transport Press Kit. Financing Public Transport.
[66] Sargisson, R.J. (2018). Do parking fees affect commuting choices of staff and students on a university campus? International Journal of Transport Development and Integration, 2(2): 189-201. https://doi.org/10.2495/TDI-V2-N2-189-201
[67] Patil, G., Vhavale, A. (2022). Innovative financing and marketing strategies for open spaces: A case of Pune City in India. Business Strategy & Development, 6(2): 158-165. https://doi.org/10.1002/bsd2.230
[68] Mathews, S., Thadathil, T. (2023). Travel demand model for the purpose of education, Pune City, India. International Journal of Transport Development and Integration, 7(3): 267-272. https://doi.org/10.18280/ijtdi.070310