Frans Bal![]() | Jaap Marinus Vleugel*
| Jaap Marinus Vleugel*![]()
© 2023 IIETA. This article is published by IIETA and is licensed under the CC BY 4.0 license (http://creativecommons.org/licenses/by/4.0/).
OPEN ACCESS
Climate change is related with weather extremes, which may cause damages to infrastructure used by freight transport services. Heavy rainfall may lead to flooding and damage to railway lines, roads and inland waterways. Extreme drought may lead to extremely low water levels, which prevent safe navigation by inland barges. Wet and dry periods may alternate, leaving little time to repair damages. In some Western and Middle-European countries, barges have a large share in freight transport. If a main waterway is out of service, then alternatives are called for. Volume- and price-wise, trucking is not a viable alternative. Could railways be that alternative? The paper was written after the unusually long dry summer period in Europe in 2022. It deals with the question: If the Rhine, a major European waterway becomes locally inaccessible, could railways (temporarily) play a larger role in freight transport? It is a continuation of our earlier research. It contains a case study, the data of which was fed into a simulation model. The model deals with technical details like service specification route length, energy consumption and emissions. The study points to interesting rail services to keep Europe’s freight on the move. Their realization may be complex especially in terms of logistics and infrastructure, but is there an alternative?
climate change, resilience, rail freight, barges, international, modelling
1.1 Rising temperatures and the weather
Climate change has a profound and structural, impact on the weather. Many countries and regions in the world experience excessive wet and/or dry periods. Humid areas will become more humid and arid areas (gradually) turn into semi-deserts [1]. This paper, a successor of the study [2], deals with Western and Middle-European countries, whose historically moderately humid climate is changing. Higher average temperatures and less predictable weather throughout the year will affect the physical transport infrastructure; railways, roads and waterways and the logistic services using it.
1.2 Two weather extremes
Large clouds were trapped above hilly terrain due to a lack of wind [3] in the Netherlands, Belgium, Germany and Switzerland in July 2021. Then it started raining for days on end above specific (geographically elevated) regions. Rivers and canals were unable to cope with such volumes of rain. They ran out of control, absorbed objects normally not present in waterways, damaged, dislocated and washed away physical structures like roads, railway tracks, bridges and locks. In this part of Europe, population density is high. The economies where they live depend on road, rail and water infrastructure. Damage to these infrastructures may disrupt the passenger and freight rail services using them. Only the estimated damage to rail infrastructure was already over 2 Bn Euros [4]. Total cost of flooding in Europe reached 43 Bn euro in 2021, making it the second most expensive after Hurricane Katrina [5]. These costs are a preview of what can be expected in future. A recent scenario study for the years 2022-2050 estimates an accumulated loss of GDP of 5.6 Tn USD for (just) 7 countries and 10 geographies around the world [6].
The other extreme, a lack of water, also has serious consequences. Europe faced an extremely warm summer, with temperatures reaching up to 45 degrees Celsius for weeks on end in the summer of 2022 [7]. Lack of rain, combined with lack of mountain melt water and excessive evaporation, caused water levels in rivers and canals to drop to their lowest level in 500 years. Ground water levels were also affected. Such conditions caused major havoc for the environment, agriculture, the water- and energy supply. Inland waterway transport was also disrupted, for instance between Germany and The Netherlands. Dykes and dams were also under threat of disintegration. When rains return, the soil cannot absorb the water. Flooding starts, damaging physical infrastructure in its path [8].
1.3 Climate resilience
Resilience may be defined “as the ability to withstand and recover rapidly from deliberate attacks, accidents, natural disasters, as well as unconventional stresses, shocks, and threats to the economy and democratic system” [9]. Important is the study [10]:
- “Understand the threats and vulnerability of a particular event or phenomenon, and both the likelihood and consequences of its impacts”;
- Determine the relative impact – is it easy to recover or is there a lasting impact?
Climate resilience connects climate change with resilience. Climate change risk is a function of threat (action: extreme weather) and vulnerability (degree of potential damage); R=T*V. Vulnerability is a function of sensitivity (degree of impact), exposure (location- and construction dependent) and adaptive capacity of humans (or nature). Managing risks involves acting on the threat or the vulnerability or both.
Reducing CO2-(equivalent) emissions reduces the speed of climate change and mitigates its impact. This process may take very long, which explains why adaptation is also a very important (intermediate) strategy [10].
1.4 Resilience in freight transport by barge and rail
Making freight infrastructure and freight services more resilient is a way of adapting to climate change. This paper will deal with large volume container transport in Europe. Inland waterway and rail play an important role in some of its countries. The European Commission (EC), the executive board of the EU, deems a major shift from road to rail necessary to mitigate transport-related climate change [11]. Yet, earlier modal shift policies were not effective; road transport continues to grow since decades, while rail is going the opposite way in nearly all EU countries [12]. Making rail freight services more competitive therefore also means assuring that its infrastructure becomes more resilient to climate change. For inland waterways a structural modal shift to rail is not foreseen, because of the current climate footprint of barge transport. But, as will be shown in section 4, it may be needed to make freight transport as such more resilient.
Other authors also addressed rail freight service resilience [13]. They considered the impact of extreme winter conditions on rail freight services in Norway, Sweden, Switzerland and Poland in 2010. They found that “railway operators were totally unprepared”. Instead of contingency plans, decision-makers relied on ad hoc measures. This meant that important railway links were unavailable with severe logistics implications and finally, a (further) loss of market share to road operators.
Finally, it is important to distinguish climate resilience from economic resilience. The latter refers to the susceptibility to economic shocks [14]. That vulnerability is not in the scope of this paper, although economic resilience may make it easier to invest in climate change mitigation and adaption solutions.
1.5 Research aim and questions
The aim of the paper is to explore the impact of a ‘No water’-scenario on freight transport by barge and railways by means of a hypothetical case study. This leads to the main research question: If the Rhine, a major European waterway becomes locally inaccessible, could railways (temporarily) play a larger role in freight transport? The main research question will be addressed by answering the following sub-questions:
1. What is the most interesting freight corridor to consider?
2. How could an average trip by barge look like under normal conditions?
3. If a considered waterway in this freight corridor is affected, what would be interesting alternatives by railways?
4. What would be the impact of these alternatives be on CO2-emissions?
5. What would be asked from the government in terms of policy?
Question 1 will be answered by means of map analysis. Questions 2-4 will be answered by means of a quantitative case study. Question 5 will be answered by deduction of the previous results combined with relevant literature. The main focus will be on the aftermath of a hypothetical event.
1.6 Scope
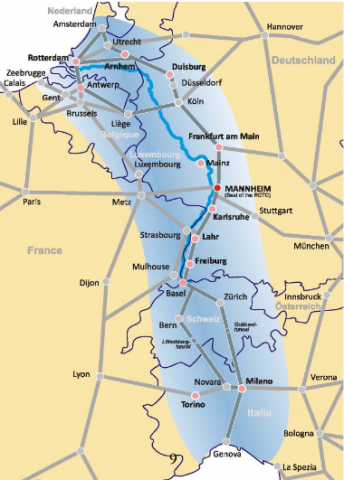
Figure 1. The Rhine-Alpine Corridor [15]
Figure 2. Rail freight corridors in Western and Middle-European countries [16]
After analysis of a map of Europe, the following choices were made to make the case study (section 4) manageable:
- Geography: Netherlands, Belgium, France, Germany and Switzerland;
- Transport corridor: These countries are in the Rhine-Alpine Corridor, which includes the Rhine River between Basel and Rotterdam (Figure 1) as well as by Rail Freight Corridor 2 (RFC 2; see Figure 2). The Basel-Rotterdam leg is the geographical core of the paper. The following choices were made because of practical reasons:
- Transport modes: Inland waterway transport and rail freight transport;
- Load units employed: Restricted to intermodal container transport.
- Timeframe: The year 2025.
These choices answer sub-question 1.
2.1 Freight transport by inland waterways in Europe
Transport by inland waterways is common in many countries of the world. In Europe, main rivers or canals are used for this purpose. Goods transported range from bulk to containers and special transports, like modules for bridges or vehicles. These goods can be transported over various distances. Part of this transport crosses international borders. Actual figures differ per country and are as such not interesting, because of the hypothetical nature of the case study, which will be illustrated in section 4.
There are some interesting technical details. First, the density of a waterway network navigable by inland barges is in general much lower than that of a road or rail network. Barges need ports to load and offload goods. In these ports goods are exchanged with trucks, trains, other barges or ships. Transshipment usually increases the trip time and costs.
Second, the size of inland barges provides them with a large carrying capacity (600 TEU (Twenty-foot Equivalent Unit) or more), which is much larger than a single truck or train (section 4).
2.2 Vulnerable to low water levels
Under average weather conditions, inland waterway transport can offer a reliable service. There is however a dependency on the weather conditions, which affects it as a transport system. This holds for high and low water levels. The first may make passing fixed bridges a problem, unless the load height is reduced, hence carrying capacity is reduced and more barges are needed. The second issue may mean that a waterway is no longer navigable [17]. As a consequence, barge transport at least experiences congestion, but in more delicate circumstances, the system may break down, with ships halted on the river or berthing in inland ports.
It is this challenge that is relevant for this paper. Issues such as traffic congestion or accessibility of ports are out of scope.
2.3 Synchromodal transport
Rail- and waterway transport have a large overlap in markets served in the countries mentioned in section 1.6. Replacing barges by trains could be a ‘synchro modal’ [18] solution, at least in theory, but there are important caveats, which will be discussed in sections 4 and 5.
3.1 Conditions and assumptions
Several assumptions were made because of practical concerns.
The focus is on freight services using waterway and rail infrastructure in Switzerland, Germany, France, Belgium and the Netherlands. The goods transported travel in this part of Europe. Externalities considered are the contribution to climate change (by CO2 emissions) as far as the available public data allow. The time horizon is the year 2025. This allows changes in international railway timetables, which is a complex process. It is assumed that the selected routes can technically be used by international freight services.
3.2 Research steps
The research for this paper was carried out as follows:
- Study literature. Select a relevant freight corridor from a set of possible corridors. Select services frequently mentioned in scientific and professional literature;
- Modify an existing scenario simulation model to include the studied routes/services;
- Collect additional data if needed and filter it. Fill gaps in data by assumptions;
- Run the model with the chosen routes and services to estimate energy consumption and CO2 emissions;
- Evaluate the experimental results quantitatively;
- Write policy recommendations based on this evaluation.
3.3 Modeling
The model to support the paper is a service-route-emissions model. It was built in MS© Excel©. The model contains
- A data entry and calibration module allowing definition of freight services, e.g., transport means, energy sources and rail track- and waterway (section) length;
- Matrices with energy consumption, emission factors (EF), Tank-To-Wheel (TTW) emissions.
- A choice box to estimate emissions of different source mixes to produce electricity;
- A solver module with policy scenarios as constraints to the linear programming.
A user can define a freight service scenario by selecting a specific route (section) and distance, uni- or multi modal transport vehicles, number of motorized units (locomotives, etc.), freight volume, vehicle weight, average load factor and energy type. The model then estimates emissions per scenario. The model was validated and updated in a series of earlier case studies, e.g. the study [19]. Energy consumption is an average based on the estimated trip kms via specific one-way routes. It was taken from the literature and validated by experts. Emissions are based on this estimated energy consumption and emission factors for each energy source. Only tank-to-wheel emissions were considered.
The embedded database with vehicle types and emission parameters is regularly updated to align with technical progress and research needs. This includes engine technology, energy category (fossil, blend, green alternatives), energy consumption per tkm, emission factors and electricity mix (% green-fossil) etc.
4.1 Introduction
The goal of this section is to elaborate several scenarios concerning a specific amount of goods (in TEU), which depending on the water levels, can be transported by barge and/or rail transport between Rotterdam and Basel.
4.2 Actual load per barge
The Rhine River is a natural river, with varying water levels. Climate change leads to even larger differences between high and low water levels, in summer as well in winter times. Being an important waterway, this can have a significant impact on inland shipping.
The actual load per ship varies with the hull design of the ship and its corresponding maximum load capacity at a given water level. Table 1 gives an overview of the maximum capacity and CO2 emissions in grams per tkm at normal average water levels.
Table 1. Carrying capacity and CO2-emissions by inland ship type
|
Barge Type |
Capacity in t |
Est. CO2 g/tkm |
|
Kempenaar – bulk |
600-680 |
32 |
|
Kempenaar – containers |
600-680 (Neokemp: 32 TEU) |
32 |
|
Large Rhine barge – bulk |
2,750 |
17 |
|
Large Rhine barge – containers |
3,500-4,200 (200 TEU; Rijnmax: 500 TEU) |
21 |
|
Push barge convoy (6) – bulk |
11,000-16,500 |
8 |
|
Push barge convoy – containers |
5,400 -6,000 (336-420 TEU) |
21 |
Sources: [20, 21]
The largest push-barge convoys can hold around 5,400-6,000 t (400-502 TEU), depending on the stack level (4-5) and bridge clearance.
CO2-emission factor estimates for barges in TTW vary between 0.02 and 0.24 [21], which is a very wide range. To simplify calculations, a value of 21 g/t(r)km [20] will be used as the average ship CO2-emission level per metric t per (Rhine)kilometer (rkm).
4.3 Moving along the Rhine River; Scenarios
The Rhine River has a length of 1,232 km between its origin in Switzerland and the North Sea delta in The Netherlands. The part that can be used for shipping stretches 1,035 km. The Rhine River is part of a major north-south multi-modal freight corridor; barge, rail and road infrastructure is running in parallel over long distances in this international corridor. This spatial concentration of infrastructures may challenge freight transport resilience (options). The (standard) routes follow logically from the chosen corridor. Alternative routes were chosen based on the study [19].
Freight transport scenarios were developed based on literature and practical information. Each scenario consists of a trip distance and volume transported by a certain barge type. CO2-emissions are estimated using these parameter values in conjunction with average estimated diesel fuel consumption and emission factors of diesel. The first scenario is based on an average barge (convoy) trip over the Rhine under average conditions. Separate scenarios were made for container and bulk transport.
4.3.1 Container transport by barge
According to Table 1, a theoretical maximum capacity for a barge (convoy) would be 6,000 metric t. In practice, this will not be reached. In 2010 an in-depth study (questionnaire) of container shipping in Western-Europe [20, 22] concluded, after considering three sections of the Rhine, that barges in use have a maximum capacity of 5,100 t, and can carry between 204-368 TEU, with an average container weight between 8.3 and 9.6 t, empty containers included.
Determining averages per trip for simulation purposes is complex due to:
• The large variation in ship type and size utilized on the Western European waterways, including the Rhine;
• The substantially fluctuating load per TEU over time and between upstream and downstream haul.
To cover these variations and simplify the estimations, an average load of 3,500 t was used in the model, which equals a ‘standard’ barge [23, 24]. Table 2 shows the results.
Table 2. Estimated CO2-emissions of a container barge with 3,500 t load
|
Barge |
Distance in rkm |
Load in metric t |
Est. CO2 in gram |
|
Rotterdam (NL) - Koblenz (G) - Mannheim (G) |
611 |
3,500 |
44,908.500 (44.9 t) |
|
Rotterdam - Koblenz - Mannheim - Basel (CH) |
868 |
3,500 |
63,798.000 (63.8 t) |
Source: Own estimations
4.3.2 Bulk transport by barge
For bulk transport, average actual load is much lower. An average barge with bulk hauled 1,725 t per trip [25] (Table 3), with an emission levels of 17 g/t(r)km for a large Rhine ship [26].
Table 3. Estimated CO2-emissions of a barge with 1,725 t of bulk load
|
Barge |
Distance in rkm |
Load in metric t |
Est. CO2 in gram |
|
Rotterdam - Koblenz - Mannheim |
611 |
1,725 |
17,917.575 (17.9 t) |
|
Rotterdam - Koblenz - Mannheim - Basel |
868 |
1,725 |
25,454.100 (25.5 t) |
Source: Own estimations
With these results, sub-question 2 has been addressed.
Exceptionally low (and high) water levels on the river Rhine cause problems at the village of Kaub in the Lorelei region of Germany. Extreme low water levels effectively pause barge transport, practically cutting the Rhine into two sections. It might happen that barge services have to be split in the Mannheim-Ludwigshafen (port) area. Transshipment from barge to barge is time consuming and costly. There is no large inland port between Mannheim/Ludwigshafen and Rotterdam, which means that an alternative has to be sought for barge transport. Given the large volume per barge, trucking is excluded, but rail might be interesting.
Also at less extreme water levels, a drop in water level already has an impact on transport by barge by reducing the volumes that can be transported safely. For example, every 10 cm reduction of the water level at the village of Kaub means that 100 t less cargo can be transported [27].
4.3.3 Container or bulk transport by rail; Scenarios
A container wagon such as a SGNS 691 can carry 70 t, either 4 20 ft (TEU) or 2 40 ft on a class D track. A train weight of 3,500 t would require 50 of such carriages. There have been experiments with a 750 meter train, that would allow 30 carriages to be hauled (±2,400 t). This is only possible if technical limitations are lifted. In practice, an average European freight train can have a maximum length of around 520 meters, which equals 21 container wagons. Eighty-four TEU can then be hauled per trip. Assuming an average container weight of 8.95 t/TEU this equals 752 metric t of cargo. To replace one barge with 3,500 t container cargo, 5 trains are needed. Bulk wagons can carry a higher load, which reduces the number of trains to 1-2 per service. Also here, actual volume and weight should be known to make detailed estimations.
The emissions of an electric locomotive are 0.01-0.02 g/tkm [28]. Older electric locomotives are less energy efficient, hence emit more CO2, than more recent ones.
In terms of cargo transported, there is no difference between container or bulk transport. Instead of containers, the 3,500 t cargo could also be bulk, such as iron ore [2]. Table 4 gives the corresponding results.
Table 4. Estimated load and CO2-emissions by hauling 3,500 t of cargo based on the travel distance
|
Train route |
Distance in rkm |
Load in metric t |
Est. CO2 in gram |
|
Rotterdam – Koblenz – Mannheim – Weil am Rhein – Basel |
875 |
61,215 |
0 |
|
Rotterdam – Lille (F) – Paris (F) – Reims (F) – Mulhouse (F) – St. Louis (F) – Basel |
1,053 |
73,696 |
4,582.865 (4.6 t) |
|
Rotterdam – Koblenz – Mannheim |
610 |
42,700 |
0 |
|
Detour via Paris |
|
|
|
|
Rotterdam – Lille – Paris – Reims – Metz (F) – Saarbrücken (G) – Mannheim |
971 |
67,942 |
3,869.593 (3.9 t) |
|
Detour via Grand-Est |
|
|
|
|
Rotterdam – Lille – Thionville (F) – Metz – Saarbrücken – Mannheim |
825 |
57,757 |
3,390.898 (3.4 t) |
Source: Own estimations
Trains in The Netherlands and Germany use green electricity. Swiss Railways (SBB) reaches almost the same level with a mix of 90% hydro-power and 10% nuclear power [29]. The distance from the Swiss-German border to Basel is small (8 km), hence the impact on CO2-estimations is also limited. Detours result in more kilometers, higher energy use and, when on run on Belgium and French soil, significant CO2-emissions [19].
The CO2-levels of inland shipping are high compared to trains due to the use of diesel instead of (green) electricity. Even a service with 5 trains emits less CO2 than 1 barge.
With Table 4, sub-questions 3 and 4 have been addressed.
4.4 Feasibility and policy options
A temporal modal shift from barge to rail would ask for many additional freight trains. A key problem is the lack of freight wagons and locomotives in an already saturated railway market. It may then be impossible to organize sufficient train capacity at the required moment. Railway capacity should also be ad hoc available in the out-of-service period.
This is again very unlikely, as railway contracts and international train schedules are arranged well in advance. Railway services should be able to run normally. With additional trains in already saturated corridor, this could become challenging.
Without a good alternative a stall of barge transport may have important logistic consequences. It is likely that goods have to be stored (temporarily) at an inland terminal or that production has to be halted temporarily. Seaports may run into problems if their inland waterway connection with their European hinterland is disrupted. An example is the following. Barge transport takes care of about 30% of all coal, iron ore and gas transported from Rotterdam via the Rhine to other parts of The Netherlands and the German hinterland [19]. In a situation with gas and oil markets in turmoil there is a call for alternatives such as coal, a blockade in the transport of such alternatives together with the usual bulk and container transport deepens the emerging economic crisis. Next to imports, exports are also affected if the goods travel via the Rhine.
In the short term a modal shift to road is not feasible, but it becomes urgent to invest in railways and in particular in rail bypass routes to secure resilience of freight transport in Europe [30]. Rail and barge transport, while organized very differently, may have a lot to gain from cooperation. Governments should stimulate such a development in order to make freight transport more resilient.
With this elaboration, sub-question 5 is addressed.
It becomes apparent how climate change affects freight transport. A key transport corridor like the Rhine River may be blocked locally due very low water levels. The choice for an alternative led to a study of the options of railways using the same or other transport corridors or routes. It may be quite difficult to shift a major part of inland barge transport to rail due to its inherent technical and organizational limitations. Yet, without such an alternative, (international) freight transport in the countries studied may be frozen, with deer logistic and economic consequences in front of a looming recession. Investing in freight rail corridors and not using the same corridors as the already busy main corridors used by passenger trains may lead to the redevelopment of bypass routes. The same investments may also be worthwhile in case of the opposite situation, where very high water levels may also reduce the load capacity or even further incapacitate inland barge transport. Cooperation of rail and barge transport could be another option to make European freight transport more resilient to climate change.
[1] Flooding and climate change. National Park Service. https://www.nps.gov/articles/000/flooding-climateimpact.htm, accessed on Feb. 2, 2022.
[2] Vleugel, J.M., Bal, F. (1970). Climate change and resilient rail freight transport. WIT Transactions on Ecology and the Environment, 258: 79-88. https://doi.org/ 10.2495/SDP220071
[3] Stalled weather patterns will get bigger due to climate change. National Science Foundation. https://www.nsf.gov/discoveries/disc_summ.jsp?cntn_id=299624&org=NSF, accessed on Feb. 2, 2022.
[4] Belgium-Germany: Estimated costs for flood damage repairs reach billions. RailFreight.com. http://www.railfreight.com/railfreight/2021/07/20/belgium-germany-estimated-costs-for-flood-damage-repairs-reach-billions, accessed on Jul. 20, 2022.
[5] Kramer, K. (2021). Counting the cost 2021: A year of climate breakdown. Christian Aid, London, UK.
[6] Aquanomics. The economics of water risk and future resiliency, GHD Group. https://aquanomics.ghd.com/#findings, accessed on Sep. 24, 2022.
[7] Bruyninckx, H., Summer 2022: Living in a state of multiple crises. https://www.eea.europa.eu/articles/summer-2022-living-in-a, accessed on Sep. 24, 2022.
[8] Droogte en wateroverlast zijn onlosmakelijk met elkaar verbonden. NOS Nieuws. http://nos.nl/artikel/2441116-droogte-en-wateroverlast-zijn, accessed on Sep. 24, 2022.
[9] Trump, D.J. (2017). National security strategy of the United States of America. Executive Office of The President Washington DC Washington United States.
[10] Center for Climate and Energy Solutions (C2ES). What is climate resilience and why does it matter? http://www.c2es.org/document/what-is-climate-resilience-and-why-does-it-matter, accessed on Jun. 13, 2023.
[11] Shift2Rail. European Commission. https://trimis.ec.europa.eu/programme/shift2rail, accessed on Feb. 2, 2022.
[12] European Court of Auditors. Rail freight transport in the EU: Still not on the right track. http://www.eca.europa.eu/Lists/ECADocuments/SR16_08/SR_RAIL_FREIGHT_EN.pdf, accessed on Jun. 13, 2023.
[13] Ludvigsen, J., Klæboe, R. (2014). Extreme weather impacts on freight railways in Europe. Natural Hazards, 70: 767-787. https://doi.org/10.1007/s11069-013-0851-3
[14] Aroa, S., Böhm, W., Dolan, K., Gould, R., McConnell, S. (2020). Resilience in transport and logistics. McKinsey & Company.
[15] The Rhine-Alpine Corridor. https://www.railweb.ch/wp-content/uploads/2016/09/ Rhine-Alpine-Corridor_presentation-J%C3%B6rg-Saalbach.png, accessed on Oct. 6, 2022.
[16] Rail Net Europe. Rail Freight Corridors. https://rne.eu/rail-freight-corridors/rail-freight-corridors-general-information, accessed on Oct. 6, 2022.
[17] “Act now!” on low water and effects on Rhine navigation (Edition 2.0 of 23 February 2021). CCNR. http://www.ccnr.eu/13020156-en.html, accessed on Jun. 22, 2023.
[18] Giusti, R., Manerba, D., Bruno, G., Tadei, R. (2019). Synchromodal logistics: An overview of critical success factors, enabling technologies, and open research issues. Transportation Research Part E: Logistics and Transportation Review, 129: 92-110. https://doi.org/10.1016/j.tre.2019.07.009
[19] Bal, F., Vleugel, J. (2021). Inland rail freight services with less fuel and lower emissions. International Journal of Energy Production and Management, 6(2): 170-180. https://doi.org/ 10.2495/EQ-V6-N2-170-180
[20] Emissiecijfers CO2. Binnenvaartcijfers. https://binnenvaartcijfers.nl/emissiecijfers-co2/, accessed on Oct. 9, 2022.
[21] Overige motorvracht- schepen. Wereld van de binnenvaart. https://wereldvandebinnenvaart.nl/schepen/15/ overige-motorvracht-schepen, accessed on Oct. 9, 2022.
[22] Lijst emissiefactoren. CO2-emissiefactoren. http://www.co2emissiefactoren.nl/lijst-emissiefactoren/, accessed on Oct. 9, 2022.
[23] Schoonen, N.A., Lung, W.K. (2011). Containerbinnenvaart 2010. Stichting Projecten Binnenvaart August 22nd, Expertise- en InnovatieCentrum Binnenvaart, Rotterdam, http://adoc.pub/containerbinnenvaart-rijkswaterstaat-dienst-verkeer-en-schee.html.
[24] Rapportage Containerhoogtemetingen (bijlage bij 31409,nr.63). Parlementaire Monitor. https://www.parlementairemonitor.nl/9353000/1/j9tvgajcovz8izf_j9vvij5epmj1ey0/vjkwfnzv10yk, accessed on Jun. 13, 2023.
[25] Soorten lading. Bureau Voorlichting Binnenvaart. https://www.bureauvoorlichting binnenvaart.nl/de-binnenvaart/basiskennis/soorten-lading/, accessed on Oct. 14, 2022.
[26] Huizen, E.V. Binnenvaart vervoert recordhoeveelheid. http://aqualink.biz/binnenvaart-vervoer-recordhoeveelheid-tonnen, accessed on Oct. 14, 2022.
[27] Stalpers, J. Waterpeil Rijn blijft nog weken lag. https://www.scheepvaartkrant.nl/nieuws/%20waterpeil-rijn-blijft-nog-weken-laag, accessed on Oct. 6, 2022.
[28] Ligterink, N.E., Smit, T., Spreen, J.S. (2017). Insight into the energy consumption, CO2 emissions and NOx emissions of rail freight transport.
[29] Sustainable energy. SBB. http://company.sbb.ch/en/sbb-as-business-partner/services-rus/energy/sustainable-energy.html, accessed on Oct. 14, 2022.
[30] Crisis op crisis: de Rijn dreigt droog te vallen (en dat gaan we merken). RTL Nieuws. http://www.rtlnieuws.nl/economie/artikel/5326522/de-rijn-bijna-onbevaarbaar-wat-zijn-de-consequenties, accessed on Oct. 10, 2022.