Dian P.E. Laksmiyanti* | Dewi Larasati | Aswin Indraprastha
© 2026 The authors. This article is published by IIETA and is licensed under the CC BY 4.0 license (http://creativecommons.org/licenses/by/4.0/).
OPEN ACCESS
Net Zero Energy Building (NZEB) acceptance studies generally assess readiness to adopt or willingness to pay (WTP) separately, thus failing to explain whether residents who receive an intervention are also prepared to bear the costs of implementation, particularly in the context of rental apartments with limited control over building investment. This study fills this gap by comparing willingness to adopt (WTA) and WTP in the same NZEB scenario and operationalizing the adoption-payment gap as the difference between WTA and WTP. A survey of 172 low-cost apartment residents was analyzed using descriptive statistics, reliability testing, principal component analysis (PCA) as a data reduction technique, and multivariate regression, with multiple testing controlled using the Benjamini–Hochberg FDR separately for WTA and WTP. The results indicate that after controlling for inter-predictor influences and multiple testing, knowledge was the only perceptual domain consistently associated with NZEB acceptance, while Perception and Awareness did not show a robust relationship. General Energy and Environmental Knowledge were positively associated with all WTA outcomes (B = 0.525–0.938), while WTP showed a more segmented pattern between general knowledge (B = 0.346–0.567) and NZEB and Energy Policy Knowledge (B = 0.486–0.615). The model's apparent power varied with R² = 0.118–0.546. The WTA–WTP mapping further demonstrated that adoption readiness did not always align with stated payment WTP for the proposed implementation costs. The novelty of this study lies in the mechanism that directly links perceptual profiles with these two forms of readiness for the same intervention, thus clarifying the role of knowledge and the adoption-payment gap in determining the direction of NZEB implementation in low-cost apartments.
Net Zero Energy Building, rental housing, technology acceptance, willingness to adopt, willingness to pay
The construction sector is a major contributor to rising global energy consumption and carbon emissions. Reports indicate that the construction sector accounts for approximately 30–32% of global energy demand and contributes significantly to CO₂ emission [1]. The residential sector is the dominant component of building energy consumption. In Indonesia's urban context, this pressure arises from the rapid growth of vertical housing, limited land, increasing demands for thermal comfort, and household dependence on electricity for daily domestic activities [1-5]. Therefore, the concept of net-zero energy building or Net Zero Energy Building (NZEB) is an important transition strategy to reduce the energy load of buildings through energy efficiency, energy conservation and integration of renewable energy [6]. Often architects also optimize passive and active designs in buildings to increase occupant comfort while still considering energy efficiency and conservation [7, 8]. The application of the NZEB scenario to affordable urban rental housing, such as simple rental flats or Rusunawa, cannot be treated the same as the application to privately owned housing or commercial buildings [9, 10]. Rusunawa is inhabited by low to lower-middle income groups, so that economic limitations, specific energy consumption patterns, limited control of residents over the building, and the institutional capacity of the management are important factors that can influence the success of implementation [11, 12]. Thus, the urgency of the NZEB transition in Rusunawa lies not only in the technology's ability to reduce energy consumption, but also in the extent to which the strategy can be accepted, understood, and considered appropriate by residents as the main users of the building [13-15]. In this context, user acceptance becomes a crucial aspect because the success of the energy transition in rental housing is not only determined by the technical performance of the system, but also by the willingness of residents to adopt, adjust their behavior, and support the energy intervention scenarios offered [16, 17].
Although studies on NZEB in the residential sector continue to grow, most studies still focus on technical aspects, such as energy efficiency, renewable energy integration, and technological feasibility [1, 18]. Meanwhile, the user acceptance dimension is often still treated as a general concept, without clearly distinguishing between willingness to adopt (WTA) and willingness to pay (WTP) [19-21]. However, these two dimensions represent different responses: residents may accept the idea of NZEB, but they may not be willing or able to bear the additional costs involved. Furthermore, there are limited studies examining how perception, awareness, and knowledge influence these two forms of acceptance differently, particularly in affordable rental housing in developing countries. In the context of Rusunawa, this issue is crucial because residents have limited control over the building's technical decisions and limited economic capacity to respond to energy interventions [12, 22].
The literature on NZEB acceptance still leaves three main gaps. Conceptually, many studies address acceptability, attitudes, or adoption intentions without clearly distinguishing between readiness to accept an intervention and readiness to bear the costs of implementing it. On a scenario basis, these two forms of readiness are also rarely compared for the same NZEB intervention, so it is not yet clear whether a technology that is easily accepted also has parallel payment readiness. This gap becomes more important in the context of rental flats, because residents are direct users of the building but do not always have authority over physical changes or investment decisions. Based on these conditions, the novelty of this research lies in the direct comparison between WTA and WTP in the same NZEB scenario, as well as testing how the residents' perceptual profile is related to these two forms of readiness. This approach allows research to identify adoption-payment gaps and see whether factors related to adoption readiness also remain relevant when decisions involve payment commitments. Thus, this research provides a more specific basis for understanding the acceptability of NZEB in low-cost rental flats and for devising intervention directions that are more appropriate to the characteristics of residents and their scenarios.
2.1 Net Zero Energy Building implementation in low-cost rental housing
NZEB is emerging as a key approach to reducing energy consumption and carbon emissions in the building sector. In general, NZEB emphasizes a balance between building energy needs and energy reduction or fulfillment efforts through a combination of passive design strategies, active systems, energy efficiency, energy conservation, and the use of renewable energy [23-25]. In the field of residential architecture, the NZEB paradigm is gaining significant significance, as energy utilization in households is influenced not only by the physical attributes of the building, but also by the behavior, preferences, and financial capabilities of its occupants [26, 27]. Furthermore, in Indonesia, the household sector is the sector that consumes the most energy [1, 28].
However, implementing NZEB in the context of low-cost rental housing presents a different set of complexities compared to privately owned residences or commercial apartment complexes. In basic rental units, or Rusunawa, residents serve as regular energy consumers, but they often lack comprehensive authority over building-related investment decisions. Instead, residents are the ones who directly experience the consequences of NZEB implementation, manifested in increased comfort, changes in energy consumption behavior, reduced electricity costs, and potentially additional costs. This scenario underscores that NZEB support within Rusunawa is closely tied to the interplay between technology, benefits, costs, and the residents' status as tenants [9, 16, 29, 30].
Existing literature on energy efficiency in rental housing highlights common challenges related to benefit distribution and cost allocation. Energy-related interventions often require investment decisions from property owners or managers, while operational benefits are primarily experienced by tenants through reduced energy consumption or improved comfort levels. This mismatch between the entities financing the investment and those reaping the benefits complicates the deployment of energy-efficient technologies in the rental housing sector. In the specific context of low-cost apartments (Rusunawa), this issue is particularly significant, given that residents typically have limited financial capacity, making the adoption of NZEB interpreted not only as an endorsement of technological progress but also as a critical concern for affordability and economic viability [31-33].
The development of low-cost vertical houses (Rusunawa) in Indonesia is not only understood as an agenda for providing housing, because the expansion of vertical housing has direct implications for increasing energy consumption, increasing cooling loads, and increasing building carbon emissions. Various studies on low-carbon apartments in the hot-humid climate of Indonesia have shown that the main problems with vertical housing not only stem from limited space and function, but also from the low response of the design to local climate conditions, especially natural ventilation, building orientation, shading, insulation and heat control in the building envelope. Previous research shows that passive strategies such as vertical voids, wind fins, windcatchers, insulation, shading devices, and opening arrangements can improve air flow, reduce cooling loads, and increase the thermal performance of residential units. Follow-up studies also show that apartment prototypes with passive strategies show better performance than standard apartments, for example through reducing OTTV, EUI, cooling energy and indoor temperature. Thus, the available literature is strong enough to confirm that passive design strategies and energy efficiency have the potential to become a technical basis for sustainable vertical residential development in Indonesia [34-36].
Previous research also confirms that the successful transition from low-carbon housing to a NZEB scenario is not solely determined by the building's technical performance. Public acceptance of eco-friendly housing is shaped by issues of energy and cost efficiency, environmental concerns, health, and comfort; even when technological innovations are implemented, social innovation is still needed to ensure their benefits are understood and accepted by users [36, 37]. Thus, low-cost rental housing in Indonesia is a strategic context for testing the acceptability of NZEB. This context demonstrates that the success of NZEB implementation is determined not only by technical feasibility or potential energy savings, but also by the readiness of residents to accept, use, and participate in the proposed energy scenario. Therefore, a study of NZEB acceptability in Rusunawa (low-cost rental housing) needs to consider the socio-economic characteristics of residents, their position as tenants, and the difference between acceptance of the technology and readiness to bear the costs of its implementation.
2.2 Multidimensional acceptance of Net Zero Energy Building: From adoption to payment readiness
Energy technology acceptance studies generally define acceptance as the user's attitude, intention, or readiness to accept an innovation. In many cases, acceptance is understood as a positive inclination toward a particular technology or program. This approach is useful for explaining initial user support, but risks simplifying the decision-making process in NZEB implementation. In the context of low-cost rental housing, acceptance of the NZEB idea is not necessarily synonymous with readiness to use the technology, and furthermore, does not necessarily indicate a WTP for its implementation costs. In low-cost rental housing, in addition to socioeconomic aspects, ownership and a sense of belonging also influence the acceptance of the NZEB concept [9, 11, 16].
In this study, NZEB acceptance is understood as a multidimensional construct divided into two main dimensions: WTA technology and WTP. WTA refers to residents' readiness to accept, use, or support the implementation of NZEB scenarios. This dimension relates to residents' perceptions of the practical benefits, ease of implementation, convenience, and suitability of the NZEB scenario to their daily needs. Conversely, WTP refers to residents' readiness to bear the cost consequences of NZEB implementation. In this study, the WTP was measured by respondents' WTP for the procurement and installation of NZEB technology in their low-cost apartment units. This dimension is more related to economic considerations, belief in long-term benefits, perceptions of electricity cost savings, and trust in government policy or program support [13, 21, 38]. The distinction between these two dimensions is important because residents may demonstrate a positive attitude toward NZEB implementation without having the financial readiness to pay for it. Conversely, WTP may arise not solely because the technology is perceived as attractive, but because residents understand the economic, environmental, or policy benefits of the intervention. Thus, NZEB acceptance should not be assumed to be a linear process from knowledge to positive attitude and then payment. In the context of Rusunawa, adoption decisions and payment decisions may be shaped by different logics.
Gap in the literature on NZEB acceptance lies in the tendency to treat acceptance as a single, general construct. Many studies address the acceptance of energy-efficient building technologies, interest in renewable energy, or WTP separately, but few compare WTA and WTP side by side within a single scenario-based analysis framework. This distinction is crucial to avoid misleading policy conclusions. Strategies that successfully increase support for technology adoption may not necessarily increase residents' WTP. This is where the adoption-payment gap concept becomes relevant as a framework for understanding the difference between practical acceptance and economic readiness in NZEB implementation.
2.3 Scenario-based Net Zero Energy Building strategies and acceptance predictors
NZEB is not a single form of intervention, but rather consists of a variety of strategies that have different technical, behavioral and economic characteristics [16, 39]. In this study, NZEB scenarios are grouped into five categories: active design, passive design, energy efficiency, energy conservation, and energy substitution. Active design refers to strategies involving mechanical-electrical systems or devices to improve a building's energy performance. Passive design relates to building design qualities, such as natural ventilation, daylighting, orientation, and heat load reduction. Energy efficiency relates to the use of devices or systems that consume less energy. Energy conservation emphasizes reducing consumption through changing energy usage patterns. Meanwhile, energy substitution relates to shifting energy sources toward renewable energy or lower-emission sources. These differences in characteristics mean that occupant acceptance of each scenario group cannot be assumed to be uniform. Strategies that are close to occupants' daily experiences, such as reducing standby electricity consumption or using energy-efficient devices, may be easier to understand because the benefits are immediately apparent. Conversely, more technical strategies or those requiring greater investment, such as energy substitution or certain active systems, may require a higher level of knowledge and belief in the benefits. Therefore, analysis of NZEB acceptance needs to be conducted specifically by scenario group, rather than simply based on general acceptance of the NZEB concept.
As in several previous studies, this study places perception, awareness, and knowledge as predictive factors for NZEB acceptance [40-42]. Perception relates to occupants' assessment of the benefits, costs, comfort, and relevance of an intervention. Awareness relates to occupants' sensitivity to energy use issues, including electricity consumption, natural ventilation, energy savings, or the impact of daily behavior on electricity consumption. Knowledge relates to occupants' understanding of energy sources, the NZEB concept, renewable energy, and government energy programs. These three factors are important because NZEB acceptance depends not only on the availability of technology but also on how occupants understand, assess, and relate the technology to their needs and limitations.
However, the influence of perception, awareness, and knowledge on WTA and WTP is not necessarily the same. Factors that increase readiness to adopt can be practical and related to everyday energy use experiences [15, 43, 44]. Conversely, readiness to pay can be more influenced by broader knowledge about systemic benefits, energy sources, the NZEB concept, or government programs. Therefore, a more disaggregated understanding of acceptance predictors is needed, both based on acceptance dimensions and based on the characteristics of NZEB scenarios.
2.4 Adoption-payment gap and conceptual framework
This study begins with the argument that NZEB acceptance in low-cost rental housing is multidimensional and scenario-specific. Acceptance is not adequately understood as a positive attitude toward energy technology or programs, as residents may accept the idea of NZEB implementation but lack the readiness to pay. This difference is referred to as the adoption-payment gap, which is the gap between readiness to adopt NZEB strategies and readiness to bear the costs of implementation. The gap that will be discussed in this study is the difference between WTA–WTP in the same individual scenario, not the gap in the scenario group.
The research gaps addressed in this article lie in three areas. First, NZEB acceptance studies still tend to treat acceptance as a single construct, thus not adequately explaining the logical differences between adoption and payment decisions. Second, studies directly comparing WTA and WTP across several NZEB scenario groups are still limited. Third, the context of low-cost rental housing has received insufficient attention, even though this context presents distinct decision-making characteristics because residents are renters, have limited economic capacity, and do not always have control over building investments.
Based on these gaps, the novelty of this study lies in the empirical separation of the adoption and payment dimensions in NZEB acceptance. This study not only identifies factors influencing acceptance but also compares whether perception, awareness, and knowledge operate similarly or differently on WTA and WTP. Furthermore, this study examines these differences across scenarios, demonstrating that NZEB implementation strategies need to be differentiated based on the type of intervention, acceptance characteristics, and economic readiness of residents.
Conceptually, this study positions perception, awareness, and knowledge as predictors influencing two dimensions of NZEB acceptance: WTA and WTP. These relationships are tested across five NZEB scenario groups: active design, passive design, energy efficiency, energy conservation, and energy substitution. A comparison of the results on the adoption and payment dimensions is used to identify the adoption-payment gap. This framework serves as a basis for formulating more appropriate intervention directions and policy priorities for NZEB implementation in low-cost urban rental housing and other low-cost apartments in Indonesia as a developing country.
3.1 Research design
In general, this research aims to determine the significant factors in respondents' perceptions that influence their WTA and WTP for the NZEB scenario using regression analysis. The regression weights will be used as the basis for government intervention recommendations to increase the NZEB scenario acceptance level among low-cost vertical house residents. Figure 1 is a schematic of this research methodology.
The type of research used is quantitative research where the focus of this article is on the acceptance model. This paper is part of a broader design framework (the formulation of the NZEB scenario model in low-cost apartments in Surabaya), but this article only discusses the relationship of independent variables (X1 = respondent's perception, X2 = Respondent's awareness, X3 = respondent's knowledge) to the dependent variables (Y1-Y5 = WTA NZEB scenario and Y6-Y10 = WTP NZEB scenario). Each X and Y variable has different indicators.
Figure 1. Research framework
3.2 Object of study and research location
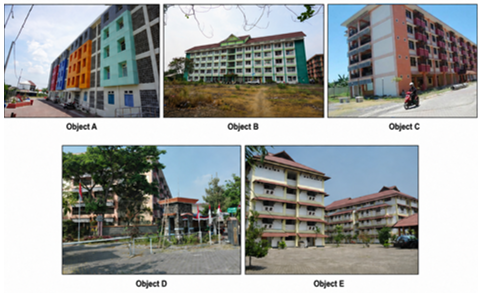
This research was conducted in five rental apartments in Surabaya City, East Java, Indonesia, namely Rusunawa Pakal, Rusunawa Ngelom, Rusunawa Wonocolo, Rusunawa Pucang, and Rusunawa Aparna, hereinafter referred to as Objects A, B, C, D, and E (Figure 2). The five objects were selected because they represent the typology of vertical rental housing for the lower-middle class in urban areas. Rental apartments are relevant objects to study the acceptance of residents towards the NZEB scenario because they have limited space, limited economic capacity of residents, and household energy consumption patterns that are sensitive to monthly operational costs.
Figure 2. Objects study
The selection of study objects was based on two main criteria. First, the objects were government- or privately-managed rental apartments intended for lower-middle-class residents. Second, the objects had unit rental prices above Rp100,000 per month, as an operational limit to ensure that the objects remained within the modest apartment segment, but had a rental payment structure relevant for analysis in relation to the acceptability and WTP for the NZEB intervention scenario. Thus, the objects were selected based on their suitability to the research objectives, not solely on location availability.
In general, the research objects are five-story vertical housing units consisting of one to five blocks, with approximately 70 to 90 residential units per block, all of which are occupied. Residential units generally use a default electricity capacity of 1,300 VA and are not equipped with a mechanical air conditioning system. Occupant thermal comfort relies more on natural ventilation and fans. This condition is important because the NZEB strategy in rental apartments cannot be equated with that of upper-middle-class housing, which has high energy consumption due to the use of air conditioning. Therefore, intervention scenarios need to consider the actual energy characteristics of residents, limitations in electrical power, and economic ability to accept additional technology or costs.
This article is limited to analyzing occupant acceptance of NZEB scenarios based on willingness. Therefore, this study does not directly evaluate the actual energy performance of buildings or the technical performance of each NZEB scenario, as these analyses are part of a separate research series. By placing occupants as the primary unit of analysis, this study focuses on the relationship between occupant perception, awareness, and knowledge with their WTA and pay for various NZEB scenarios in the context of urban rental apartments.
3.3 Respondents and data collection method
Data collection was conducted through a questionnaire survey of residents of five rental apartments in Surabaya from February to March 2026. A total of 184 respondents participated in the initial survey, but 12 data were eliminated because they were identified as outliers through JMP software. Thus, the number of valid data analyzed was 172 respondents. The distribution of respondents consisted of 34 respondents from Rusunawa Pakal, 44 respondents from Rusunawa Ngelom, 38 respondents from Rusunawa Wonocolo, 31 respondents from Rusunawa Pucang, and 25 respondents from Rusunawa Aparna. The respondents of this study were mostly women of productive age, the education level of most respondents was high school / equivalent. The income level was mostly in the range of 2.5-8 million rupiah / month with a family size of 3-4 people in one unit (Table 1).
Perception of the importance of energy efficiency, particularly in household energy use and reducing electricity costs (Table 1). This indicates that energy efficiency is an issue closely related to the daily experiences of apartment residents because it is directly related to monthly expenses. The most striking variations were seen in education and income, where respondents with higher education and income levels tended to have better energy awareness and knowledge. These findings indicate that literacy, access to information, and economic capacity can influence residents' readiness to understand energy interventions in rental housing.
Table 1 also shows that specific knowledge regarding NZEB and energy policy remains relatively low across almost all groups. This condition highlights the gap between general awareness of energy efficiency and technical understanding of NZEB. Therefore, acceptance of the NZEB scenario is likely driven more by practical benefits, such as reduced electricity costs, thermal comfort, and ease of use of the technology, than by conceptual understanding of NZEB. Variations by age and number of household members indicate that productive age groups and households with more members tend to be more sensitive to energy efficiency issues, although this pattern is still indicative and cannot yet be interpreted as a causal relationship. Therefore, these descriptive results are used as an initial basis for understanding the respondent profile, while the relationship between perception, awareness, knowledge, and acceptance of the NZEB scenario needs to be tested through further statistical analysis.
The unit of analysis for this study was the household, with respondents consisting of adult residents representing their households. Respondents were selected based on the following criteria: active residents of the low-cost apartment (Rusunawa), aged 17 years and over, knowing the total family income, understanding household electricity usage, and being involved in electricity or rent payment decisions. These criteria were necessary to ensure respondents had the capacity to assess the NZEB scenario, particularly regarding their WTA and pay for energy interventions at the household level.
Sampling was conducted using a cluster-based approach. In low-cost apartments with more than one block, study blocks were selected based on similar building types and massing orientations. Respondents were then drawn from at least 30% of the occupants on each floor. Clusters based on block, orientation, and floor were retained because respondents also served as the basis for developing NZEB scenarios related to the physical condition of the building and the energy profile of the dwelling.
In general, most respondents expressed a positive perception. The survey was conducted door-to-door with the assistance of a surveyor to ensure a consistent understanding of each NZEB scenario. The instrument used a four-point Likert scale and included explanations for each scenario, including examples of technology images, benefits, unit prices, and estimated electricity savings. the displayed price/cost becomes the object of the WTP assessment. Prior to completion, respondents were explained the purpose of the study. Participation was voluntary, and data was collected anonymously.
Table 1. Respondents
|
Attributes |
Respondents |
Perception of Electricity Bill |
Perception of Energy Use |
Perception Importance of Energy Efficiency |
Perception of the Need to Reduce Electricity Expenses |
|
|
n |
% |
mean |
mean |
mean |
mean |
|
|
Gender |
||||||
|
Male |
44 |
25.58 |
2.8 |
2.0 |
3.6 |
3.5 |
|
Female |
128 |
74.42 |
2.9 |
2.0 |
3.4 |
3.5 |
|
Age |
||||||
|
<20 Years old |
5 |
2.91 |
3.0 |
2.2 |
3.2 |
3.6 |
|
21 - 30 Years Old |
18 |
10.47 |
2.9 |
2.1 |
3.4 |
3.6 |
|
31 - 40 Years Old |
56 |
32.56 |
2.9 |
1.9 |
3.5 |
3.6 |
|
41 - 50 Years Old |
51 |
29.65 |
2.9 |
1.9 |
3.5 |
3.5 |
|
51 - 60 Years Old |
20 |
11.63 |
2.8 |
2.1 |
3.4 |
3.5 |
|
>60 Years Old |
22 |
12.79 |
2.5 |
1.9 |
3.3 |
3.2 |
|
Education background |
||||||
|
No formal education |
6 |
3.49 |
3.5 |
1.8 |
3.3 |
3.8 |
|
Elementary school |
22 |
12.79 |
2.5 |
2.0 |
3.2 |
3.2 |
|
Junior high |
20 |
11.63 |
2.8 |
2.2 |
3.3 |
3.5 |
|
Senior high |
85 |
49.42 |
2.9 |
1.9 |
3.4 |
3.5 |
|
Bachelor degree |
36 |
20.93 |
2.7 |
1.9 |
3.7 |
3.6 |
|
Post graduate |
3 |
1.74 |
3.3 |
2.3 |
3.7 |
3.7 |
|
Monthly income |
||||||
|
0 - 1 million IDR |
19 |
11.05 |
2.7 |
1.8 |
3.2 |
3.3 |
|
1 - 2.5 million IDR |
39 |
22.67 |
3.0 |
2.1 |
3.3 |
3.5 |
|
2.5 - 4.5 million IDR |
47 |
27.33 |
2.9 |
1.9 |
3.4 |
3.5 |
|
4.5 - 8 million IDR |
48 |
27.91 |
2.7 |
2.0 |
3.5 |
3.5 |
|
>8 million IDR |
19 |
11.05 |
2.8 |
2.1 |
3.8 |
3.6 |
|
Household type |
||||||
|
Single |
12 |
6.98 |
2.1 |
2.0 |
3.0 |
2.8 |
|
Couple |
42 |
24.42 |
2.7 |
1.9 |
3.4 |
3.5 |
|
Small family (3-4 persons) |
106 |
61.63 |
3.0 |
2.0 |
3.5 |
3.5 |
|
Medium family (5-7 people) |
12 |
6.98 |
3.3 |
2.1 |
3.8 |
3.9 |
|
Attributes |
Awareness of Energy Conservation |
Awareness of Climate Change |
Awareness of Sustainable Living Environment |
General Energy and Environmental Knowledge |
NZEB and Energy Policy Knowledge |
|
|
mean |
mean |
mean |
mean |
mean |
||
|
Gender |
||||||
|
Male |
3.5 |
3.1 |
3.1 |
3.1 |
1.6 |
|
|
Female |
3.2 |
2.7 |
2.9 |
2.6 |
1.3 |
|
|
Age |
||||||
|
<20 Years old |
2.6 |
3.0 |
2.2 |
3.1 |
1.3 |
|
|
21 - 30 Years Old |
3.0 |
2.7 |
2.8 |
2.9 |
1.5 |
|
|
31 - 40 Years Old |
3.4 |
3.1 |
3.2 |
3.1 |
1.5 |
|
|
41 - 50 Years Old |
3.4 |
2.7 |
3.0 |
2.8 |
1.4 |
|
|
51 - 60 Years Old |
3.4 |
2.7 |
2.9 |
2.2 |
1.1 |
|
|
>60 Years Old |
3.1 |
2.3 |
2.9 |
1.8 |
1.1 |
|
|
Education background |
||||||
|
No formal education |
2.7 |
1.7 |
3.0 |
1.2 |
1.0 |
|
|
Elementary school |
3.1 |
1.7 |
2.6 |
1.4 |
1.0 |
|
|
Junior high |
3.0 |
2.2 |
2.6 |
2.1 |
1.0 |
|
|
Senior high |
3.3 |
2.9 |
3.1 |
2.9 |
1.2 |
|
|
Bachelor degree |
3.7 |
3.6 |
3.3 |
3.6 |
2.2 |
|
|
Post graduate |
3.7 |
3.7 |
2.6 |
3.7 |
2.7 |
|
|
Monthly income |
||||||
|
0 - 1 million IDR |
2.9 |
1.9 |
2.6 |
1.7 |
1.1 |
|
|
1 - 2.5 million IDR |
3.1 |
2.3 |
2.7 |
2.1 |
1.1 |
|
|
2.5 - 4.5 million IDR |
3.3 |
2.7 |
3.1 |
2.8 |
1.2 |
|
|
4.5 - 8 million IDR |
3.4 |
3.3 |
3.2 |
3.3 |
1.7 |
|
|
>8 million IDR |
3.6 |
3.4 |
3.1 |
3.6 |
2.1 |
|
|
Household type |
||||||
|
Single |
3.1 |
1.8 |
2.7 |
1.5 |
1.0 |
|
|
Couple |
3.4 |
3.0 |
3.1 |
2.7 |
1.5 |
|
|
Small family (3-4 persons) |
3.3 |
2.9 |
3.0 |
2.9 |
1.4 |
|
|
Medium family (5-7 people) |
2.9 |
2.2 |
2.9 |
2.3 |
1.1 |
|
3.4 Research variables and instruments
The research instrument was designed to measure the relationship between occupants' perceptual characteristics and their level of acceptance of the NZEB scenario in rental apartments. The independent variables consisted of occupants' perceptions, awareness, and knowledge. Perception was measured through four indicators: electricity bills, energy use, the importance of energy efficiency, and the need to reduce electricity costs. Awareness was measured through eight indicators: energy efficiency, natural ventilation, energy conservation, standby electricity consumption, global warming, climate change, a healthy environment, and waste management. Knowledge was measured through six indicators: energy sources, renewable energy, NZEB, government energy programs, global warming, and climate change. All independent indicators used a four-point Likert scale.
The dependent variable is the level of occupant acceptance of the NZEB scenario, which is divided into WTA and WTP. WTA measures occupants' willingness to implement NZEB technology or strategies, while WTP measures their WTP for implementation costs. Separating these two measures is important because attitudinal acceptance does not always align with occupant economic readiness. In this study, the WTP was measured by respondents' WTP for the procurement and installation of NZEB technology in their low-cost apartment units. Respondents were given an estimated investment cost for each technology and an estimate of the electricity savings they could achieve if they adopted the technology. The WTP responses consisted of the following options: no investment at all, willing to invest up to 25% of the original investment cost, willing to invest up to 75% of the original investment cost, or willing to invest 100% of the stated cost.
The NZEB scenarios in the questionnaire are grouped into five intervention categories. Active design includes exhaust fans and ceiling fans; passive design includes roof insulation, thermal foil, reflective paint, external shading, glazing improvements, and wall insulation; efficiency includes BLDC fans, fan timers, inverter fridges, LED lights, and smart light bulbs; conservation includes smart plugs, switched power strips, switches with timers, and lux sensors; and substitution includes rooftop PV and wall PV. Each scenario is accompanied by a technology description, illustrations, benefits, estimated unit prices, and estimated electricity savings.
Perception, awareness, and knowledge indicators were compiled based on literature on household energy behavior, environmental awareness, and energy technology acceptance. The NZEB scenario was developed from a literature review, observations of the physical condition of apartments, and identification of residential energy profiles. To simplify the data and reduce indicator overlap, variables with four or more indicators were analyzed using principal component analysis (PCA): perception, awareness, knowledge, passive design, efficiency, and conservation. Variables that do not meet Cronbach's α value will still be measured by the original individual indicators.
3.5 Data analysis
All data analysis was carried out using JMP software. The initial stage includes checking data quality through identifying outliers using the Explore Outliers feature. Observations that met the exclusion criteria as outliers were excluded before further analysis. Next, the internal consistency of the indicator group was checked using Cronbach's α, with a value of 0.70 used as an initial threshold to assess the appropriateness of the indicators being treated as a fairly consistent group for the data reduction process.
PCA in this research is used as a data reduction technique, not as a test of measurement models or confirmatory formation of latent constructs. Therefore, PCA results are only retained if the indicator group shows adequate internal consistency and factor structure. PCA was carried out based on the correlation matrix with Varimax rotation. The number of factors is determined by considering a combination of eigenvalues greater than 1 and a scree plot pattern based on the elbow rule, while factor interpretation is based on the pattern of rotated factor loadings, including clarity of dominant loadings and the presence of weak loadings or cross-loadings.
In the Perception dimension, reduction via PCA was not maintained because the indicators did not show sufficient internal consistency and factor structure to be formed into a stable composite score. Therefore, the four Perception indicators are maintained as observed variables which are analyzed individually at the regression stage. Conversely, Awareness and Knowledge indicators that meet the analytical criteria are reduced through PCA, and the rotational factor scores are saved to be used as predictor variables in subsequent analysis.
The same reduction approach is applied to the WTA and WTP variables for the scenario group that has an adequate number of indicators, namely passive design, energy efficiency and energy conservation. The PCA factor scores are used as a representation of each scenario dimension in the regression analysis. Meanwhile, the active design and energy substitution groups, which each consist of only two indicators, were not analyzed using PCA; The composite score is calculated using the average value of the constituent indicators. Thus, the next analysis model uses four Perception indicators as individual observed variables, PCA factor scores for the Awareness and Knowledge dimensions, as well as factor scores or average WTA and WTP scores according to the structure of each scenario group.
The relationship between the occupant's perceptual profile and the level of acceptance of the NZEB scenario was analyzed using multivariate regression on the JMP. In each model, four Perception indicators are included as observed predictors, while the Awareness and Knowledge dimensions are represented by PCA factor scores. The dependent variable consists of WTA and WTP for each NZEB scenario group. In scenario groups that produce more than one factor through PCA, each factor score is treated as a separate dependent variable, while scenario groups with a limited number of indicators are represented using the average score. All predictors were entered simultaneously in each model to evaluate the relationship of each variable with WTA and WTP after considering the contribution of other predictors. The main outputs used in interpretation include coefficient estimates, standard errors, p values, R², adjusted R², and model significance.
Because the analysis involves testing a number of coefficients on several WTA and WTP outcomes, the risk of false-positives due to multiple testing is controlled using the Benjamini–Hochberg False Discovery Rate (BH-FDR) procedure. Corrections were carried out separately for two groups of tests, namely all tests on the WTA outcome and all tests on the WTP outcome. Thus, the interpretation of significant relationships at the final stage is based on the FDR-adjusted p-value, with a significance level of 0.05.
The final stage of analysis was carried out by synthesizing the regression results which remained significant after FDR correction, WTA and WTP patterns between scenarios, as well as the gap between adoption readiness and payment readiness (adoption-payment gap). This synthesis is used to identify differences in factors related to adoption readiness and payment readiness as well as to formulate intervention implications that are appropriate to the characteristics of each NZEB scenario in the Rusunawa context.
4.1 Respondents' perceptions of Net Zero Energy Building
4.1.1 General perceptual profile
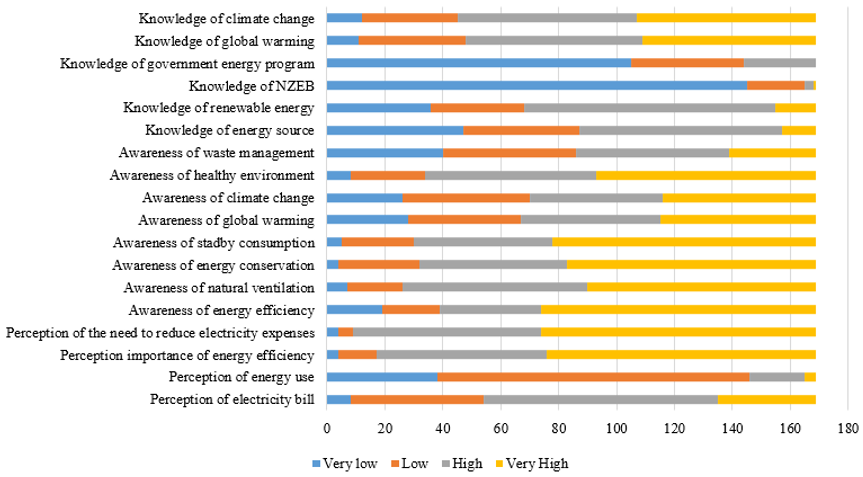
Respondents' perceptual profiles show non-uniform patterns between indicators (Table 2). In the perception aspect, the highest scores were for the importance of energy efficiency and the need to reduce electricity costs, while perceptions regarding energy use were much lower. This pattern suggests that respondents responded more strongly to energy issues when linked to practical benefits and household costs than when assessing energy use in general. In the awareness aspect, awareness levels were relatively higher for issues closely related to daily practice, particularly electricity consumption when appliances are on standby, energy conservation, natural ventilation, and energy efficiency. Conversely, awareness of broader environmental issues, such as climate change, global warming, and waste management, tended to be lower.
The most contrasting pattern was seen in the knowledge aspect. Knowledge about global warming and climate change was relatively high, but specific knowledge about the NZEB and government energy programs was the lowest across all indicators. These findings indicate a gap between practical awareness of energy use and a more specific understanding of building energy transition strategies and policies. Thus, occupants' perceptual readiness cannot be understood as a homogeneous state, but varies according to the type of information and its proximity to daily experience.
Table 2. Distribution of respondent perceptual
|
Indicators |
Mean |
Median |
Standard Deviation |
|
Perception of electricity bill |
2.85 |
3.00 |
0.81 |
|
Perception of energy use |
1.97 |
2.00 |
0.70 |
|
Perception importance of energy efficiency |
3.44 |
4.00 |
0.73 |
|
Perception of the need to reduce electricity expenses |
3.49 |
4.00 |
0.67 |
|
Awareness of energy efficiency |
3.23 |
4.00 |
1.04 |
|
Awareness of natural ventilation |
3.28 |
3.00 |
0.82 |
|
Awareness of energy conservation |
3.31 |
4.00 |
0.83 |
|
Awareness of standby consumption |
3.34 |
4.00 |
0.83 |
|
Awareness of global warming |
2.78 |
3.00 |
1.08 |
|
Awareness of climate change |
2.77 |
3.00 |
1.07 |
|
Awareness of a healthy environment |
3.22 |
3.00 |
0.87 |
|
Awareness of waste management |
2.46 |
2.50 |
1.05 |
|
Knowledge of energy source |
2.31 |
2.00 |
0.97 |
|
Knowledge of renewable energy |
2.49 |
3.00 |
0.93 |
|
Knowledge of NZEB |
1.20 |
1.00 |
0.52 |
|
Knowledge of government energy program |
1.57 |
1.00 |
0.80 |
|
Knowledge of global warming |
3.02 |
3.00 |
0.92 |
|
Knowledge of climate change |
3.05 |
3.00 |
0.92 |
4.1.2 Distribution of perceptual indicators
The analysis results show that the Rusunawa residents' perceptual profile regarding energy issues tends to be positive, but not evenly distributed across all dimensions (Figure 3). In terms of perception, residents scored high on the need to reduce electricity costs and the importance of energy efficiency, but lower on perceptions of energy use. This pattern indicates that residents respond more readily to energy issues when they are linked to practical benefits, particularly cost savings, than when asked to assess energy use more generally.
Figure 3. Distribution of perceptual indicators related to energy and Net Zero Energy Building (NZEB) among Rusunawa residents
In terms of awareness, the highest scores were for issues closely related to daily practice, such as electricity consumption when devices are on standby, energy conservation, natural ventilation, and energy efficiency. Conversely, awareness of waste management, climate change, and global warming was relatively lower. This finding suggests that occupants' awareness is stronger around energy issues directly related to the residential experience, rather than broader environmental issues.
In terms of knowledge, knowledge about climate change and global warming is relatively high, while knowledge about the NZEB and government energy programs is the lowest. This pattern indicates a gap between general knowledge about environmental issues and specific knowledge about building energy transition strategies. Thus, residents have initial capital in the form of perception and practical awareness of energy efficiency, but still need to strengthen literacy about NZEB, particularly regarding the concept, benefits, and policy support relevant to low-cost rental housing.
These findings indicate that the challenges of implementing NZEB in low-cost apartments lie not only in the technological aspect, but also in the disparity in residents' perceptual profiles. High perception and awareness of energy efficiency issues indicate that residents already have a foundation of practical awareness that can serve as initial capital to support the building's energy transition. However, low knowledge about NZEB and government energy programs indicates that residents' understanding of energy transition strategies is still limited to aspects of daily savings and has not yet developed into a more comprehensive understanding of low-energy building systems. This is in line with previous research that stated this condition impacts the importance of NZEB implementation strategies that focus not only on providing technology, but also on increasing energy literacy, communicating the benefits of technology, and delivering policy information that is more easily understood by low-energy building residents [16, 18, 45]. Without strengthening these aspects, the implementation of NZEB risks being understood only as an effort to save electricity costs by occupants, rather than as part of a broader transformation of the building's energy system.
4.1.3 Principal component analysis-based latent structure of perception, awareness and knowledge of Net Zero Energy Building
PCA was conducted separately on three respondent profile constructs—perception, awareness, and knowledge—to identify latent structures before using them in a regression-based path analysis. The analysis showed that the three constructs were not entirely unidimensional but formed several latent dimensions representing different energy orientations.
Table 3. Summary of principal component analysis (PCA) results for respondent perceptual profile
| Construct | Indicators | Cronbach's α | Analytical Decision | Latent Factor | Main Indicators | Cumulative Variance |
| Perception | 4 | 0.346 | PCA reduction not retained because internal consistency remained below 0.70 and the component structure showed weak loading and cross-loading | Four observed indicators retained individually | Perception of electricity bill; perception of energy use; perception of importance of energy efficiency; perception of the need to reduce electricity expenses | 69.62% |
| Awareness | 8 | 0.834 | PCA reduction retained | Awareness of Energy Conservation | Awareness of standby consumption; Awareness of energy conservation; Awareness of energy efficiency | 81.76% |
| Awareness of Climate Change | Awareness of global warming; Awareness of climate change | |||||
| Awareness of Sustainable Living Environment | Awareness of healthy environment; Awareness of natural ventilation; Awareness of waste management | |||||
| Knowledge | 6 | 0.919 | PCA reduction retained | General Energy and Environmental Knowledge | Knowledge of climate change; Knowledge of global warming; Knowledge of renewable energy; Knowledge of energy source | 87.21% |
| NZEB and Energy Policy Knowledge | Knowledge of government energy program; Knowledge of NZEB |
In the Perception group, the four initial indicators produced a Cronbach's α of 0.346, well below the 0.70 threshold used in this study (Table 3). Further examination shows that perception of energy use is the weakest indicator; Its deletion increased the α value to 0.563, but this value still did not meet the reliability criteria. The PCA results also do not show a clear reduction structure. Perception of energy use has low loading on both components, while perception of the need to reduce electricity expenses shows cross-loading on two components. Taking into account the low internal consistency and unclear structure of these components, the PCA reduction results for Perception were not retained in subsequent analyses.
This decision does not mean that the Perception indicator is excluded from the analysis. The four indicators are retained as observed variables that are analyzed individually, because each represents a different aspect of perception, namely perceptions of electricity bills, energy use, the importance of energy efficiency, and the need to reduce electricity expenditure. With this approach, the subsequent analysis does not assume that the four indicators form one homogeneous Perception construct, but tests the relationship of each indicator with WTA and WTP separately.
Different with perception construct, for the awareness construct, a Cronbach's α value of 0.834 indicates good internal reliability. PCA yielded three latent factors with a cumulative variance of 81.76%. The first factor, named Awareness of Energy Conservation, encompasses awareness of energy efficiency, energy conservation, and standby electricity consumption. The second factor, named Awareness of Climate Change, encompasses indicators of global warming and climate change. The third factor, named Awareness of Sustainable Living Environment, relates to natural ventilation, a healthy environment, and waste management. This structure indicates that occupants' awareness extends beyond energy savings to global environmental issues and the quality of their daily living environment.
For the knowledge construct, a Cronbach's α value of 0.919 indicates excellent internal consistency. PCA yielded two latent factors. The first factor, named General Energy and Environmental Knowledge, encompasses knowledge about energy sources, renewable energy, global warming, and climate change. The second factor, named NZEB and Energy Policy Knowledge, encompasses more specific knowledge about NZEB and government energy programs. Although the second factor has an eigenvalue slightly below 1, it was retained due to its clear conceptual basis, namely the separation between general energy-environmental knowledge and specific knowledge related to building energy transition policies and strategies.
Overall, the PCA results indicate that respondents' profiles regarding energy and NZEB issues are formed from a combination of dimensions of cost perception, efficiency perception, energy conservation awareness, environmental awareness, and energy and policy knowledge. This finding is important because it indicates that acceptance of the NZEB scenario cannot be explained solely through a single, homogeneous perceptual construct. Therefore, the latent factors formed from the PCA were used as predictor variables in the analysis of the relationship between WTA and WTP in the next stage.
4.2 Willingness to adopt and willingness to pay of Net Zero Energy Building scenario
4.2.1 Overall distribution across Net Zero Energy Building scenario groups
Analyzing the distribution of WTA and WTP by scenario group is crucial for understanding how residents respond to various NZEB approaches in general before delving into individual scenarios. This analysis reveals which intervention groups are relatively more readily accepted, which are most difficult to afford, and the extent of the gap between residents' acceptance and financial preparedness.
Overall, the results indicate that residents are more willing to accept the implementation of NZEB than to finance it. This is evident from the relatively high WTA values across all scenario groups, while WTP remains low (Table 4). In other words, residents do not fundamentally reject the NZEB concept, but their willingness to share in the implementation costs remains limited.
The largest gap was observed in the passive design and energy substitution groups. This indicates that both groups were considered attractive or beneficial but were perceived as costly or beyond the occupants' control due to their relationship to the building's physical structure and underlying technology. Conversely, the energy conservation group showed the smallest gap between WTA and WTP, making it the most realistic intervention to implement in the Rusunawa context. This is likely because energy conservation interventions are more closely aligned with everyday energy usage habits and do not require major building changes.
Table 4. Willingness to adopt (WTA) and willingness to pay (WTP) for each group Net Zero Energy Building (NZEB) scenario
|
Scenario Group |
Mean WTA |
Median WTA |
Mean WTP |
Median WTP |
|
Active design |
2.40 |
3.00 |
1.76 |
1.00 |
|
Passive design |
2.83 |
3.00 |
1.22 |
1.00 |
|
Energy efficiency |
2.60 |
3.00 |
2.13 |
1.00 |
|
Energy conservation |
2.83 |
3.00 |
2.50 |
1.00 |
|
Energy substitution |
2.91 |
3.00 |
1.49 |
1.00 |
These findings indicate that the challenges of implementing NZEB in Rusunawa are not only about technology acceptance, but also related to affordability, perception of responsibility, and the ability of residents to participate in financing building energy interventions.
4.2.2 Acceptance pattern across individual Net Zero Energy Building scenarios
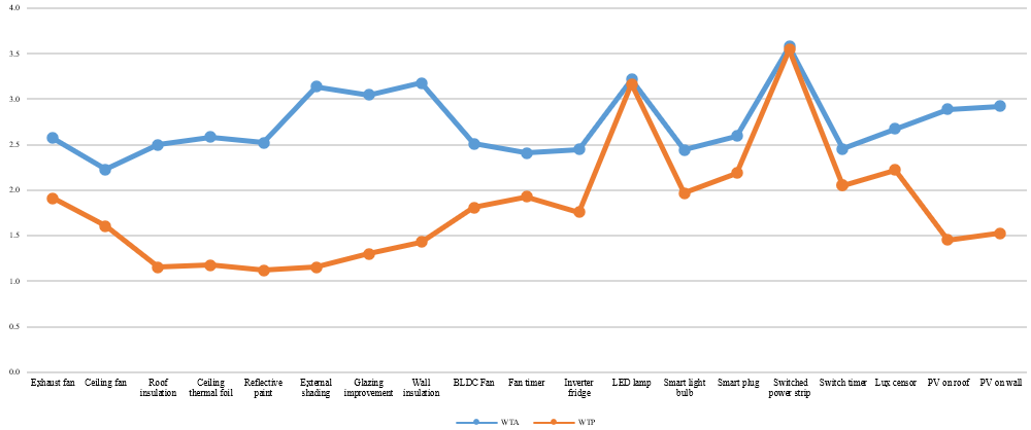
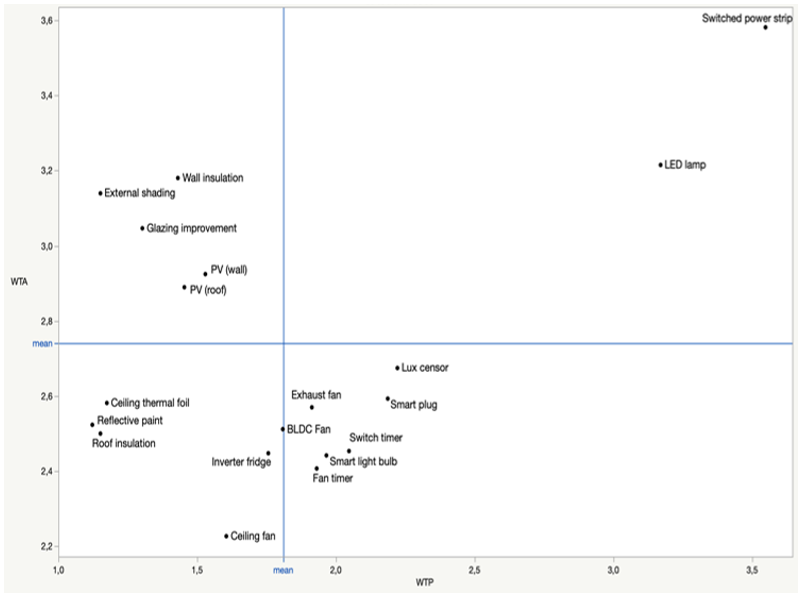
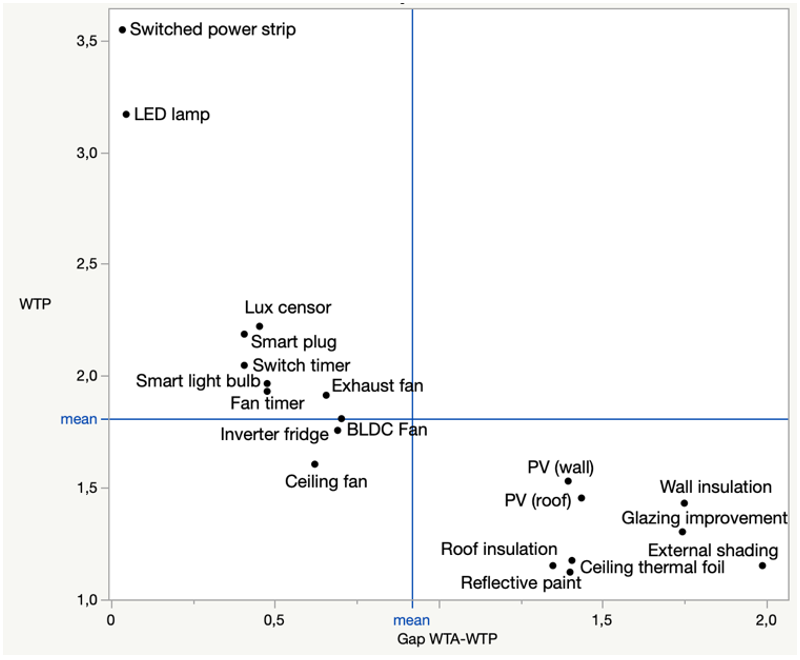
At the individual scenario level, resident acceptance patterns appear more diverse than at the scenario group level. Some interventions exhibit a relatively balanced combination of WTA and WTP, while others show a significant gap between adoption intention and WTP (Figure 4). This suggests that resident responses are influenced not only by the type of scenario group but also by the practical characteristics of each intervention.
Scenarios related to everyday energy savings and the use of familiar devices tend to achieve more stable acceptance. Interventions such as electricity consumption management, energy-saving devices, or electricity usage controls are relatively more readily accepted because they are perceived as being close to residents' routine activities and their benefits are more readily perceived. Conversely, interventions related to physical changes to buildings or major technologies show a larger gap between WTA and WTP. This pattern indicates that residents may accept the idea of implementing such technologies, but do not yet feel they have the capacity or responsibility to finance them.
The differences in patterns across scenarios also indicate that residents' perceptions of NZEB are not uniform. Technologies perceived as simple, easy to use, and having immediate benefits on electricity costs tend to be more readily accepted than technologies perceived as complex, expensive, or beyond residents' control. Thus, acceptance of NZEB in Rusunawa is more influenced by the intervention's proximity to residents' daily experiences than by the technology's level of innovation alone.
Figure 4. Gap between willingness to adopt (WTA) and willingness to pay (WTP) across individual Net Zero Energy Building (NZEB) scenario
4.2.3 Reasons for unwillingness to adopt and unwillingness to pay
An analysis of the reasons for unwillingness to adopt and pay for NZEB shows that the barriers to acceptance of NZEB in low-cost apartments are multi-layered, not simply a matter of individual preference. Economic barriers are the most dominant issue, particularly related to affordability and the low perceived value of the proposed scenario. This finding suggests that some residents do not necessarily reject the NZEB idea but rather do not yet see the intervention as a priority worthy of their own financing. In the context of low-cost housing, this pattern is important because payment decisions are heavily influenced by economic capacity, perceived benefits, and perceptions of who should bear the costs [9, 17].
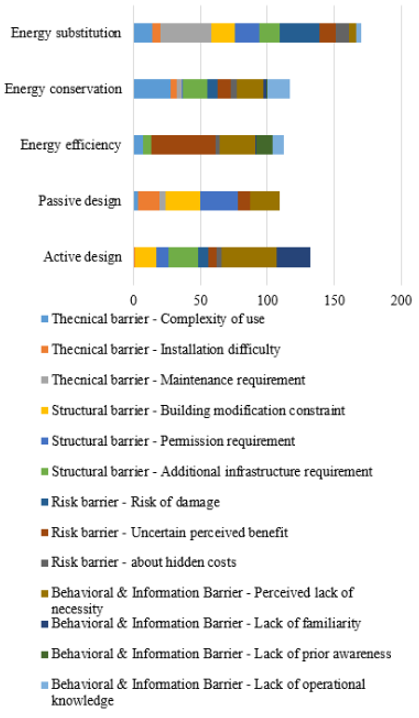
In low-cost rental house (Rusunawa), residents' reluctance to adopt NZEB technology stems not solely from technical limitations, but rather from a combination of behavioral-informational, structural, and perceived risk barriers. Figure 5 shows that the largest barriers are behavioral and informational barriers, with a total of 185 responses. This is primarily due to perceived lack of necessity (115), far more dominant than a lack of initial awareness or operational knowledge. This suggests that the problem is not simply that residents simply "don't know," but rather that they haven't yet seen the urgency and direct relevance of the technology to their daily lives. The next barrier is the structural barrier, with a total of 177 responses, primarily regarding the need for additional infrastructure, building modification constraints, and permit requirements. This pattern makes sense in the low-cost apartment context, as residents have limited decision-making power over shared building elements, fixed installations, and interventions requiring management approval. In the energy substitution group, the most prominent barriers arise from maintenance requirements, the risk of damage, and infrastructure requirements, making technologies such as PV or energy substitution systems unrealistic as individual resident choices. In contrast, in active design and some energy efficiency, barriers arise more from the perception of unnecessaryness and uncertainty of benefits, which means that strategies for communicating benefits, demonstrating savings, and simplifying use are important. Therefore, the adoption of NZEB technology in low-cost apartments cannot be driven solely through technology provision, but requires strategic differentiation: simple technologies can be guided through education and direct evidence of benefits, while technologies involving physical changes to buildings, infrastructure, and investment risks must be positioned as interventions by managers, developers, or the government.
Figure 5. Distribution of technical, structural, risk and behavioral barriers across energy intervention scenario groups
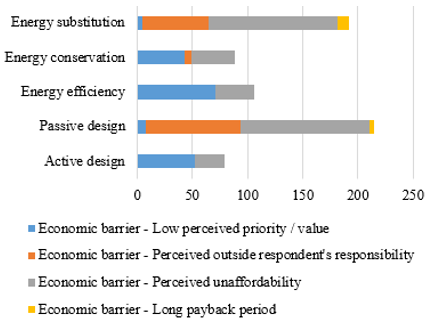
Figure 6. Distribution of economic barriers across energy intervention scenario groups
Beyond economic factors (Figure 6), structural barriers also became evident, especially in scenarios involving physical alterations to buildings or key energy systems (Figure 5). The requirement for permits, restrictions on building modifications, and the belief that certain scenarios fall outside residents’ control all point to limits on user control within the Rusunawa context. Therefore, low uptake or payment for some scenarios should not be interpreted solely as a lack of interest; it also reflects the institutional structure of Rusunawa, in which residents are not full owners of the building and lack direct authority over physical interventions. Technical barriers and risks were more pronounced in scenarios that required specific technologies, installations, or maintenance. Worries about damage, maintenance demands, the complexity of use, and uncertainty regarding benefits suggested that some NZEB scenarios were still viewed as complex and risky interventions. Meanwhile, behavioral and informational barriers implied that some residents did not yet perceive the need for particular interventions or were not yet familiar with how to use them. Overall, these findings support the conclusion that implementing NZEB in Rusunawa requires a tailored response for each barrier type: subsidies or financing schemes for economic barriers, management support for structural barriers, technical assistance for operational barriers, and clearer communication of benefits for informational and behavioral barriers.
Figure 6 shows that the most dominant economic barrier across all scenario groups is perceived unaffordability, with the highest values observed in passive design and energy substitution at 116 each. This indicates that interventions such as passive design improvements and energy source substitution are still perceived as requiring substantial upfront investment, making cost perception a major constraint to implementation.
The second most prominent barrier is low perceived priority/value, particularly in energy efficiency and active design, with values of 71 and 52, respectively. This suggests that some respondents do not yet perceive these interventions as urgent priorities or do not clearly recognize their long-term benefits. Meanwhile, perceived outside tenant responsibility is also relatively significant, with a total of 153, especially in passive design and energy substitution. This implies that interventions involving physical building modifications, utility systems, or energy infrastructure are more likely to be viewed as the responsibility of building owners or managers rather than tenants.
By contrast, long payback period appears to be the least significant economic barrier, with a total value of only 16, mainly associated with energy substitution and passive design. Therefore, the main economic challenge is not merely the duration of investment return, but rather the perception of high initial costs, limited perceived value, and unclear responsibility among stakeholders.
These findings indicate that economic barriers are shaped not only by actual cost considerations, but also by perceived value, responsibility distribution, and decision-making authority. Implementation strategies should therefore focus on flexible financing mechanisms, clearer communication of long-term benefits, and a more explicit division of roles among building owners, managers, and tenants.
4.2.4 Principal component analysis-based latent structure of willingness to adopt and willingness to pay scenario groups
PCA was performed on NZEB scenario groups with four or more indicators to reduce the indicators and form a composite score prior to regression analysis. Scenario groups with a limited number of indicators, namely active design and energy substitution, were calculated using the mean score because they only consisted of two indicators and were insufficient to form a stable factor structure. With this approach, all WTA and WTP variables were represented as PCA factor scores or average scores according to the characteristics of the constituent indicators.
The PCA results show that the passive design scenario has a multidimensional latent structure (Table 5). In the WTA scenario, this scenario is divided into two factors: WTA Roof Thermal Protection Scenario and WTA Facade and Envelope Performance Scenario. The first factor includes roof-based interventions, such as roof insulation, reflective paint, and thermal ceiling foil, while the second factor includes interventions on the building envelope and facade, such as wall insulation, external shading, and glazing improvements. A similar pattern also emerged in WTP, which formed two factors: WTP Roof Thermal Protection Scenario and WTP Facade and Envelope Performance Scenario. These findings indicate that occupant acceptance of passive design is not a single factor but is differentiated between interventions that work on the roof area and interventions that improve the performance of the facade and building envelope.
Table 5. Summary of principal component analysis (PCA) and Composite Scoring for willingness to adopt (WTA) and willingness to pay (WTP) Scenario Groups
|
Scenario Group |
Variable |
Score Construction |
Cronbach's α |
Latent Factor |
Main Indicators |
|
Active design |
Y1 WTA |
Mean score |
Not PCA |
WTA Active Design Scenario |
Exhaust fan; ceiling fan |
|
Y6 WTP |
Mean score |
Not PCA |
WTP Active Design Scenario |
Exhaust fan; ceiling fan |
|
|
Passive design |
Y2 WTA |
PCA |
0.931 |
WTA Roof Thermal Protection Scenario |
Roof insulation; reflective paint; ceiling thermal foil |
|
WTA Facade and Envelope Performance Scenario |
Wall insulation; external shading; glazing improvement |
||||
|
Y7 WTP |
PCA |
0.841 |
WTP Roof Thermal Protection Scenario |
Reflective paint; roof insulation; ceiling thermal foil |
|
|
WTP Facade and Envelope Performance Scenario |
Wall insulation; glazing improvement; external shading |
||||
|
Efficiency |
Y3 WTA |
PCA |
0.898 |
WTA Energy Efficiency Scenario |
BLDC fan; fan timer; inverter fridge; LED lamp; smart light bulb |
|
Y8 WTP |
PCA |
0.880 |
WTP Energy Efficiency Scenario |
BLDC fan; fan timer; inverter fridge; LED lamp; smart light bulb |
|
|
Conservation |
Y4 WTA |
PCA |
0.875 |
WTA Energy Conservation Scenario |
Smart plug; switched power strip; switch timer; lux sensor |
|
Y9 WTP |
PCA |
0.865 |
WTP Energy Conservation Scenario |
Smart plug; switched power strip; switch timer; lux sensor |
|
|
Energy substitution |
Y5 WTA |
Mean score |
Not PCA |
WTA Energy Substitution Scenario |
Rooftop PV; wall-mounted PV |
|
Y10 WTP |
Mean score |
Not PCA |
WTP Energy Substitution Scenario |
Rooftop PV; wall-mounted PV |
In contrast to the passive design scenario, the efficiency and conservation scenarios exhibit a unidimensional structure, both in terms of WTA and WTP. In the efficiency scenario, all indicators, such as BLDC fans, fan timers, inverter fridges, LED lamps, and smart light bulbs, form a single factor representing acceptance of increased household appliance efficiency. In the conservation scenario, indicators such as smart plugs, switched power strips, switch timers, and lux sensors also form a single factor representing acceptance of electricity use control strategies and simple automation at the household level.
Meanwhile, the active design and energy substitution scenarios were calculated using the mean score. The active design scenario included exhaust fans and ceiling fans, while the energy substitution scenario included rooftop PV and wall PV. The use of the mean score for these two groups was chosen due to the limited number of indicators and because each indicator is treated as a direct representation of the corresponding scenario construct.
Overall, the data reduction results indicate that acceptance of the NZEB scenarios does not always follow the same structure. The passive design scenario requires factor separation because it encompasses different physical building intervention characteristics, while the efficiency and conservation scenarios can be treated as a single construct. The composite score resulting from this stage was then used as the dependent variable in a regression-based path analysis to examine the influence of occupant perception profiles, awareness, and knowledge on WTA and WTP.
4.3 Regression analysis of perceptual predictors of willingness to adopt and willingness to pay
Before the regression analysis is carried out, the relationship between the predictor variables is checked to ensure that there is no multicollinearity that could interfere with the model estimation. Examination was carried out on nine predictors, consisting of four Perception indicators which were maintained as individual observed variables, three Awareness components from PCA results, and two Knowledge components from PCA results. The correlation results show that all inter-predictor coefficients are below 0.70. The highest correlation was found between Awareness of Climate Change (X2b) and General Energy and Environmental Knowledge (X3a) of r = 0.634, followed by the relationship between General Energy and Environmental Knowledge (X3a) and NZEB and Energy Policy Knowledge (X3b) of r = 0.623. Among the four Perception indicators, the highest correlation is between perception of the importance of energy efficiency (X1.3) and perception of the need to reduce electricity expenses (X1.4) at r = 0.557, while the correlation between other Perception indicators is lower. This pattern shows that the four Perception indicators are related to each other in a limited way, but do not show the degree of overlap that would indicate high redundancy. Further examination showed that the VIF values were in the range 1.14–2.34, with all values below the threshold of 5. Thus, no indication of significant multicollinearity was found, so the nine predictors were retained and entered simultaneously in the subsequent regression analysis.
After BH-FDR correction, the relationship pattern that emerged became clearer (Table 6). Knowledge is the aspect most consistently related to WTA and WTP, while the Perception indicator and the Awareness component no longer show a strong enough relationship after all predictors are tested simultaneously. In the WTA, the most consistent relationship comes from General Energy and Environmental Knowledge, which appears in almost all scenarios. This suggests that residents' readiness to adopt NZEB interventions is largely underpinned by a general understanding of energy and the environment.
For WTP, the pattern is more diverse. General Energy and Environmental Knowledge remains important in some scenarios, but NZEB and Energy Policy Knowledge is more prominent in interventions related to building elements and energy substitution. Thus, readiness to pay appears to require more specific knowledge than readiness to adopt. These results show that WTA and WTP are not formed in the same way, even though they both depend heavily on aspects of knowledge.
Table 6. Regression respondent’s perception of willingness to adopt (WTA) and willingness to pay (WTP) Net Zero Energy Building (NZEB) scenario
|
Dependent Variable |
FDR-Retained Predictor |
Estimate (B) |
Raw p |
FDR-Adjusted p |
R² |
Adjusted R² |
Model p |
|
WTA |
|||||||
|
Y1 Active Design |
X3a General Energy and Environmental Knowledge |
0.4375 |
<0.0001 |
0.0011 |
0.1903 |
0.1625 |
<0.0001 |
|
Y2a Roof Thermal Protection |
X3a General Energy and Environmental Knowledge |
0.3646 |
0.0006 |
0.0054 |
0.0854 |
0.074 |
0.0098 |
|
X3b NZEB and Energy Policy Knowledge |
−0.610 |
0.0007 |
0.0054 |
||||
|
Y2b Facade and Envelope Performance |
X3a General Energy and Environmental Knowledge |
0.3757 |
<0.0001 |
0.0011 |
0.1819 |
0.1528 |
<0.0001 |
|
Y3 Energy Efficiency |
X3a General Energy and Environmental Knowledge |
0.4542 |
<0.0001 |
0.0011 |
0.3007 |
0.2785 |
<0.0001 |
|
Y4 Energy Conservation |
X3a General Energy and Environmental Knowledge |
0.5701 |
<0.0001 |
0.0011 |
0.3715 |
0.3535 |
<0.0001 |
|
Y5 Energy Substitution |
X3a General Energy and Environmental Knowledge |
0.6514 |
<0.0001 |
0.0011 |
0.3792 |
0.3611 |
<0.0001 |
|
WTP |
|||||||
|
Y6 Active Design |
X3a General Energy and Environmental Knowledge |
0.2403 |
0.0052 |
0.3250 |
0.2188 |
0.1924 |
<0.0001 |
|
X3b NZEB and Energy Policy Knowledge |
0.3375 |
0.0010 |
0.0750 |
||||
|
Y7a Roof Thermal Protection |
None retained after FDR correction |
– |
– |
– |
0.0819 |
0.069 |
0.0924 |
|
Y7b Facade and Envelope Performance |
X3b NZEB and Energy Policy Knowledge |
0.4271 |
<0.0001 |
0.0014 |
0.3097 |
0.2882 |
<0.0001 |
|
Y8 Energy Efficiency |
X3a General Energy and Environmental Knowledge |
0.3292 |
<0.0001 |
0.0014 |
0.3153 |
0.2944 |
<0.0001 |
|
Y9 Energy Conservation |
X3a General Energy and Environmental Knowledge |
0.3938 |
<0.0001 |
0.0014 |
0.2861 |
0.2632 |
<0.0001 |
|
Y10 Energy Substitution |
X3b NZEB and Energy Policy Knowledge |
0.3507 |
<0.0001 |
0.0014 |
0.2403 |
0.2153 |
<0.0001 |
5.1 General energy knowledge as the primary basis of Net Zero Energy Building acceptance
The regression results indicate that respondents' acceptance of the NZEB scenario is primarily supported by General Energy and Environmental Knowledge. This pattern suggests that respondents with a better understanding of energy and environmental issues tend to be better able to recognize the value of various NZEB scenarios, both in terms of WTA and WTP. Conceptually, this finding aligns with the energy literacy and knowledge-attitude-behavior frameworks, which position knowledge as a prerequisite for forming attitudes and intentions toward energy-saving behavior [18, 45, 46]. In the context of this study, general knowledge not only serves as basic information, but also as a mechanism that helps respondents understand the relationship between household energy consumption, building efficiency, cost savings, and environmental impacts. Thus, NZEB acceptance cannot be built solely through normative campaigns about the importance of energy efficiency but requires more concrete and applicable energy literacy improvements.
In contrast to general knowledge, NZEB and energy policy knowledge exhibit a more selective relationship. This suggests that respondents who better understand the concepts of NZEB and energy policy may be more critical in assessing certain scenarios, particularly when those scenarios are perceived as requiring high costs, institutional responsibility, or policy support. In other words, policy knowledge can function as a critical filter: This driver enhances respondents' ability to evaluate the feasibility of an intervention, but does not necessarily automatically increase acceptance. This pattern can be linked to the Theory of Planned Behavior, particularly regarding aspects of attitude, perceived control, and assessment of implementation barriers [47]. If respondents understand that NZEB scenarios require costs, regulations, incentives, or institutional support, their acceptance becomes more conditional. This finding strengthens the argument that policy education must be accompanied by clarity on implementation mechanisms, not just a general presentation of the NZEB concept.
5.2 Scenario-specific drivers and the adoption-payment gap
Regression results show that WTA and WTP are not formed by the same knowledge patterns. In WTA, General Energy and Environmental Knowledge is the most consistent factor in almost all scenarios. This means that residents' readiness to accept an intervention is more related to their general understanding of energy, the environment and renewable energy. In WTP, the pattern is more segmented. General knowledge remains related to payment readiness in active design, efficiency and conservation scenarios, while NZEB and Energy Policy Knowledge is more prominent in active design, facade and building envelope repairs, and energy substitution. These differences suggest that the decision to accept an intervention and the decision to be willing to bear its costs do not follow entirely the same logic. This finding is in line with studies on the attitude–behavior gap and intention–behavior gap, which show that positive acceptance of an innovation does not always translate into economic action or commitment [13, 41, 46].
This pattern also helps explain the adoption-payment gap found across various NZEB scenarios. Readiness for adoption appears to be based on a relatively general understanding of energy, while readiness to pay for some interventions requires a more specific understanding of how NZEB works, its benefits, and the policy context supporting its implementation. Interestingly, after controlling for the influence of inter-predictor factors and multiple testing, the Perception indicator and the Awareness component no longer showed a strong correlation. Therefore, efforts to increase NZEB acceptance in low-cost apartments should not stop at increasing general awareness but rather focus on strengthening knowledge relevant to the intervention's characteristics. For scenarios requiring greater investment or involving building elements and energy sources, information on implementation mechanisms, benefits, division of responsibilities, and potential institutional support is more relevant than simply campaigning on the importance of energy conservation.
5.3 WTA–WTP acceptance pattern
The acceptance pattern of the NZEB scenario is analyzed through mapping between WTA and WTP in each scenario. WTA indicates the residents' readiness to accept or adopt the intervention, while WTP indicates their readiness to pay the cost of implementation offered. The average WTA and WTP values for each scenario are compared with the empirical average of all scenarios to form four quadrants. Therefore, the categories "high" and "low" are relative to the tendencies of the respondents in the sample, not absolute limits of acceptance or rejection. This mapping is used to see the extent to which adoption readiness and payment readiness go in the same direction for each intervention (Figure 7).
Figure 7. Acceptance pattern of Net Zero Energy Building (NZEB) scenario in low-cost vertical house
LED and switched power strips are in the high WTA–high WTP quadrant, indicating the strongest alignment between adoption readiness and payment readiness. The technology's simple nature, familiarity, ease of installation, and relatively easy-to-understand savings benefits likely make both scenarios more acceptable to residents. On the other hand, wall insulation, external shading, glazing improvement, roof PV, and wall PV are in the high WTA–low WTP quadrant. This pattern suggests that residents are likely to accept the benefits of the intervention, but their readiness to bear the costs of implementation is more limited. In the context of flats, this condition leads to the need to consider the role of managers or external financing support, especially for interventions that involve shared building elements or require larger initial costs.
Another group is in the low WTA–low WTP quadrant, namely reflective paint, roof insulation, ceiling thermal foil, ceiling fan, BLDC fan, exhaust fan, inverter refrigerator, switch timer, and smart lamp. This position indicates that neither the benefits nor the urgency of the intervention are strong enough to encourage readiness for adoption or payment among respondents. Meanwhile, the lux sensor and smart plug are in the low WTA–high WTP quadrant. In this group, barriers appear to be more related to readiness to accept technology than ability to pay, so factors such as familiarity, clarity of benefits, and ease of use become more relevant to pay attention to.
Overall, the WTA–WTP map shows that the highest alignment occurs for technologies that are simple, familiar, and whose benefits are immediately felt in everyday electricity use. In contrast, interventions at the building scale and renewable energy integration show a greater gap between adoption readiness and payment readiness. These findings confirm that the acceptability of NZEB in flats depends not only on whether a technology is considered beneficial, but also on who is expected to bear the costs and how closely the benefits are felt by residents.
5.4 Adoption gap and payment readiness
Further analysis was conducted using the Occupant Adoption–Payment Alignment Map, which plots the adoption-payment gap and WTP for each scenario (Figure 8). The adoption-payment gap is calculated as the difference between WTA and WTP, indicating the extent to which residents' readiness to adopt an intervention differs from their readiness to pay for its implementation. This mapping complements the WTA–WTP analysis in Section 5.3 because it not only shows the relative position of acceptance and readiness to pay but also helps determine whether they move in the same direction or show a gap. The quadrant dividing lines are determined based on the empirical average of the adoption-payment gap and WTP across all scenarios, so their interpretation is relative to the respondent patterns in this study.
Figure 8. Occupant adoption–payment alignment map
Groups with small gaps and relatively high WTP show better alignment between adoption readiness and payment readiness. This group includes power strips, LED lights, lux sensors, smart plugs, timer switches, smart lamps, fan timers, and exhaust fans. However, this position still needs to be read together with the results of the previous WTA–WTP mapping. LED lights and power strips show the most consistent pattern because they are also in the high WTA–high WTP category. Meanwhile, control technologies such as lux sensors and smart plugs have relatively better payment readiness compared to their adoption readiness. In such scenarios, reinforcing familiarity, explaining benefits, and ease of use can be an important part of encouraging acceptance.
In contrast, scenarios such as wall insulation, glazing improvements, external shading, rooftop PV, wall PV, roof insulation, ceiling thermal foil, and reflective paint show a larger gap with relatively low WTP. This pattern indicates that acceptance of the benefits of interventions is not always accompanied by residents' readiness to bear the costs of implementation. In the context of low-cost apartments (Rusunawa), these conditions need to be interpreted in conjunction with the nature of the intervention, particularly when it involves shared building elements or requires a larger initial outlay. Therefore, its implementation is more appropriately considered through management involvement, institutional support, or other financing mechanisms, rather than solely relying on individual resident payments.
Groups with small gaps but relatively low WTP, such as ceiling fans, BLDC fans, and inverter refrigerators, show different conditions. In this group, the problem is not primarily a mismatch between adoption and payments, but the low position of both forms of readiness simultaneously. This means that increasing take-up likely requires more concrete and easily perceived benefits, for example through savings information, performance demonstrations, or combining interventions into efficiency-improving packages that are easier for residents to understand.
Overall, the adoption-payment gap–WTP map shows that the NZEB implementation strategy in flats cannot be uniform. Some interventions demonstrate fairly good alignment between adoption readiness and payment, others require strengthening understanding of benefits, while interventions related to co-building elements or larger investments demonstrate the need to consider manager support and institutional financing mechanisms. Thus, this map is more appropriate to use as a tool to read occupant readiness patterns and direct the choice of implementation strategies, rather than as a direct measure of financial feasibility.
The conclusion of this study shows that residents' readiness for the NZEB scenario is not uniform. After the relationship between predictors and multiple testing was controlled, knowledge became the only perceptual dimension that was consistently related to WTA and WTP, while Perception and Awareness did not show a sufficiently robust relationship. WTA is mainly related to general knowledge about energy and the environment, while WTP shows a more specific pattern because in some scenarios it is also related to knowledge about NZEB and energy policy. This difference emphasizes the existence of an adoption-payment gap: readiness to accept an intervention is not always accompanied by readiness to bear the costs of its implementation. Therefore, the NZEB strategy in flats needs to consider not only the characteristics of the technology, but also the level of knowledge of residents, the form of perceived benefits, as well as the division of financing responsibilities between residents and managers.
These findings expand the discussion of NZEB acceptability by directly distinguishing adoption readiness and payment readiness in the same scenario. However, WTP in this study represents stated payment willingness, not actual payment value or a measure of financial feasibility. Future research needs to test whether these patterns persist across real adoption and payment decisions, as well as incorporate managers' perspectives and financing mechanisms to assess how the adoption-payment gap can be translated into more operational NZEB implementation strategies
The authors would like to express their gratitude to the residents of the low-cost rental housing complexes in Surabaya who participated in this study. Appreciation is also extended to the housing management personnel and relevant parties for facilitating access to the study sites and supporting the field data collection. The authors gratefully acknowledge the Building Technology Laboratory and the Architectural Design Laboratory at Institut Teknologi Bandung (ITB) for their academic and technical support throughout the research process.
This research was supported by the Center for Higher Education Funding and Assessment (Pusat Pelayanan Pembiayaan dan Asesmen Pendidikan Tinggi, PPAPT), under the Ministry of Education, Culture, Research, and Technology of the Republic of Indonesia, as well as by the Indonesia Endowment Fund for Education (Lembaga Pengelola Dana Pendidikan, LPDP) and the Indonesian Education Scholarship (Beasiswa Pendidikan Indonesia, BPI).
[1] Sisdwinugraha, A.P., Hapsari, A., Wijaya, F., et al. (2024). Indonesia energy transition outlook 2025 navigating Indonesia's energy transition at the crossroads: A pivotal moment for redefining the future. Institute for Essential Services Reform, 5(1): 114. https://iesr.or.id/wp-content/uploads/2024/12/Indonesia-Energy-Transition-Outlook-2025-Digital-Version.pdf.
[2] Prihapsari, S.D., Adilah, N.A., Yaman, A., et al. (2022). Informasi Statistik Infrastruktur PUPR 2022. Jakarta: Kementerian Pekerjaan Umum dan Perumahan Rakyat.
[3] Surahman, U., Hartono, D., Setyowati, E., Jurizat, A. (2022). Investigation on household energy consumption of urban residential buildings in major cities of Indonesia during COVID-19 pandemic. Energy and Buildings, 261: 111956. https://doi.org/10.1016/j.enbuild.2022.111956
[4] Riotama, T., Sodri, A., Sundara, D.M. (2022). Study of passive design and energy in vertical housing.AIP Conference Proceedings, 2534(1): 020010. https://doi.org/10.1063/5.0105743
[5] CLASP. (2020). Indonesia Residential End Use Survey. https://www.clasp.ngo/wp-content/uploads/2021/01/Indonesia-Residential-End-Use-Survey.pdf, accessed on Jan. 29, 2025.
[6] Svendsen, A., Schultz, P.C. (2022). Roadmap for an energy efficient, low-carbon buildings and construction sector in Indonesia. Global Alliance for Buildings and Construction, pp. 1-95. https://globalabc.org/sites/default/files/2022-08/Roadmap%20for%20an%20Energy%20Efficient%2C%20Low-Carbon%20Buildings%20and%20Construction%20Sector%20in%20Indonesia.pdf.
[7] Abdou, N., Mghouchi, Y.E., Hamdaoui, S., Asri, N.E., Mouqallid, M. (2021). Multi-objective optimization of passive energy efficiency measures for net-zero energy building in Morocco. Building and Environment, 204: 108141. https://doi.org/10.1016/j.buildenv.2021.108141
[8] Wu, Q., Ni, Y., Fang, Z., Liu, S., Jiang, Y. (2026). Active-passive coupling in building design: A review of parameter interactions for energy performance and thermal and visual comfort. Energy and Buildings, 356: 117099. https://doi.org/10.1016/j.enbuild.2026.117099
[9] Krisnanto, E.R.N.A., Surahman, U.S.E.P., Maknun, J.O.H.A.R., Afifah, V. (2018). The analysis of household energy consumption of public apartments in Indonesia: A case study of Rusunawa buildings in Bandung city. Journal of Engineering Science and Technology, 13(7): 1926-1938.
[10] Poblete-Cazenave, M., Pachauri, S. (2021). A model of energy poverty and access: Estimating household electricity demand and appliance ownership. Energy Economics, 98: 105266. https://doi.org/10.1016/j.eneco.2021.105266
[11] Kisnarini, R. (2015). Functionality and adaptability of low cost apartment space design: A case of Surabaya Indonesia. Doctor of Philosophy, Technische Universiteit Eindhoven.
[12] Perdamaian, L.G., Zhai, Z. (2024). Status of livability in Indonesian affordable housing. Architecture, 4(2): 281-302. https://doi.org/10.3390/architecture4020017
[13] Hojnik, J., Ruzzier, M., Fabri, S., Klopčič, A.L. (2021). What you give is what you get: Willingness to pay for green energy. Renewable Energy, 174: 733-746. https://doi.org/10.1016/j.renene.2021.04.037
[14] Pradani, F.A., Septanaya, I.D.M.F. (2025). A cost efficiency study of the housing voucher program as an alternative housing policy for low-income communities in Surabaya City. Jurnal Penataan Ruang, 20: 158-171. https://doi.org/10.12962/j2716179X.v20iII.5211
[15] Strazzera, E., Meleddu, D., Contu, D., Fornara, F. (2024). Willingness to pay for innovative heating/cooling systems: A comprehensive appraisal of drivers and barriers to adoption in Ireland and Italy. Renewable and Sustainable Energy Reviews, 192: 114192. https://doi.org/10.1016/j.rser.2023.114192
[16] Wilis, F.A., Larasat, D. (2024). Drivers for implementing green building concept to vertical housing construction in Indonesia based on stakeholders' perspective. Journal of Construction in Developing Countries, 29: 267-285. https://doi.org/10.21315/jcdc.2024.29.S1.13
[17] Akbari, S., Haghighat, F. (2021). Occupancy and occupant activity drivers of energy consumption in residential buildings. Energy and Buildings, 250: 111303. https://doi.org/10.1016/j.enbuild.2021.111303
[18] Hendinata, L.K., Ardiwinata, T., Pratama, F.K.T. (2022). The role of energy literacy in supporting energy conservation: Perspective from Indonesian citizens. Indonesian Journal of Energy, 5(2): 105-113. https://doi.org/10.33116/ije.v5i2.113
[19] Lou, J., Wang, B., Yuan, Z., Lu, W. (2024). Willingness to pay for well-being housing attributes driven by design layout: Evidence from Hong Kong. Building and Environment, 251: 111227. https://doi.org/10.1016/j.buildenv.2024.111227
[20] Roth, L., Lowitzsch, J., Yildiz, Ö. (2023). Which (co-) ownership types in renewables are associated with the willingness to adopt energy-efficient technologies and energy-conscious behaviour? Data from German households. Energy Policy, 180: 113683. https://doi.org/10.1016/j.enpol.2023.113683
[21] Li, Q., Qian, T., Long, R., Chen, H., Wang, J., Chen, M. (2024). An experimental study on premium measurement in response to residents' willingness to pay for green housing in urban areas. Resources, Conservation and Recycling, 211: 107870. https://doi.org/10.1016/j.resconrec.2024.107870
[22] Huo, T., Cai, W., Zhang, W., Wang, J., Zhao, Y., Zhu, X. (2021). How does income level impact residential-building heating energy consumption? Micro-level evidence from household surveys. Environmental Impact Assessment Review, 91: 106659. https://doi.org/10.1016/j.eiar.2021.106659
[23] Wu, C., Pan, H., Luo, Z., Liu, C., Huang, H. (2024). Multi-objective optimization of residential building energy consumption, daylighting, and thermal comfort based on BO-XGBoost-NSGA-II. Building and Environment, 254: 111386. https://doi.org/10.1016/j.buildenv.2024.111386
[24] Ohene, E., Chan, A.P., Darko, A. (2022). Review of global research advances towards net-zero emissions buildings. Energy and Buildings, 266: 112142. https://doi.org/10.1016/j.enbuild.2022.112142
[25] Chaturvedi, P.K., Kumar, N., Lamba, R. (2024). Identification of climate adaptive multivariate optimization methodologies for the design of NZEB in India: A holistic review. Frontiers in Energy Efficiency, 2: 1430647. https://doi.org/10.3389/fenef.2024.1430647
[26] Lynch, J., Serrenho, A.C. (2023). What really matters to reduce the energy demand of household electronics? Global sensitivity analysis of circular economy strategies for the United Kingdom. Journal of Cleaner Production, 432: 139746. https://doi.org/10.1016/j.jclepro.2023.139746
[27] Tete, K.H., Soro, Y.M., Sidibé, S.S., Jones, R.V. (2023). Urban domestic electricity consumption in relation to households’ lifestyles and energy behaviours in Burkina Faso: Findings from a large-scale, city-wide household survey. Energy and Buildings, 285: 112914. https://doi.org/10.1016/j.enbuild.2023.112914
[28] Tanoto, Y., Praptiningsih, M. (2013). Factors decomposition of Indonesia’s household electricity consumption. Engineering Journal, 17(2): 19-28. https://doi.org/10.4186/ej.2013.17.2.19
[29] Osiolo, H.H. (2017). Willingness to pay for improved energy: Evidence from Kenya. Renewable Energy, 112: 104-112. https://doi.org/10.1016/j.renene.2017.05.004
[30] Loaiza-Ramírez, J.P., Reimer, T., Moreno-Mantilla, C.E. (2022). Who prefers renewable energy? A moderated mediation model including perceived comfort and consumers’ protected values in green energy adoption and willingness to pay a premium. Energy Research & Social Science, 91: 102753. https://doi.org/10.1016/j.erss.2022.102753
[31] Dolšak, J., Hrovatin, N., Zorić, J. (2020). Factors impacting energy-efficient retrofits in the residential sector: The effectiveness of the Slovenian subsidy program. Energy and Buildings, 229: 110501. https://doi.org/10.1016/j.enbuild.2020.110501
[32] Bresa, A., Zakula, T., Ajdukovic, D. (2023). A framework to predict the willingness and influencing factors of building occupants to interact with advanced control systems in buildings. Energy Reports, 10: 4078-4086. https://doi.org/10.1016/j.egyr.2023.10.071
[33] Rachmawati, F., Soemitro, R.A., Adi, T.J.W., Susilawati, C. (2015). Low-cost apartment program implementation in Surabaya metropolitan area. Procedia Engineering, 125: 75-82. https://doi.org/10.1016/j.proeng.2015.11.012
[34] Nugrahanti, F.I., Kubota, T., Larasati, D., Trihamdani, A.R., Morita, K., Inoue, H. (2020). Low carbon affordable apartments in hot-humid climate of Indonesia: Design concept of the full-scale experimental house. In EduARCHsia & Senvar 2019 International Conference (EduARCHsia 2019), Atlantis Press, pp. 90-96. https://doi.org/10.2991/aer.k.200214.013
[35] Larasati, D., Hanifah, Y., Nugrahanti, F.I., Rahmadyani, H., Muchlis, A.F. (2020). Rethinking about low carbon emission in apartment design: Lesson learned from the construction of an experimental house. In 3rd International Conference on Dwelling Form (IDWELL 2020), Atlantis Press, pp. 72-80. https://doi.org/10.2991/assehr.k.201009.008
[36] Larasati, D., Asawa, T., Ferels, A., Aisha, H., Hanifah, Y. (2025). Enhancing low-cost apartment performance: A comparative study on passive design implementation. International Journal on Advanced Science, Engineering and Information Technology, 15(3): 669-679. https://doi.org/10.18517/ijaseit.15.3.20462
[37] Njo, A., Valentina, G., Basana, S.R. (2021). Willingness to pay for green apartments in Surabaya, Indonesia. Journal of Sustainable Real Estate, 13(1): 48-63. https://doi.org/10.1080/19498276.2022.2036427
[38] Pangaribuan, E., Yuniaristanto, Y., Zakaria, R. (2023). Development of green housing willingness to pay conceptual model on Jabodetabek Community. Jurnal Teknik Industri: Jurnal Keilmuan dan Aplikasi Teknik Industri, 25(1): 97-110. https://doi.org/10.9744/jti.25.1.97-110
[39] Kim, J.H., Kim, H.J., Yoo, S.H. (2018). Consumers’ willingness to pay for net-zero energy apartment in South Korea. Sustainability, 10(5): 1564. https://doi.org/10.3390/su10051564
[40] Albattah, M., Attoye, D.E. (2021). A quantitative investigation on awareness of renewable energy building technology in the United Arab Emirates. Sustainability, 13(12): 6665. https://doi.org/10.3390/su13126665
[41] Nketiah, E., Song, H., Adu-Gyamfi, G., Obuobi, B., Adjei, M., Cudjoe, D. (2022). Does government involvement and awareness of benefit affect Ghanaian's willingness to pay for renewable green electricity? Renewable Energy, 197: 683-694. https://doi.org/10.1016/j.renene.2022.07.139
[42] Al Mamun, A., Rahman, M.K., Masud, M.M., Mohiuddin, M. (2023). Willingness to pay premium prices for green buildings: Evidence from an emerging economy. Environmental Science and Pollution Research, 30(32): 78718-78734. https://doi.org/10.1007/s11356-023-27998-9
[43] Piselli, C., Salvadori, G., Diciotti, L., Fantozzi, F., Pisello, A.L. (2021). Assessing users’ willingness-to-engagement towards Net Zero Energy communities in Italy. Renewable and Sustainable Energy Reviews, 152: 111627. https://doi.org/10.1016/j.rser.2021.111627
[44] Cai, T., Choong, W.W., Wee, S.C., Xu, T. (2025). Urban residents’ intention to purchase green buildings in China’s emerging first-tier cities: A multigroup analysis. Energy and Buildings, 344: 116031. https://doi.org/10.1016/j.enbuild.2025.116031
[45] Brounen, D., Kok, N., Quigley, J.M. (2013). Energy literacy, awareness, and conservation behavior of residential households. Energy Economics, 38: 42-50. https://doi.org/10.1016/j.eneco.2013.02.008
[46] Golbazi, M., El Danaf, A., Aktas, C.B. (2020). Willingness to pay for green buildings: A survey on students’ perception in higher education. Energy and Buildings, 216: 109956. https://doi.org/10.1016/j.enbuild.2020.109956
[47] Zhang, L., Yang, X., Fan, Y., Zhang, J. (2021). Utilizing the theory of planned behavior to predict willingness to pay for urban heat island effect mitigation. Building and Environment, 204: 108136. https://doi.org/10.1016/j.buildenv.2021.108136