Fitri Eriyanti* | Ory Riandini | Zikri Alhadi | Rahmadani Yusran
© 2026 The authors. This article is published by IIETA and is licensed under the CC BY 4.0 license (http://creativecommons.org/licenses/by/4.0/).
OPEN ACCESS
Municipal disaster planning requires preventive investment to address not only physical and environmental risks but also the community capacities needed to sustain preparedness, participation, and local resilience. This study examines how community capacity is integrated into preventive investment and policy coherence within the Payakumbuh Disaster Management Plan 2025–2029. A single-coder exploratory policy audit used descriptive content counts and an NVivo 14-compatible matrix-coding workflow. Screening 94 source-table rows excluded seven non-analyzable entries, leaving 87 activity/data rows for coding and budget aggregation. Multi-coding identified physical infrastructure and services in 39 rows, preparedness and emergency capability in 37, information and knowledge in 30, environmental and spatial regulation in 24, community capacity and participation in 17, and monitoring and accountability in eight. Community-related mechanisms therefore covered only 19.5% of analyzable actions, suggesting that social capacity is less explicitly represented in the plan than infrastructure, preparedness, and information-oriented interventions. The five-year indicative portfolio totalled IDR 45.5225 billion, with 37.6% allocated to comprehensive disaster services, 31.3% to watershed quality, 19.9% to surface-water management, 5.9% to environmental management, and 5.2% to natural-resource and land-use control. The audit suggests plausible preventive functions alongside weaker documentary integration of community capacity, monitoring, outcome indicators, and joint budget accountability. Fiscal scale does not establish preventive effectiveness. The study proposes a traceability test and an audit scorecard to connect risk drivers, community capacity, financial allocation, institutional responsibilities, and measurable outcomes. These proposals require independent and cross-case validation before broader application.
preventive investment, policy coherence, disaster risk governance, community capacity, municipal disaster planning
Disaster-related losses are influenced by various development decisions made prior to the disaster event itself. Factors such as land-use change, drainage system design, watershed degradation, building controls, and the distribution of public services all shape levels of exposure and vulnerability [1-3]. Consequently, sustainable development planning must treat disaster risk reduction as a core investment criterion rather than merely an ad-hoc emergency program [4-6]. The Sendai Framework reinforces this paradigm shift by encouraging risk-informed public and private sector investments and strengthening disaster risk governance [7, 8].
The practical challenge lies not in a lack of plans. Many local governments already possess hazard assessment documents, long-term strategies, and activity matrices; however, budget allocations often remain fragmented across various sectoral agencies. Preventive measures are frequently difficult to pinpoint because they are dispersed across diverse fields such as public works, the environment, spatial planning, water resources, education, and social protection. In contrast, emergency response expenditures are highly visible and carry significant political urgency. Therefore, transformative climate and disaster financing requires a method to verify whether the spending portfolio within a plan genuinely addresses the risk drivers identified in that plan’s risk analysis [9, 10].
In this context, coherence implies that risk evidence, objectives, programs, funding, institutional responsibilities, and indicators form a traceable cause-and-effect chain. Vertical coherence links frameworks across national, provincial, and district/city levels. Horizontal coherence connects disaster management with policies on spatial planning, the environment, infrastructure, and social affairs. Internal coherence aligns the findings of the plan's risk analysis with the activities that are funded and whose success is measured. A plan may appear vertically aligned in terms of its narrative, yet remain internally incoherent if high-priority risks receive only minimal budget allocations or if the indicators used fail to demonstrate whether risk levels have decreased [11-13].
Decentralization places significant responsibilities close to the community; however, local governments often face limited fiscal space, sectoral budgeting constraints, and a reliance on higher-level infrastructure decisions [14-17]. These conditions make priority setting essential. The question is not merely whether every desired activity appears on a list, but rather whether limited resources are aggregated into a portfolio of preventive actions characterized by clear causal logic and local ownership.
The need for a portfolio perspective is reinforced by research on resilience and implementation. Resilience capacity develops through interconnected institutional, financial, and learning systems rather than through isolated projects; meanwhile, international experience demonstrates that implementing the Sendai Framework relies on sustained governance and investment [18-20].
Payakumbuh was selected as an information-rich case for an exploratory audit of plan design. The city’s disaster management plan for the 2025–2029 period identifies floods, flash floods, extreme weather, earthquakes, and droughts as priority hazards. The city’s disaster risk index remained at 108.40 from 2018 to 2022, while its resilience index was recorded as low at -0.27 in 2022. The disaster management plan also identifies drainage, watershed conditions, surface water management, land-use change, environmental quality, preparedness, and information as strategic issues [21]. The document integrates risk diagnosis, program structure, institutional mapping, targets, and a five-year indicative budget into a unified framework. This combination makes it possible to trace proposed actions across policy and financial components within one planning period. Case selection therefore rests on analytical suitability and documentary detail, rather than an assumption that Payakumbuh represents Indonesian municipalities generally.
Previous studies conducted by members of the research team have examined local wisdom, tsunami contingency planning, and hazard-specific governance in other parts of West Sumatra [22, 23]. This study differs in terms of location, empirical data, research questions, and final outcomes: it constitutes a coherence audit of multi-hazard investment portfolios at the city level. The central question is: To what extent do these plans coherently translate risk evidence into preventive investments? The objective is to assess the portfolios against strategic goals, examine the traceability from issues to budgets and indicators, and propose an auditable scorecard procedure for evaluating city-level plans. Replicability refers to the explicit analytical steps; consistent results across coders, cities and planning periods remain to be tested.
Adaptive governance provides the learning logic for such audits [24-27]. Resilience scorecards and post-flood assessments demonstrate why outputs must be linked to distributive and functional outcomes [28-31]. Participatory risk frameworks, studies on Sendai implementation, community-based governance, and local empowerment increasingly show that institutional legitimacy and implementation capacity determine the value of technical investments [32-35].
Conceptually, preventive investment extends beyond mere capital expenditure prior to a disaster [36-39]. It encompasses regulatory decisions to avoid exposure to new risks, environmental measures that reduce hazard intensity, infrastructure that enhances service reliability, preparedness measures that manage residual risk, and information systems that support timely adjustments. These mechanisms entail varying cost structures and time horizons. Low-cost permitting or maintenance functions can yield greater impact than high-profile construction projects, whereas expensive assets may result in only limited risk reduction if poorly sited or lacking routine maintenance. Therefore, portfolio assessments must compare causal functions rather than simply budget magnitudes.
A coherence-based perspective also helps avoid misguided choices between structural and non-structural measures. Watershed rehabilitation, drainage and retention systems, early warning mechanisms, land-use controls, and community preparedness can form complementary layers, provided their objectives and implementation sequences are clearly defined [40, 41]. Conversely, these components become fragmented when individual departments report completion based solely on standalone outputs. Internal coherence concerns the linkages between these layers: whether upstream conditions inform infrastructure design, whether maintenance data factors into budget decisions, whether warning systems are tested against vulnerable locations, and whether post-disaster lessons are used to revise prevention priorities. Thus, this article views the portfolio of actions as a policy system. Its empirical contribution lies not in ranking departments or predicting disaster-related losses, but rather in a structured audit of whether risk evidence has been translated into mechanisms, funding, institutional ownership, and indicators capable of sustaining prevention efforts. Combining directed coding with budget analysis brings both aspects into sharp focus: NVivo-compatible coding identifies the distribution of prevention mechanisms, while financial analysis examines their scale and timing. Integrating these approaches enables a more rigorous and in-depth assessment than relying solely on activity counts or total expenditure.
2.1 Research design, evidence preparation and coding
This study is reported as a single-coder exploratory audit of municipal plan design, combining qualitative policy analysis with descriptive content counts and indicative-budget summaries. The data corpus comprises hazard and vulnerability tables, baseline data on disaster risk and resilience, strategic issue rankings, objectives, program architecture, institutional task allocation, a detailed action-plan table containing 94 source rows before screening, and a five-year indicative budget. This research does not treat planned activities as realized outcomes.
A structured extraction sheet was used to record for each action row the strategic objective, activity, official sub-activity nomenclature, output indicators, priority locations, responsible and supporting institutions, annual targets, and annual budgets. Empty cells were treated as indicating no allocation for that year, rather than as evidence of unrecorded, unplanned expenditure.
Rows were selected as the primary unit of analysis because they preserve the linkages between actions, indicators, institutions, timeframes, and financial aspects. Where a single row in the printed document spanned multiple lines of text, the entries were merged prior to coding. The source table contained 94 rows before screening. Seven entries, including headings, objective or target-group labels and entries without sufficiently specified activity or budget fields, were not retained as separate analyzable actions, leaving 87 activity/data rows. These 87 lines cover both the mechanism coding corpus and the total lines; the number 94 indicates the source, not the denominator of the coding. The exception process is performed before coding and documented in an audit trail. Contextual labels are retained for interpretation purposes without being counted as additional measures.
Budget standardization was performed prior to the aggregation stage. Decimal points and commas were interpreted according to Indonesian notation and unit labels within the plan; the budget columns were interpreted in millions of IDR, as specified in the header notes. The five annual values for each retained row were summed, and the resulting row totals were aggregated into five mutually exclusive strategic objectives. Budget shares use IDR 45,522.5 million as the denominator; multiple mechanism codes do not duplicate a row’s budget across these objective totals. The final portfolio value of IDR 45,522.5 million was verified by cross-referencing it with the objective subtotals and annual grand totals. Percentages and combined shares were calculated from unrounded monetary values and rounded to one decimal place for presentation. The five displayed objective shares sum to 99.9% because of independent rounding, while the unrounded total is 100.0%. No conversion to actual expenditure data was performed, as the document contains indicative allocations.
The evidence base encompasses both financial and non-financial provisions; however, this analysis does not assume that larger allocations reflect superior policies. Regulatory, informational, and coordination mechanisms may require relatively small direct expenditures yet determine the effectiveness of large-scale capital programs. Conversely, while large-budget actions may be necessary, they are insufficient if aspects such as maintenance, enforcement, or beneficiary coverage are not addressed. Preventive function is assessed from the stated action, risk driver, indicator and institutional role independently of budget size; the allocation then describes fiscal scale. The portfolio includes preparedness, response and recovery-related services, so its full value is not an estimate of exclusively preventive expenditure. Proportionality is considered alongside traceability, readiness, and sustainability, rather than serving as a standalone benchmark for efficiency or evidence of risk reduction.
Six parent nodes represented policy mechanisms. The definitions were designed to prevent broad disaster-related terminology from inflating the counts for preventive measures. Physical infrastructure and services entail assets, facilities, construction, rehabilitation, or operational services with specific risk-related functions. Environmental and spatial regulations encompass ecosystem management, permitting, land-use control, and environmental assessment and restoration. Emergency preparedness and capabilities cover warnings, contingency planning, drills, response readiness, and recovery capabilities. Information, research, and knowledge entail data, mapping, studies, communication, or learning products. Community capacity and participation include empowerment, local organization, training, or inclusive engagement. Monitoring and accountability require evaluation, audits, compliance reviews, reporting, or corrective follow-up.
A row could be assigned to several nodes when its policy mechanism was genuinely composite. Drainage construction accompanied by community maintenance, for example, could contain infrastructure and community-capacity elements. Multiple coding was not used merely because several keywords appeared. The action description, indicator, institutional assignment and target were read together to establish function. Each row contributed no more than one reference to a particular node, which prevents repetition within a long activity description from increasing frequency. This rule produces 155 node assignments across 87 distinct rows. Node coverage percentages are not additive, and the total number of assignments is not an alternative sample size.
The analytical sequence used an NVivo 14-compatible workflow for source classification, directed coding, node frequency summaries, node coverage, node-by-objective matrices, and budget profile queries. Text searches identified candidate passages, but code assignments were based on complete rows and their indicators. Four empirical displays report mechanism frequency, mechanism coverage, objective budget share and the annual indicative budget profile. Coverage is the number of distinct rows assigned to a node divided by the 87 retained rows, multiplied by 100. Coded reference matrices and budget calculations were cross-checked in an editable spreadsheet, maintaining a row-level audit trail. Together, these displays inform an interpretive pathway linking risk evidence, policy objectives, actions, annual finance, outcome indicators and adaptive review; that pathway is a synthesis of the audit, not an independently validated model.
Interpretive validity was supported by matrix triangulation: a finding required support from at least two plan components, such as a diagnosed issue and a funded action, or a strategic objective and an indicator. Contradictions were recorded rather than resolved through assumptions. This remains a single-coder exploratory audit. No independent recoding, inter-coder agreement rate or kappa coefficient is available; spreadsheet checks and rereading assess internal consistency but do not establish inter-coder reliability. Counts and percentages describe this coder’s classification of this document, not statistical estimates, tested differences between mechanisms or measures of program effectiveness. Small differences in frequency should therefore not be interpreted as robust rankings.
The four NVivo-informed displays answer different questions. Frequency asks how often a mechanism occurs; coverage expresses that same frequency as a percentage of the retained corpus; budget share asks which strategic objectives command financial weight; and the annual profile asks when the portfolio is concentrated. Frequency and coverage are two expressions of the same coding result, not independent corroboration. Coding, budget share and timing cannot be collapsed into a single score without concealing important differences. Monitoring can have low coverage but high leverage, while watershed rehabilitation can involve few rows and a large budget. Interpretation therefore focuses on alignment among mechanism presence, fiscal scale and continuity rather than expecting parallel rankings.
Verification combined arithmetic reconciliation and source tracing. Objective subtotals were reconciled with the portfolio total; annual subtotals were reconciled with the same total; every node frequency was checked against the source-by-node matrix; and displayed percentages were recalculated using the stated denominators. Selected high- and low-frequency rows were then reread to confirm that their contextual function matched the codebook. The procedure supports auditability, although it does not substitute for independent recoding or evidence about implementation.
2.2 Policy-coherence tests
The assessment used four tests. Traceability examined whether each strategic problem led to a corresponding objective, program, activity, funded subactivity and indicator. Proportionality compared the distribution of finance with the severity and persistence of risks. Implementation readiness tested whether activities had an official nomenclature, lead institution, target and budget. Sustainability examined whether the stated mechanisms addressed underlying environmental and institutional drivers rather than only emergency capability. These are qualitative documentary tests, not a validated composite index or a causal evaluation. Table 1 sets out the pass conditions and warning signs used to appraise the portfolio; its sustainability condition is interpreted as an intended causal pathway, not an observed reduction in risk.
The criteria distinguish a coherent preventive portfolio from one that merely lists activities: funded actions must remain traceable to risk drivers, institutionally ready and oriented toward sustained risk reduction.
Table 1. Operational policy-coherence criteria
|
Criterion |
Pass Condition |
Warning Sign |
|
Traceability |
Risk driver → objective → funded activity → indicator |
Listed activity cannot be linked to diagnosis. |
|
Proportionality |
Allocation reflects severity, persistence and leverage |
High-risk driver receives residual or episodic finance. |
|
Readiness |
Owner, nomenclature, annual target and budget are specified |
Responsibility or annual resourcing is blank. |
|
Sustainability |
Portfolio reduces exposure, vulnerability or environmental drivers |
Portfolio is dominated by response capacity. |
3.1 Exploratory coding suggested an implementation-heavy portfolio
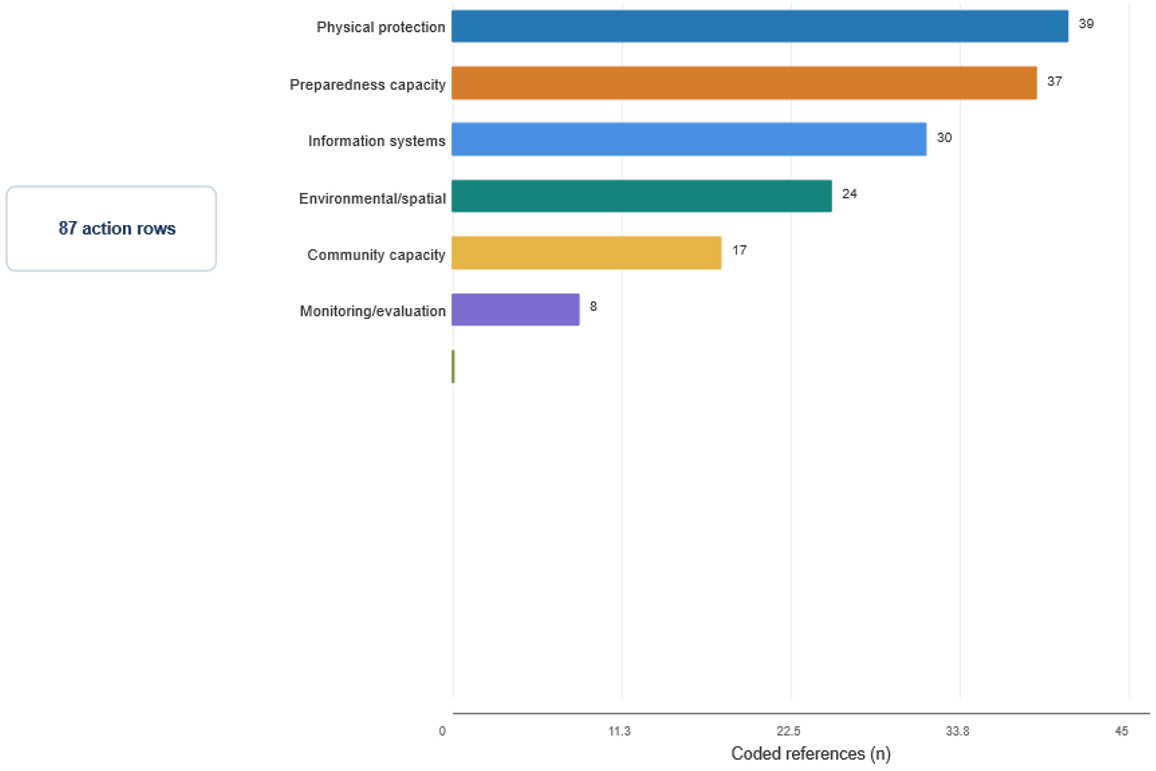
Following the coding and calculation procedure in Section 2.1, Figures 1-4 present mechanism frequency, normalized coverage, five-year objective budget shares, and the annual indicative budget profile. This diagnostic set combines single-coder content summaries with budget aggregation; the budget displays are not independent validation of the coding. Frequency describes the occurrence of each mechanism across the 87 analyzable action rows, rather than implementation effectiveness. Figure 1 provides the descriptive mechanism profile used alongside the financial summaries.
Figure 1 shows that physical protection was coded in 39 action rows and preparedness capacity in 37, followed by information systems in 30, environmental and spatial mechanisms in 24, community capacity in 17 and monitoring and evaluation in only eight. Within this coding, asset delivery and preparedness occur more often than formal feedback mechanisms. The two-row difference between infrastructure and preparedness is descriptive and should not be treated as a reliable ranking. This pattern does not imply that infrastructure or preparedness is excessive; it suggests a documentary imbalance between delivery-oriented mechanisms and the evaluative functions needed to verify risk reduction.
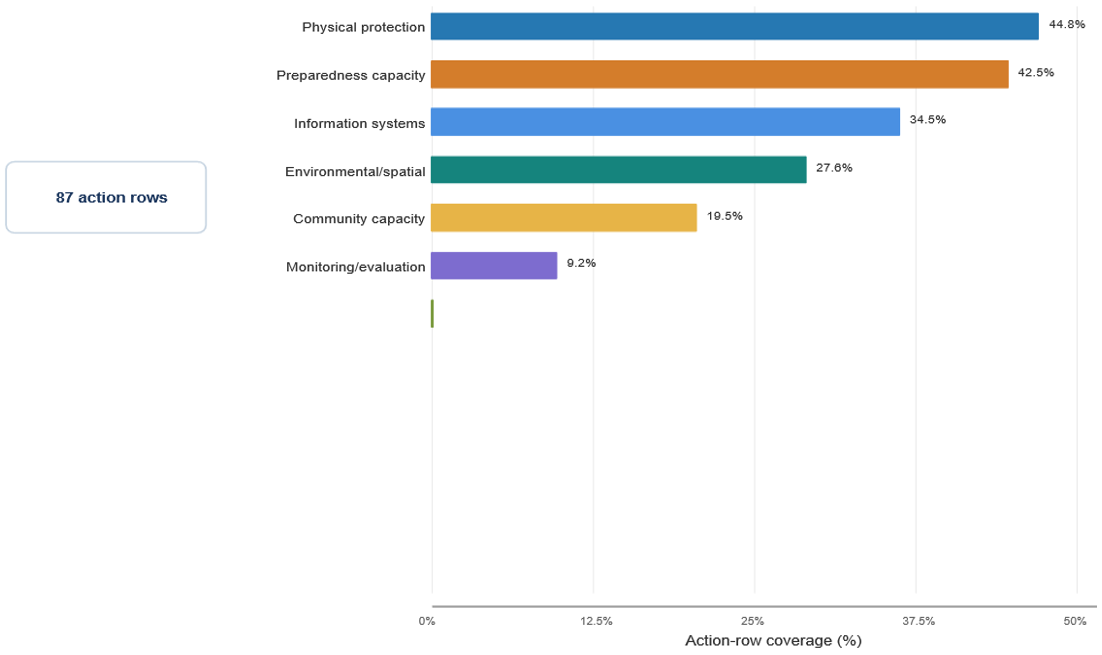
To express coding frequency relative to the corpus, the second display normalizes each mechanism against the 87 action rows. Multi-coding was permitted, so coverage values show how widely a mechanism is distributed across the portfolio and are not additive. Figure 2 compares their documented coverage; it does not measure the depth or quality of implementation and learning.
Figure 1. Preventive-investment mechanism frequency across the 87 analyzable action rows
Figure 2. Preventive-investment mechanism coverage across the 87 analyzable action rows
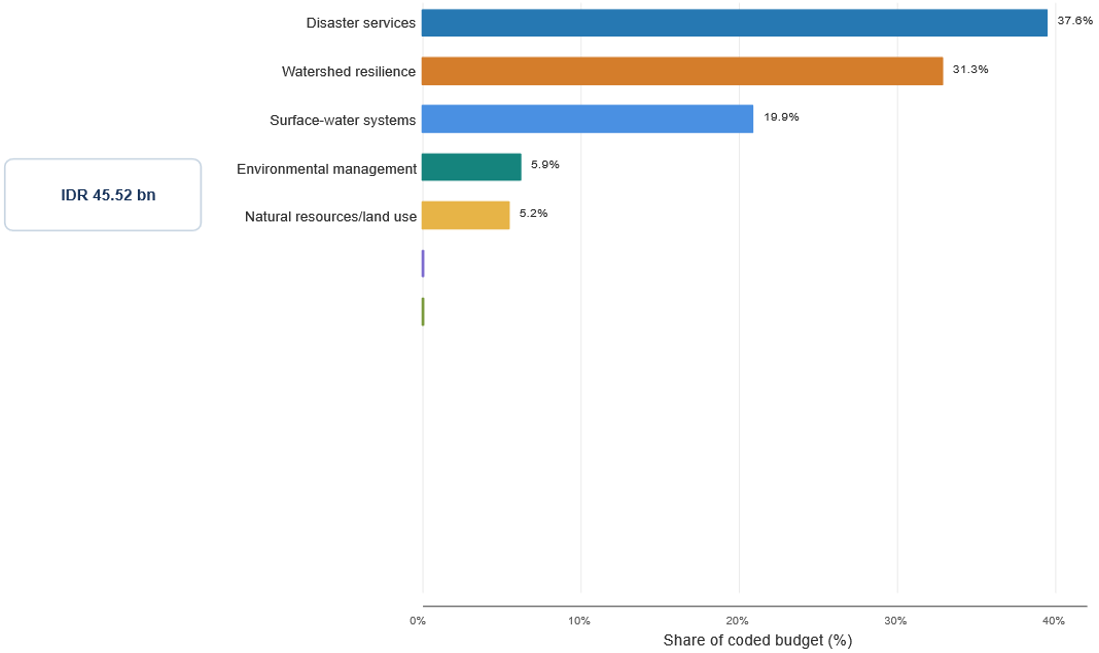
Figure 3. Five-year preventive budget shares derived from the coded action portfolio
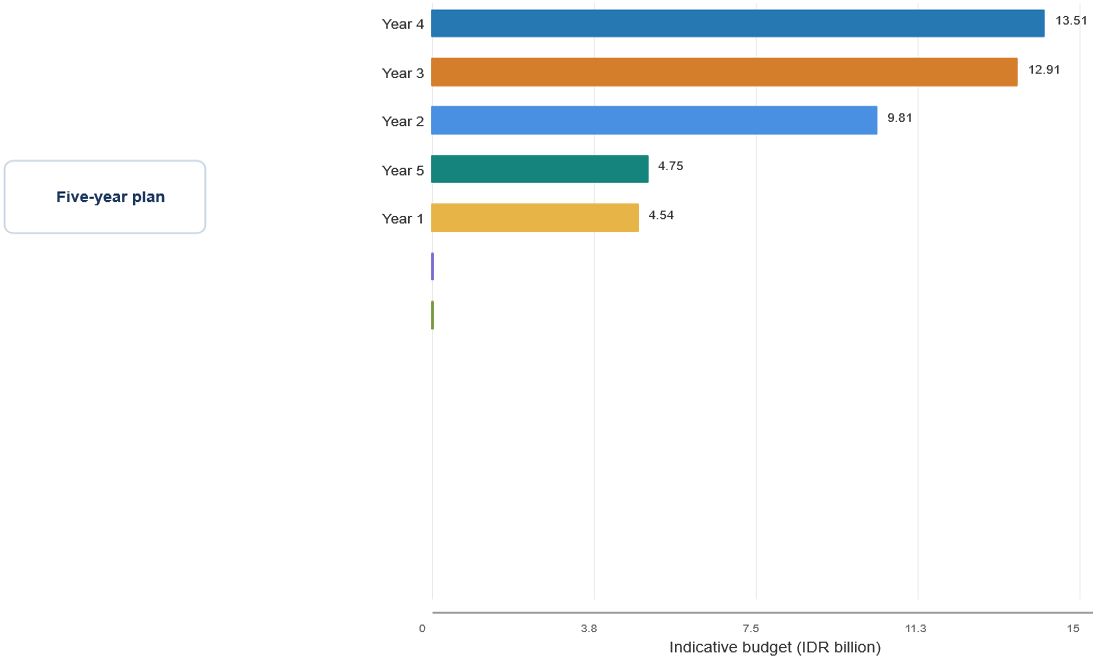
Figure 4. Annual indicative preventive budget profile across the five-year plan
Figure 2 restates the exploratory coding pattern as coverage percentages. Physical protection covered 44.8% of action rows, preparedness capacity 42.5%, information systems 34.5%, environmental and spatial mechanisms 27.6%, and community capacity 19.5%, while monitoring and evaluation covered only 9.2%. The low monitoring share is particularly important for policy coherence because it suggests limited explicit provision for the evidence loop through which completed activities, environmental condition and exposure outcomes should inform subsequent allocation decisions. The counts do not establish whether monitoring is absent or ineffective in practice.
Mechanism presence and fiscal scale require separate interpretation. The indicative budgets of the 87 retained rows were aggregated by the five strategic objectives and divided by the IDR 45.5225 billion total. Figure 3 identifies financial concentration by objective; preventive function must be assessed from the corresponding activities, indicators and risk pathways. In Figure 3 and Figure 4, “preventive” identifies the portfolio’s analytical focus, not a claim that every included IDR is exclusively preventive or that planned spending has reduced risk.
Figure 3 shows that disaster services received 37.6% of the coded five-year portfolio, watershed resilience 31.3% and surface-water systems 19.9%. Environmental management accounted for 5.9% and natural-resource and land-use governance 5.2%. The two water-related objectives therefore represented 51.2% of the portfolio, showing fiscal concentration in objectives with plausible preventive functions. The 51.2% allocation share does not establish the preventive effectiveness of the activities. At the same time, environmental management and land-use governance together received 11.2%, calculated from their combined unrounded allocation of IDR 5,087.5 million. Their contribution depends on continuity, enforcement and institutional quality rather than financial scale alone.
The final empirical display adds a temporal dimension to policy coherence. Annual totals were aggregated from the coded action budgets to describe whether indicative allocations are sequenced continuously across the five-year planning horizon or concentrated in a limited delivery window. Figure 4 presents this annual indicative budget profile.
Figure 4 indicates that the portfolio rises from IDR 4.54 billion in Year 1 to IDR 9.81 billion in Year 2, IDR 12.91 billion in Year 3 and a peak of IDR 13.51 billion in Year 4, before falling to IDR 4.75 billion in Year 5. The concentration in Years 3-4 may reflect a capital-delivery phase but presents a potential continuity risk if monitoring, maintenance, enforcement and community capability are not protected after major investments are completed. The annual values are shown rounded to two decimal places in billions; the portfolio total retains its original precision. Taken together, Figures 1-4 suggest plausible preventive functions alongside limited explicit monitoring coverage and unevenly timed allocations; they do not demonstrate implementation capacity or preventive effectiveness.
The four displays should be read as a connected descriptive diagnostic. Figures 1 and 2 summarize the same coding pattern: infrastructure, preparedness and information appear more frequently than community capacity or monitoring. Figure 3 describes fiscal concentration, particularly in watershed and surface-water objectives, while Figure 4 shows the timing of indicative finance. These dimensions need not rank mechanisms similarly. Their joint interpretation suggests where documentary links between activities, finance and continuity need closer examination; financial scale cannot validate the preventive function assigned to an action.
A second cross-display finding is the difference between row frequency and fiscal intensity. Watershed quality contains only three retained activity/data rows but receives 31.3% of total finance, indicating a small number of high-value interventions. Monitoring and accountability appears in eight rows but cannot be matched to a similarly visible protected allocation. This contrast illustrates why activity counts cannot be interpreted as budget priority and why budget priority cannot be interpreted as institutional completeness. High-value assets intensify the need for monitoring because failure, delay or weak maintenance places a larger share of the preventive portfolio at risk. This is a potential exposure of planned resources, not an observed estimate of losses or performance.
The stated functions of water-related activities are plausibly aligned with the plan's flood, flash-flood, drought and watershed concerns; their 51.2% share describes fiscal scale. The portfolio's risk logic still depends on complementary measures. Drainage and rehabilitation can address physical and ecological processes, but land-use control must avoid new exposure, waste services must protect hydraulic function, information systems must identify changing conditions, and preparedness must manage residual risk. The relatively small allocations to environmental and land-use objectives are not necessarily deficiencies; their coherence depends on whether regulatory actions are continuous, enforceable and connected to investment decisions.
The annual profile adds a governance implication. Years 3 and 4 together contain the largest share of indicative finance, while Year 5 returns close to the initial level. If the peak represents planned capital delivery, a lower final year may be reasonable. It becomes a continuity risk when the plan does not separately identify operation, maintenance, enforcement, community engagement and learning costs after the assets are established. The profile therefore calls for lifecycle classification rather than a presumption that every late-plan decline is underinvestment.
Overall, the exploratory audit suggests that the plan links risk evidence to a sectorally diversified set of actions with plausible preventive functions and specified indicative allocations. Documentary links are less complete at the interfaces needed to assess whether those actions reduce risk: outcome indicators, recurrent monitoring, joint budget accountability and adaptive reallocation. The subsequent sections examine this interpretation against baseline risk, objective-level allocations, traceability and temporal continuity; it remains an appraisal of plan design rather than demonstrated performance.
3.2 Risk evidence demanded a preventive portfolio
The plan’s baseline establishes a strong prevention rationale. The disaster risk index did not change between 2018 and 2022. The resilience index rose from 0.23 to 0.27 but remained low, and all seven resilience priorities were classified as low capacity. Flash flood, extreme weather and earthquake were high-risk hazards; flood and drought were medium risk with increasing tendencies; and the plan treated multiple hazards as a high-risk condition. Potential losses were largest for earthquake and extreme weather, while drought, flood and flash flood had explicit environmental damage footprints.
The strategic problem ranking reinforced this diagnosis. Suboptimal environmental management received the highest score, followed by natural-resource management, incomplete preparedness and emergency systems, surface-water planning, watershed management, community risk knowledge and spatial planning. This ranking broadens the meaning of prevention. It includes environmental licensing, land-use enforcement, watershed rehabilitation, water retention, drainage, waste management, safe buildings, warning systems and community capability. A coherent budget should therefore be distributed across sectors while retaining a visible link to shared risk outcomes. Table 2 condenses the principal baseline signals into the investment implications they create for prevention, institutional capacity and adaptive review.
Table 2. Selected baseline signals and planning implications
|
Evidence |
Value or Status |
Implication for Investment |
|
Disaster risk index, 2018–2022 |
108.40 each year; medium |
Existing effort did not change the aggregate trajectory. |
|
Regional resilience index, 2022 |
0.27; low |
Institutional and preparedness capacity requires sustained finance. |
|
High-risk priority hazards |
Flash flood, extreme weather, earthquake |
Combine structural, environmental and preparedness measures. |
|
Increasing tendencies |
Flood, extreme weather, drought, landslide |
Use adaptive annual review and leading indicators. |
|
Highest-ranked strategic issue |
Environmental management; score 19.71 |
Prevention must extend beyond the disaster agency. |
The baseline signals collectively justify a diversified preventive portfolio: persistent risk and low resilience require structural, environmental and preparedness investments to be complemented by continuous monitoring and cross-sector governance.
3.3 The budget profile concentrated resources in water-related objectives
The 87 retained activity/data rows from the 94-row source table contained a five-year indicative portfolio of IDR 45.5225 billion, as reported in Table 3. Comprehensive disaster services received IDR 17.135 billion (37.6%). Watershed quality received IDR 14.250 billion (31.3%), surface-water management IDR 9.050 billion (19.9%), environmental management IDR 2.7025 billion (5.9%), and control of natural-resource exploitation and land use IDR 2.385 billion (5.2%). Together, the two water-related objectives represented 51.2% of the portfolio. Their stated rehabilitation, drainage, retention and water-management functions indicate a planning scope extending beyond response; their budget share alone does not establish a strong preventive commitment or achieved risk reduction.
The largest individual commitments were associated with watershed rehabilitation. Other recurring investments included waste-management infrastructure and source separation, drainage and irrigation, green/open areas, early warning, operations control, contingency planning, community capability and building or spatial oversight. This mixture is consistent with integrated disaster risk management and with evidence that local flood management must cross administrative and sectoral silos [42-46].
Nevertheless, proportionality cannot be judged from percentage alone. Environmental management received only 5.9%, although it was the highest-ranked strategic problem. Some of its activities-strategic environmental assessment, licensing oversight and waste behaviour—are relatively inexpensive regulatory interventions, so a low share is not automatically incoherent. The relevant question is whether these low-cost actions are sufficiently continuous and enforceable. The plan’s budget columns sometimes fund one-off document preparation without a recurring compliance or enforcement cycle.
Table 3 disaggregates the five-year indicative portfolio by strategic objective so that fiscal scale can be read alongside the stated prevention logic of the activities, without treating allocation size as proof of preventive function.
Table 3. Five-year indicative budget by strategic objective
|
Strategic Objective |
Rows |
IDR Million |
Share |
Primary Prevention Logic |
|
Environmental management |
12 |
2,702.5 |
5.9% |
Waste, environmental assessment and compliance |
|
Natural resources and land use |
15 |
2,385.0 |
5.2% |
Reforestation, licensing and spatial control |
|
Comprehensive disaster services |
39 |
17,135.0 |
37.6% |
Preparedness, warning, mitigation and recovery capability |
|
Surface-water management |
18 |
9,050.0 |
19.9% |
Retention, drainage, irrigation and water availability |
|
Watershed quality |
3 |
14,250.0 |
31.3% |
Watershed and river-corridor rehabilitation |
|
Total |
87 funded/data rows* |
45,522.5 |
100.0% |
Integrated portfolio |
The allocation profile identifies a large water-related share, while the activity descriptions provide the separate basis for interpreting preventive potential. Smaller regulatory and environmental allocations likewise require assessment through continuity, enforceability and intended outcomes rather than expenditure share alone.
The objective totals also reveal different forms of fiscal concentration. Comprehensive disaster services spread IDR 17.135 billion across 39 rows, whereas watershed quality concentrates IDR 14.250 billion in only three rows. The former therefore represents a diverse service portfolio whose preventive content must be identified at subactivity level; the latter represents a large indicative allocation to ecological interventions whose performance would depend on location, design and long-term condition. These patterns require different accountability strategies. A broad portfolio needs risk tagging to prevent response-oriented items from obscuring prevention, while concentrated investment needs milestone, survival and functional-outcome monitoring.
Surface-water management occupies an intermediate position: 18 rows and 19.9% of finance. Its coherence rests on the relationship among retention, drainage, irrigation, water availability and maintenance. These functions can jointly reduce flood and drought risk, but they can also transfer water problems between locations when planned separately. Spatially referenced indicators are therefore more informative than citywide construction totals. The relevant evidence includes drainage functionality, retention performance, sediment and waste blockage, service continuity and the exposure of downstream neighbourhoods.
Environmental management and natural-resource or land-use control together receive 11.2% of the portfolio. Their potential leverage lies in avoiding future risk, influencing development permissions and protecting the environmental systems on which physical investment depends. Their weak point is not necessarily allocation size but the difficulty of observing regulatory effect. A completed assessment, socialisation event or inspection report does not show whether harmful development was modified, violations were corrected or river and watershed pressure declined. These objectives consequently need decision and compliance indicators that can be connected to the risk-tagged budget.
3.4 Traceability was stronger for infrastructure than for governance outcomes
Drainage problems led to surface-water objectives, named construction or management activities, responsible public works or related agencies, physical targets and annual budgets. Watershed degradation led to rehabilitation activities and large allocations. Waste leakage and landfill capacity led to facility and community-management actions. These chains make it possible to audit whether an output was delivered.
The plan sought stronger cross-sector coordination, non-government contributions and risk-informed development. Yet indicators often counted documents, participants, units or reports. Such outputs are useful but do not reveal whether permits became safer, budget decisions changed, warnings reached vulnerable groups or departmental conflicts were resolved. Similar limitations are identified in resilience scorecard research, which distinguishes activity completion from equitable risk outcomes [47-50].
The gap is particularly important because preventive governance frequently operates through decisions rather than assets. A strategic environmental assessment influences risk only if its findings alter plans and investments. A contingency document matters only if roles, resources and exercises are updated. A database matters only if data are current, interoperable and used. The plan requires an outcome layer above sector outputs.
3.5 Distributed ownership lacked joint budget accountability
The portfolio correctly assigned lead and supporting institutions. Environmental services led waste and environmental program; public works and related bodies led water, drainage and spatial interventions; Regional Disaster Management Agency (RDMA) led disaster services; Regional Development Planning Agency and finance functions appeared in planning and budgeting interfaces. This distribution reflects the real location of authority. However, it also creates a coordination risk: no single department controls the entire preventive chain.
The plan’s evaluation arrangements provide ex ante, mid-term and final review, but the budget matrix remains organised by sectoral subactivity. There is no explicit preventive investment tag, no joint portfolio owner and no rule requiring underfunded risk drivers to be discussed before annual budget approval. Transformative finance literature suggests that resilience requires such institutional mechanisms, not only additional money [51-54]. A risk-tagging system could preserve sector appropriations while allowing the municipality to see the aggregate preventive portfolio.
Vertical alignment was well developed at the level of references to national and provincial plans. Horizontal and internal coherence require more operational devices. A joint screening panel involving Regional Development Planning Agency, Regional Finance Agency, RDMA, Public Works Agency and Environmental Services could test whether proposed annual budgets maintain the five-year risk logic. Non-government actors and universities could scrutinise the evidence without controlling statutory appropriations.
3.6 Temporal distribution and continuity risk
The annual columns revealed another coherence issue: continuity. Some capital and regulatory activities were concentrated in one or two years, while service and preparedness activities recurred. Sequencing can be efficient when an initial assessment precedes construction or when infrastructure is followed by maintenance. The plan did not always state that causal sequence. Blank later-year allocations may therefore mean completion, deferral or a missing maintenance commitment.
Preventive investment produces benefits over different time horizons. Warning equipment can improve readiness quickly but requires recurrent testing and replacement. Watershed rehabilitation develops slowly and requires protection after planting. Drainage construction has an immediate physical output but loses function without inspection and sediment or waste removal. Strategic environmental assessment is periodic, whereas licensing oversight should be continuous. A coherent portfolio must distinguish project completion from service continuity.
This suggests an additional budget classification: establishment, operation, maintenance, enforcement and learning. Every preventive asset or policy should have at least one corresponding continuity line. For example, warning equipment should connect to staff, exercises and communication tests; restored watershed areas should connect to survival and condition monitoring; and new waste infrastructure should connect to collection coverage and behaviour. Such lifecycle costing would make the five-year matrix a sustainability instrument rather than a list of initial expenditures.
The classification can be implemented at action-row level without changing the official account structure. Each preventive action can carry a lifecycle tag identifying whether the annual allocation establishes a capability, operates it, maintains it, enforces a rule or generates learning. One action may receive more than one tag, but the municipality should be able to identify whether every major asset and regulatory commitment has a continuation line. Aggregating these tags would expose portfolios that invest heavily in establishment while leaving operation or enforcement implicit.
A budget line may recur while responsibility for evidence remains unclear. For warning systems, continuity requires technical testing, message protocols, staff readiness and verified reach. For watershed interventions, it requires condition monitoring, protection from renewed disturbance and coordination across boundaries. For drainage, it requires maintenance records linked to rainfall and service disruption. For land-use control, it requires periodic inspection and closure of violations. These examples show that recurrent finance is meaningful only when coupled with an owner and a functional indicator.
A temporal-coherence review before annual budgeting could classify deviations from the five-year profile as completion, rescheduling, substitution or cancellation. Completion should trigger operation and outcome monitoring; rescheduling should identify interim risk controls; substitution should demonstrate equivalent contribution to the same risk objective; and cancellation should disclose the prevention gap. This procedure would allow adaptive finance while preserving the plan's causal logic.
This single-coder exploratory audit examined whether a municipal disaster plan linked risk evidence to coherent preventive investment. In the Payakumbuh plan, watershed and surface-water objectives account for 51.2% of the IDR 45.5225 billion indicative portfolio, while other allocations address environmental management, land use, warning, preparedness and recovery capability. The stated functions of these activities suggest preventive potential and a planning scope extending beyond emergency response. Allocation size does not demonstrate preventive effectiveness, and the mixed portfolio is not a measure of exclusively preventive expenditure. Three documentary weaknesses warrant further attention.
First, the highest-ranked governance and environmental problems were not always connected to recurring enforcement or outcome indicators. Second, distributed sector ownership was not matched by joint budget accountability. Third, activity and document counts could not show whether risk, environmental pressure or warning reach changed. A traceability test and proposed preventive portfolio scorecard offer a structure for examining these weaknesses by linking hazards and drivers to finance, ownership and measurable outcomes.
The findings concern one city, one document and one planning period, and are limited to plan design. They do not establish that allocations were executed or effects achieved. A single-coder interpretation may be sensitive to category boundaries and undocumented provisions; no independent recoding or inter-coder reliability evidence is available. The method’s replicability lies in its stated extraction, coding, denominator and reconciliation rules, whereas the empirical findings are context-specific and cannot be generalized to other municipalities or periods from this case alone. The scorecard is therefore a proposed audit procedure, not a validated comparative index. Subsequent research should test independent coding and application across cities and periods, compare annual budgets and expenditure with indicative allocations, and evaluate observed changes in drainage, watershed condition, preparedness and risk.
The study's principal contribution is therefore an auditable procedure for distinguishing stated preventive functions from documentary coherence, while keeping both separate from fiscal scale and realized outcomes. The row-level method retains the relationship among a risk-reduction mechanism, its institutional owner, timing, financial scale and indicator, while the cross-display interpretation reveals where those relationships weaken. This is methodologically important for local plans whose preventive expenditure is dispersed across environmental, infrastructure, preparedness and social functions and cannot be identified reliably from a single budget label.
The audit suggests that a credible preventive portfolio needs protected feedback capacity. Municipalities should not wait for the aggregate disaster risk index to change before reviewing investment logic. Annual evidence on environmental condition, service functionality, regulatory compliance, preparedness reach and distributional coverage can identify whether the causal chain is holding. When combined with transparent risk tagging and continuity safeguards, that evidence enables adaptive reallocation without allowing urgent or visible expenditure to displace the less visible functions that preserve long-term risk reduction.
The Research Team would like to thank Universitas Negeri Padang for conducting this research.
[1] Bastos Moroz, C., Thieken, A.H. (2024). Urban growth and spatial segregation increase disaster risk: Lessons learned from the 2023 disaster on the North Coast of São Paulo, Brazil. Natural Hazards and Earth System Sciences, 24(9): 3299-3314. https://doi.org/10.5194/nhess-24-3299-2024
[2] Durán, J.D.J.F., Alcántara-Ayala, I. (2026). Recurrent risk and the disaster loop: A forensic approach to urban flooding. International Journal of Disaster Risk Reduction, 134: 106028. https://doi.org/10.1016/j.ijdrr.2026.106028
[3] Fekete, A. (2026). Vertical vulnerability and exposure of people in the context of disaster risk at the building, city and regional level. International Journal of Disaster Risk Reduction, 133: 106020. https://doi.org/10.1016/j.ijdrr.2026.106020
[4] Wen, J.H., Wan, C.C., Ye, Q., Yan, J.P., Li, W.J. (2023). Disaster risk reduction, climate change adaptation and their linkages with sustainable development over the past 30 years: A review. International Journal of Disaster Risk Science, 14(1): 1-13. https://doi.org/10.1007/s13753-023-00472-3
[5] Malešević-Perović, L., Ćorić, B. (2023). Sustainable development and economic disasters. Journal of Cleaner Production. 434: 140043. https://doi.org/10.1016/j.jclepro.2023.140043
[6] Wang, B.C., He, C.P., Guo, Y.H. (2025). Building disaster resilience: A sustainable approach to integrated road rehabilitation and emergency logistics optimization in extreme events. Sustainability, 17(23): 10591. https://doi.org/10.3390/su172310591
[7] Nekoei-Moghadam, M., Moradi, S.M., Tavan, A. (2024). How can the Sendai framework be implemented for disaster risk reduction and sustainable development? A qualitative study in Iran. Globalization and Health, 20(1): 23. https://doi.org/10.1186/s12992-024-01028-w
[8] Sigmund, Z., Radujković, M., Atalić, J. (2022). The role of disaster risk governance for effective post-disaster risk management-case of Croatia. Buildings, 12(4): 420. https://doi.org/10.3390/buildings12040420
[9] Bressan, G., Đuranović, A., Monasterolo, I., Battiston, S. (2024). Asset-level assessment of climate physical risk matters for adaptation finance. Nature Communications, 15(1): 5371. https://doi.org/10.1038/s41467-024-48820-1
[10] Panda, A. (2023). Transformative finance for climate-resilient development. Current Opinion in Environmental Sustainability, 64: 101327. https://doi.org/10.1016/j.cosust.2023.101327
[11] Dandoulaki, M., Lazoglou, M., Pangas, N., Serraos, K. (2023). Disaster risk management and spatial planning: Evidence from the fire-stricken area of Mati, Greece. Sustainability, 15(12): 9776. https://doi.org/10.3390/su15129776
[12] Safaeian, M., Moses, R., Ozguven, E.E., Dulebenets, M.A. (2024). An optimization-based risk management framework with risk interdependence for effective disaster risk reduction. Progress in Disaster Science, 21: 100313. https://doi.org/10.1016/j.pdisas.2024.100313
[13] Farinós-Dasí, J., Pinazo-Dallenbach, P., Peiró Sánchez-Manjavacas, E., Rodríguez-Bernal, D.C. (2024). Disaster risk management, climate change adaptation and the role of spatial and urban planning: Evidence from European case studies. Natural Hazards, 121(19): 23479-23512. https://doi.org/10.1007/s11069-024-06448-w
[14] Ibrahim, A., Salifu, A.H., Peprah, C. (2023). Does governance matter when disaster looms? Zooming into proactive institutional measures for flood risk management. International Journal of Disaster Risk Reduction, 97: 104021. https://doi.org/10.1016/j.ijdrr.2023.104021
[15] de Boer, W., Flath, L., Knodt, M., Schmalz, B. (2025). From silos to synergy: Improving coordination in local flood management. Water, 17(15): 2212. https://doi.org/10.3390/w17152212
[16] Rumbach, A. (2016). Decentralization and small cities: Towards more effective urban disaster governance? Habitat International, 52: 35-46. https://doi.org/10.1016/j.habitatint.2015.08.026
[17] Peñas, S.L., Lago, I., Martínez-Vázquez, J. (2025). Decentralisation and the governance of extreme events. Regional Studies, 59(1). https://doi.org/10.1080/00343404.2024.2438328
[18] Graveline, M.H., Germain, D. (2022). Disaster risk resilience: Conceptual evolution, key issues, and opportunities. International Journal of Disaster Risk Science, 13(3): 330-341. https://doi.org/10.1007/s13753-022-00419-0
[19] Cabral-Ramírez, M., Niño-Barrero, Y., DiBella, J. (2025). Lessons from the implementation of the Sendai framework for disaster risk reduction from Latin America and the Caribbean. International Journal of Disaster Risk Science, 16(1): 72-83. https://doi.org/10.1007/s13753-025-00613-w
[20] Shaw, R., Kishore, K. (2023). Disaster risk reduction and G20: A major step forward. Progress in Disaster Science, 17: 100274. https://doi.org/10.1016/j.pdisas.2023.100274
[21] Ku, C.A. (2024). Evaluating the effects of land-use strategies on future flood risk reduction in urban areas. Cities, 150: 104989. https://doi.org/10.1016/j.cities.2024.104989
[22] Alhadi, Z., Sasmita, S., Yulfa, A., Syafrini, D., Maani, K.D., Riandini, O. (2023). The coping strategies patterns based on local wisdom and resilience capital in facing natural disaster risk in Nagari Mandeh, Indonesia. International Journal of Sustainable Development and Planning, 18(1): 315-325. https://doi.org/10.18280/ijsdp.180133
[23] Alhadi, Z., Riandini, O., Eriyanti, F., Yusran, R., Permana, I. (2024). Analysis of the effectiveness and efficiency of tsunami disaster contingency planning policies in the Province of West Sumatra, Indonesia. International Journal of Safety and Security Engineering, 14(4): 1087-1098. https://doi.org/10.18280/ijsse.140407
[24] Djalante, R., Holley, C., Thomalla, F., Carnegie, M. (2013). Pathways for adaptive and integrated disaster resilience. Natural Hazards, 69: 2105-2135. https://doi.org/10.1007/s11069-013-0797-5
[25] Simonsen, C.B. (2006). Adaptive governance: Integrating science, policy, and decision making. Environmental Practice, 8(2): 145-146. https://doi.org/10.1017/s146604660629015x
[26] Nikkanen, M., Räsänen, A., Juhola, S. (2024). Adaptive governance of disaster preparedness? The case of regional networks in Finland. International Journal of Disaster Risk Reduction, 108: 104549. https://doi.org/10.1016/j.ijdrr.2024.104549
[27] Zhang, Q. (2023). Land use and adaptive governance under climate change: Analysis of four cases in pastoral areas of China. Frontiers in Environmental Science, 11. https://doi.org/10.3389/fenvs.2023.922417
[28] Carvalho, P., Spataru, C. (2024). Co-designing a just resilience balance scorecard with experts in islands and coastal cities. Climate Risk Management, 43: 100577. https://doi.org/10.1016/j.crm.2023.100577
[29] Nyide, S., Simatele, M.D., Grab, S., Adom, R.K. (2023). Assessment of the dynamics towards effective and efficient post-flood disaster adaptive capacity and resilience in South Africa. Sustainability, 15(17): 12719. https://doi.org/10.3390/su151712719
[30] de Bruijn, K.M., Jafino, B.A., Merz, B., et al. (2022). Flood risk management through a resilience lens. Communications Earth & Environment, 3(1): 285. https://doi.org/10.1038/s43247-022-00613-4
[31] Serre, D. (2025). Editorial of the special issue “flood risk and resilience in coastal zones and tropical islands.” Journal of Flood Risk Management, 18(3). https://doi.org/10.1111/jfr3.70115
[32] Hochrainer-Stigler, S., Bachner, G., Knittel, N., Poledna, S., Reiter, K., Bosello, F. (2024). Risk management against indirect risks from disasters: A multi-model and participatory governance framework applied to flood risk in Austria. International Journal of Disaster Risk Reduction, 106: 104425. https://doi.org/10.1016/j.ijdrr.2024.104425
[33] Tozier de la Poterie, A., Baudoin, M.A. (2015). From Yokohama to Sendai: Approaches to participation in international disaster risk reduction frameworks. International Journal of Disaster Risk Science, 6(2): 128-139. https://doi.org/10.1007/S13753-015-0053-6
[34] De Sisto, M., Shearing, C., Heffernan, T., Sanderson, D. (2024). Reshaping disaster management: An integrated community-led approach. Australian Journal of Public Administration, 85(1): 3-30. https://doi.org/10.1111/1467-8500.12668
[35] Okada, N., Renn, O. (2025). Coping with persistent disruptive stressors and polycrisis: Community-based policy making and local empowerment. International Journal of Disaster Risk Science, 16(4): 560-574. https://doi.org/10.1007/s13753-025-00654-1
[36] Kort, P.M., Lavrutich, M., Nunes, C., Oliveira, C. (2021). Preventing environmental disasters in investment under uncertainty. Environmental and Resource Economics, 83(1): 199-220. https://doi.org/10.1007/S10640-021-00606-5
[37] Heerma van Voss, B. (2023). The prevention cycle: State investments in preventing system risks over time. European Journal of Risk Regulation, 14(4): 656-673. https://doi.org/10.1017/err.2023.12
[38] Bechtel, M.M., Mannino, M. (2021). Ready when the big one comes? Natural disasters and mass support for preparedness investment. Political Behavior, 45(3): 1045-1070. https://doi.org/10.1007/S11109-021-09738-2
[39] Tymstra, C., Flannigan, M. (2025). Canada’s landscape fires spreading into uncharted territory. Environmental Research Letters, 20(11): 111003. https://doi.org/10.1088/1748-9326/ae1495
[40] Abdi-Dehkordi, M., Bozorg-Haddad, O., Salavitabar, A., Mohammad-Azari, S., Goharian, E. (2021). Development of flood mitigation strategies toward sustainable development. Natural Hazards, 108(3): 2543-2567. https://doi.org/10.1007/S11069-021-04788-5
[41] Azhar, M., Vahedifard, F., AghaKouchak, A. (2025). Comprehensive portfolio of adaptation measures to safeguard against evolving flood risks in a changing climate. Communications Earth & Environment, 6(1). https://doi.org/10.1038/s43247-025-02779-z
[42] Nordbeck, R., Seher, W., Grüneis, H., Herrnegger, M., Junger, L. (2023). Conflicting and complementary policy goals as sectoral integration challenge: An analysis of sectoral interplay in flood risk management. Policy Sciences, 56(3): 595-612. https://doi.org/10.1007/s11077-023-09503-8
[43] Restemeyer, B., Rijnks, R.H., van den Brink, M., Arts, J. (2025). Selecting policy instrument mixes for spatial quality: Insights from Dutch flood risk management. International Journal of Water Resources Development, 42(1): 47-71. https://doi.org/10.1080/07900627.2025.2551097
[44] Raikes, J., Henstra, D., Thistlethwaite, J. (2023). Public attitudes toward policy instruments for flood risk management. Environmental Management, 72(5): 1050-1060. https://doi.org/10.1007/s00267-023-01848-3
[45] Vogel, A., Seeger, K., Brill, D., et al. (2024). Towards integrated flood management: Vulnerability and flood risk in the Ayeyarwady Delta of Myanmar. International Journal of Disaster Risk Reduction, 114: 104723. https://doi.org/10.1016/j.ijdrr.2024.104723
[46] Fraser, A., Pelling, M., Scolobig, A., Mavrogenis, S. (2020). Relating root causes to local risk conditions: A comparative study of the institutional pathways to small-scale disasters in three urban flood contexts. Global Environmental Change-Human and Policy Dimensions, 63: 102102. https://doi.org/10.1016/J.GLOENVCHA.2020.102102
[47] Liu, L., Yin, J.J., Jiao, W., Alias, A. H., Haron, N.A., Abu Bakar, N. (2024). Urban flood resilience evaluation in China: A systematic review of frameworks, methods, and limitations. Geomatics, Natural Hazards and Risk, 16(1). https://doi.org/10.1080/19475705.2024.2445631
[48] Neely, C.L., Bourne, M., Chesterman, S., et al. (2021). Inclusive, cross-sectoral and evidence-based decision-making for resilience planning and decision-making in a devolved context. The European Journal of Development Research, 33(4): 1115-1140. https://doi.org/10.1057/S41287-021-00410-3
[49] Waardenburg, M., Groenleer, M., de Jong, J. (2025). Performance management in collaborative governance: A review of the literature and synthesis of the challenges. Public Performance & Management Review, 48(4): 735-767. https://doi.org/10.1080/15309576.2025.2510973
[50] Moore, T.G., Ahiaga-Dagbui, D.D., Chen, Y.W., Shrestha, A. (2025). Unlocking collaboration: The political and institutional forces driving risk allocation in transport megaprojects. Project Management Journal, 56(5): 585-603. https://doi.org/10.1177/87569728241312096
[51] Termeer, C.J.A.M., Feindt, P.H., Karpouzoglou, T., et al. (2019). Institutions and the resilience of biobased production systems: The historical case of livestock intensification in the Netherlands. Ecology and Society, 24(4): 15. https://doi.org/10.5751/ES-11206-240415
[52] Asadzadeh, A., Khavarian-Garmsir, A.R., Sharifi, A., Salehi, P., Kötter, T. (2022). Transformative resilience: An overview of its structure, evolution, and trends. Sustainability, 14(22): 15267. https://doi.org/10.3390/su142215267
[53] Kamble, P.A., Mehta, A., Rani, N. (2025). Building financial resilience: A systematic literature review and future research agenda. Journal of Economic Surveys, 40(2): 954-981. https://doi.org/10.1111/joes.70024
[54] Lipper, L., Cavatassi, R., Symons, R., Gordes, A., Page, O. (2021). Financing adaptation for resilient livelihoods under food system transformation: The role of multilateral development banks. Food Security, 13(6): 1525-1540. https://doi.org/10.1007/S12571-021-01210-7