Asfi Manzilati* | Reny Tiarantika | Bambang Hendroyono | Noor Sidharta | Anthon Efani | Nur Aini Wahyuningsih
© 2026 The authors. This article is published by IIETA and is licensed under the CC BY 4.0 license (http://creativecommons.org/licenses/by/4.0/).
OPEN ACCESS
Mangrove degradation has become one of the most critical threats to coastal social-ecological systems (SES), yet existing policy approaches predominantly address downstream ecological impacts while overlooking the structural governance mechanisms driving environmental decline. This study aims to identify the key structural determinants governing mangrove degradation and small-scale fishers' livelihood vulnerability within production forest ecosystems, and to formulate an adaptive policy zoning framework for sustainable coastal governance. A quantitative ex-post facto design was employed using secondary environmental datasets and expert-based structural assessment. Twenty socio-ecological variables representing biophysical, socio-economic, institutional, and infrastructure dimensions were evaluated through the Cross-Impact Matrix Multiplication Applied to Classification (MICMAC) method. Results reveal four dominant driving variables aquaculture land conversion, mangrove policy effectiveness, spatial planning compliance, and cross-sectoral institutional coordination that consistently retain the highest influence across both direct and indirect structural analyses. Eleven relay variables form a highly interconnected transmission core that amplifies ecological and socio-economic disturbances, while poverty, law enforcement capacity, and fisheries infrastructure emerge primarily as downstream outcomes rather than structural drivers. Building upon these structural relationships, this study proposes a three-zone adaptive policy framework integrating governance reform, ecosystem co-management, and outcome-based monitoring.
social-ecological systems, adaptive governance, structural analysis, sustainable coastal management
Mangrove forests sit at the interface between terrestrial and marine social-ecological systems (SES) in 123 countries. A hectare can store up to 650 tonnes of carbon and support more than 5,700 dependent species [1]. They buffer coastlines, provide fisheries nurseries, and regulate the hydro-oceanographic processes coastal communities depend on. Global cover has still declined by more than a fifth in four decades: 677,000 hectares were lost between 2000 and 2020 alone, and roughly half of all mangrove ecoregions are now classified as threatened. Most of this loss is anthropogenic. Land-use conversion to aquaculture and agriculture caused 62% of global losses between 2000 and 2016, and 80% of that human-driven loss was concentrated in just six Southeast Asian countries [2]. That concentration points to a governance failure in coupled human-natural systems [3, 4], which is the basis for treating coastal management as an integrated SES problem rather than a purely ecological one.
Indonesia's Ministry of Environment holds the world's largest mangrove area, at 3.46 million hectares in 2026, but it is also among the countries with the steepest absolute losses, along with Saudi Arabia [5]. That scale of loss is why the government set a national target to rehabilitate 600,000 hectares. East Java shows the same trend at a smaller scale. Provincial data put current mangrove cover at 27,221 hectares, A broader East Java forest assessment reports that primary mangrove forest fell from ~15,000 ha in 1990 to ~9,000 ha in 2022, consistent with substantial long-term degradation even if that estimate is narrower than total mangrove cover [6]. Aquaculture-pond conversion and unregulated infrastructure development are the main drivers. The result is a double vulnerability: environmental carrying capacity declines through abrasion, saltwater intrusion, and biodiversity loss, and that decline weakens the economic resilience of small-scale fishers who depend on intact mangrove–fisheries links. This tension is most critical, and institutionally fragmented, within mangrove ecosystems officially designated as production forests. Unlike strictly protected areas, production forests are the primary arenas where the ecological carrying capacity must directly absorb the intensive livelihood demands of local fishing communities.
Prior research on coastal governance and mangrove conservation, in East Java and elsewhere, stays largely within single sectors and small spatial scales. A national review of Drivers, Pressures, State, Impact, and Response (DPSIR) applications across Indonesia's mangrove provinces found that most studies still treat drivers, pressures, and impacts as separate analytical layers, and called for integrated approaches that connect spatial degradation with social outcomes [7]. The same split shows up on the ground: in Banyuwangi's Pangpang Bay, overlapping authority between the Forestry Service and the Fisheries Service over the same coastal space has produced years of institutional friction, with no shared mechanism linking the regional spatial plan to the coastal zoning plan [8]. Even recent methodological advances have not closed this gap; a 2025 study combining DPSIR with participatory GIS in the Sundarbans was, by its own account, the first to give DPSIR a spatial dimension, yet it still works at the scale of individual respondents' perceptions rather than provincial biophysical data [9]. This persistence is not surprising: SES are complex, non-linear, and tightly coupled [3, 4], so a shock to the environmental subsystem feeds quickly into economic resilience, and poverty in turn pushes communities toward more destructive resource use. Macro-level policy usually addresses downstream symptoms, such as cash assistance for poor fishers, without touching the upstream drivers [10], and foresight tools such as DPSIR, however refined, share the same blind spot: indirect, cascading effects between ecological and economic subsystems go unmapped.
Structural analysis responds to this gap directly by shifting the analytical focus from linear cause-and-effect to the architecture of the entire system [11, 12]. By utilizing cross-matrix multiplication, it systematically traces hidden feedback loops and indirect pathways, revealing how a biophysical shock cascades through multiple socioeconomic intermediaries. The Cross-Impact Matrix Multiplication Applied to Classification (MICMAC) method, part of Michel Godet's prospective foresight tradition [13, 14], has mapped driving and dependent variables in strikingly different systems: sugarcane agribusiness strategy in Mexico [15] smart-city eligibility assessment in India [16], gender barriers in green vocational education in Colombia [17], sustainability and food security prospects in the coastal areas of East Java [18] and alternative-livelihood sustainability in Nembrala, East Nusa Tenggara [19]. Across this range, the method consistently separates driving, relay, and dependent variables regardless of sector, which is what makes it transferable to coastal SES in the first place. But every one of these studies, including the only Indonesian coastal case, operates at a single site, institution, or village. None scales up to a provincial diagnostic that combines biophysical degradation data with socioeconomic determinants in one model.
This study applies MICMAC structural analysis to open up that black box of environmental governance in coastal East Java. Therefore, the primary objective of this research is to systematically map the structural relationships between biophysical mangrove degradation and the socio-economic vulnerabilities of small-scale fishers operating within production forest ecosystems. Specifically, it seeks to answer: How do direct and indirect interactions among ecological, economic, and institutional variables dictate the livelihood resilience of small-scale coastal communities? By addressing this question, the contribution is a provincial-scale typological classification of coastal vulnerability that merges biophysical degradation data with microeconomic determinants, used to identify driving, relay, and dependent variables. The output is an adaptive policy zoning map, intended as an operational basis for SDG 1, 8, 13, and 14, and as a diagnostic template other mangrove-dependent SES facing similar governance fragmentation could adapt.
2.1 Research design and study area
This study employs a quantitative-explanatory design utilizing an ex-post facto approach. The analysis relies on cross-validated secondary environmental data derived from remote sensing satellites and official institutional publications. Spatial aggregation and structural observations are exclusively focused on the coastal areas of East Java Province, Indonesia, encompassing 5 administrative regencies and municipalities directly adjacent to the sea (Figure 1). To ensure precise socio-ecological mapping, the investigation specifically targets mangrove ecosystems designated as production forests. These ecosystems serve as the primary ecological foundation and livelihood base for small-scale fishers. To capture the region's diverse geoclimatological landscape, the study area is stratified into three primary ecological clusters. The first cluster is the northern coast, which is characterized by mud substrates originating from large river estuaries. The second cluster is the eastern coast, situated between the Madura and Bali straits. The final cluster is the southern coastal belt, which is directly exposed to the massive wave energy of the Indian Ocean. This comprehensive stratification encapsulates a wide spectrum of mangrove degradation, variances in deforestation driven by aquaculture expansion, and heterogeneous poverty pockets among coastal communities.
Figure 1. Study area
2.2 Variable identification and operationalization
Grounded in the multidimensional integration concept of the SES framework [20], this study formulates 20 definitive key variables. The expansion to 20 variables ensures a granular capture of the non-linear interactions within production forest ecosystems [21]. These variables are systematically categorized into four SES dimensions: Resource Systems (Biophysical), Resource Units & Users (Socio-Economic), Public Infrastructure, and Governance Systems (Institutional). The selection process involved filtering macro-level indicators against the specific livelihood realities of small-scale fishers. The comprehensive operational definitions, measurement units, and specific institutional data sources for each variable are detailed in Table 1.
Table 1. Operationalization and codification of social-ecological system (SES) variables
|
Code |
Variable |
SES Dimension |
Operational Definition and Unit |
Source |
|
B1 |
Historical and current mangrove cover |
Biophysical |
Total spatial area of intact mangrove production forests (Hectares) |
[22-29] |
|
B2 |
Mangrove deforestation/degradation rate |
Biophysical |
Annual rate of mangrove area reduction due to land-use conversion (% or Hectares/year) |
|
|
B3 |
Coastal vegetation health index |
Biophysical |
Measure of vegetation vigor and density, often utilizing NDVI (Index) |
|
|
B4 |
Shoreline change / coastal erosion rate |
Biophysical |
Annual rate of shoreline retreat or accretion (Meters/year) |
|
|
B5 |
Mangrove blue carbon stock |
Biophysical |
Total estimated carbon stored in mangrove biomass and soil (Tons C/Hectare) |
|
|
B6 |
Land conversion rate to aquaculture ponds |
Biophysical |
Annual rate of mangrove area converted specifically to aquaculture (Hectares/year) |
|
|
B7 |
Mangrove biodiversity/species richness index |
Biophysical |
Number and diversity of mangrove flora and fauna species present (Index/Count) |
|
|
SE1 |
Coastal village poverty rate |
Socio-Economic |
Percentage of the coastal population living below the poverty line (%) |
|
|
SE2 |
Fisheries sector GRDP |
Socio-Economic |
Gross Regional Domestic Product contributed by fisheries/aquaculture (Monetary Value) |
|
|
SE3 |
Spatial Vulnerability Index |
Socio-Economic |
Composite index measuring community susceptibility to environmental hazards (Index) |
|
|
SE4 |
Community participation in mangrove management |
Socio-Economic |
Level of active involvement of local communities in conservation efforts (Scale/Index) |
|
|
SE5 |
Fisher household livelihood diversification |
Socio-Economic |
Number of alternative income sources available to fisher households outside fishing (Count) |
|
|
SE6 |
Social capital / collective action capacity |
Socio-Economic |
Measure of trust, networks, and cooperative ability within the community (Index) |
|
|
SE7 |
Aquaculture sustainability standard compliance |
Socio-Economic |
Percentage of aquaculture farms complying with sustainable standards (%) |
|
|
I1 |
Fish Landing Base Infrastructure (PPI) |
Infrastructure & Institutions |
Availability and condition of fish landing and processing facilities (Scale/Index) |
|
|
I2 |
Effectiveness of mangrove management policies |
Infrastructure & Institutions |
Percentage of mangrove rehabilitation targets specified in the District Mangrove Action Plan (RAD Mangrove) that were achieved within the reporting period, verified against realized mangrove cover change in regulated zones (%). |
|
|
I3 |
Anthropogenic pressures |
Infrastructure & Institutions |
Intensity of human-induced stress on the ecosystem (e.g., pollution, over-harvesting) (Index) |
|
|
I4 |
Spatial planning/zoning regulation compliance |
Infrastructure & Institutions |
Percentage of land-use parcels within the designated coastal spatial plan (RTRW/RZWP-3-K) found compliant during the most recent regency-level spatial audit, calculated as (number of compliant parcels ÷ total audited parcels) × 100. |
|
|
I5 |
Law enforcement capacity vs. illegal encroachment |
Infrastructure & Institutions |
Number of formal enforcement actions (patrols, seizures, and prosecutions) conducted against illegal logging and land-use encroachment, normalized per 100 km of coastline per year (Actions/100 km/year). |
|
|
I6 |
Cross-sectoral institutional coordination |
Infrastructure & Institutions |
Number of formal enforcement actions (patrols, seizures, and prosecutions) conducted against illegal logging and land-use encroachment, normalized per 100 km of coastline per year (Actions/100 km/year). Data source: Forest Management Bureau enforcement logs and district police environmental unit case records. |
2.3 Expert panel selection and consensus procedure
The expert panel consisted of 15 participants purposively selected from three institutional categories: government agencies, academic institutions, and community-based coastal practitioners. The panel included representatives from the East Java Provincial Marine and Fisheries Agency and the Forest Management Bureau, academic researchers with expertise in coastal resilience and marine economics, and practitioners from fisher associations and coastal surveillance groups. The panel represented the northern (n = 5), eastern (n = 2), and southern (n = 8) coastal zones of East Java. Panel members had a mean of 13.5 years of direct professional experience, ranging from 10 to 18 years, in coastal resource management, fisheries governance, or marine surveillance. This composition was intended to integrate governmental, academic, and field-based perspectives relevant to the SES under investigation. Panel composition follows the triple-helix rationale of integrating government, academic, and practitioner knowledge into a single consultative structure, which has been shown to strengthen the cross-sector relevance of policy-linked environmental assessments [30, 31]. Purposive sampling is appropriate here because the panel's analytical value depends on each participant's direct experience with the system under study [32].
Data collection used two sequential Focus Group Discussion (FGD) sessions alongside structured questionnaires. In the first session, panelists independently completed a cross-impact matrix, scoring the direct influence of every variable on every other on a four-level asymmetric scale: 0 for no influence, 1 for weak, 2 for moderate, and 3 for strong, with P reserved for potential future influence. This scale is the standard instrument for populating the Matrix of Direct Influences (MDI) in MICMAC analysis [33]. The FGD format was used because it allows panelists to align on variable definitions before scoring individually, reducing interpretation drift across the panel without requiring simultaneous group scoring.
Each of the 15 panelists independently produced a 20 × 20 cross-impact matrix, yielding 380 off-diagonal cell scores per expert. These 15 individual matrices were aggregated into a single MDI through a two-stage procedure. The statistical mode was applied first, identifying the most frequently endorsed influence rating for each of the 380 cell. A cells where scores were strongly divergenf and therefore ineligible for resolution by mode, when the modal frequency fell below 50% of panelists or when ratings included directly opposing values (particularly 0 and 3). Divergent cells were returned to the group in the second FGD session, where a final rating was agreed upon by open deliberation and explicit consensus among all panelists present. Cells with a clear majority (modal frequency ≥ 50%) passed through directly without further discussion. This design prevents arithmetic averaging from flattening substantive disagreements on contested variable pairs; the final matrix reflects the panel's collective judgment rather than a computational artifact of it [34]. The complete numerical MDI produced through this procedure is reported in Figure 2.
Figure 2. Matrix of Direct Influences (MDI)
Because the data collection process was conducted as a consensus-oriented FGD, individual 20 × 20 scoring matrices were not produced or retained as independent analytical datasets. Consequently, conventional inter-rater agreement statistics, such as Kendall's coefficient of concordance (W), cannot be calculated retrospectively from the available data. Agreement was instead established procedurally through structured discussion, justification of divergent assessments, and consensus formation at the variable-pair level.
2.4 MICMAC structural analysis
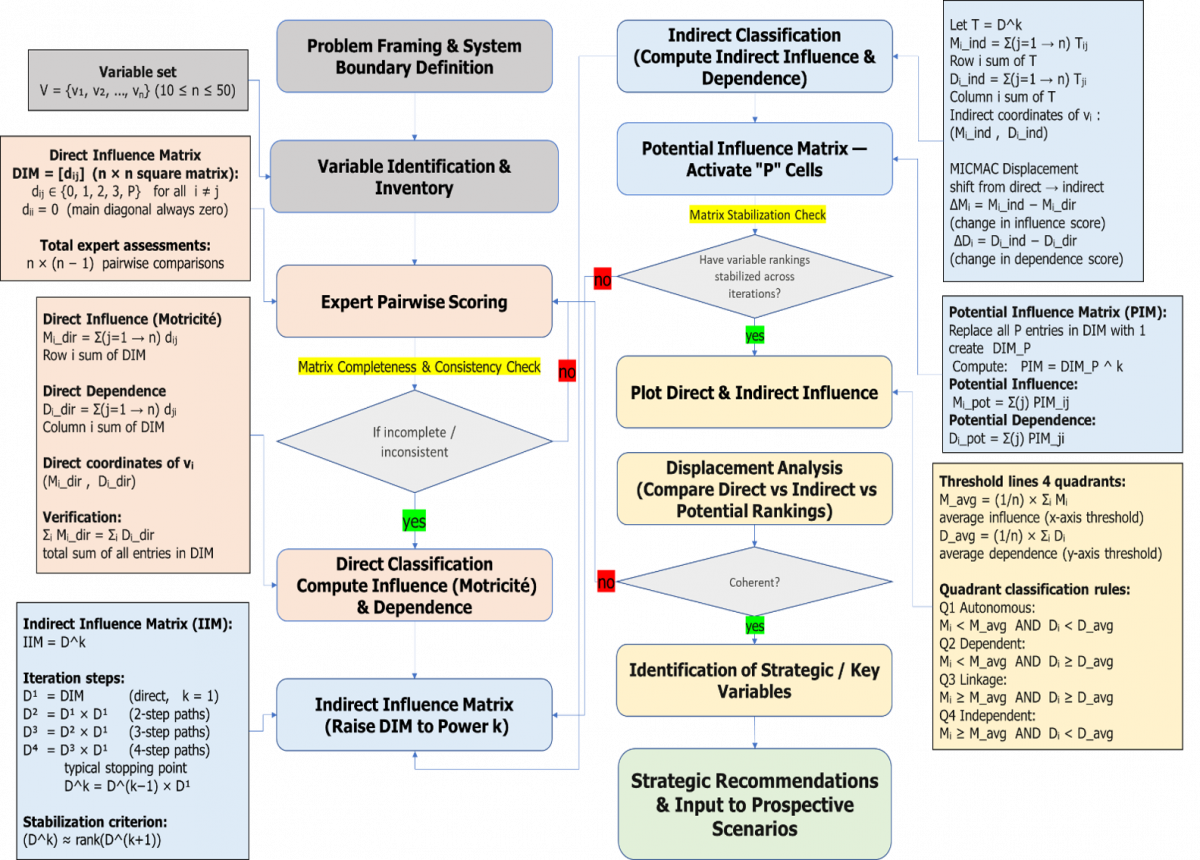
The structural analysis in this study utilizes the MICMAC methodology to systematically map the intricate structural influence relationships and hidden feedback loops among the identified socio-ecological variables (Figure 3). It is important to note that MICMAC identifies patterns of structural influence and dependence derived from expert judgment, not statistically demonstrated causal effects.
Figure 3. Flowchart of the comprehensive MICMAC
3.1 Direct influence and dependence classification
The direct influence/dependence map generated from the MDI classifies the twenty operationalized variables into four structural categories based on their driving power (Mi) and dependence (Di), following Godet's structural prospective methodology [9, 10]. The resulting distribution, four driving variables (B6, I2, I4, I6), eleven relay variables, four dependent variables (SE1, SE7, I1, I5), and a single excluded variable (SE5) reveals a system in which the relay quadrant is markedly dominant (see Figure 4 and Table 2). Quadrant assignment follows the standard threshold rule relative to the average driving power and average dependence computed across all twenty variables (M_avg = D_avg = 29.70; full scores reported in Table 3).
The MDI classifies twenty operationalized variables into four structural categories by driving power and dependence score. With four driving, eleven relay, four dependent, and one excluded variable, the relay quadrant is by far the most populated zone.
Table 2. Direct influence/dependence scores
|
Code |
Variable |
Direct Influence |
Direct Dependence |
Classification |
|
B1 |
Historical and current mangrove cover |
33 |
38 |
Relay |
|
B2 |
Mangrove deforestation/degradation rate |
34 |
39 |
Relay |
|
B3 |
Coastal vegetation health index |
32 |
38 |
Relay |
|
B4 |
Shoreline change / coastal erosion rate |
31 |
37 |
Relay |
|
B5 |
Mangrove blue carbon stock |
34 |
38 |
Relay |
|
B6 |
Land conversion rate to aquaculture ponds |
35 |
18 |
Driving |
|
B7 |
Mangrove biodiversity/species richness index |
32 |
39 |
Relay |
|
SE1 |
Coastal village poverty rate |
18 |
35 |
Dependent |
|
SE2 |
Fisheries sector GRDP |
32 |
35 |
Relay |
|
SE3 |
Spatial Vulnerability Index |
31 |
36 |
Relay |
|
SE4 |
Community participation in mangrove management |
32 |
36 |
Relay |
|
SE5 |
Fisher household livelihood diversification |
0 |
0 |
Excluded |
|
SE6 |
Social capital / collective action capacity |
33 |
35 |
Relay |
|
SE7 |
Aquaculture sustainability standard compliance |
20 |
28 |
Dependent |
|
I1 |
Fish Landing Base Infrastructure (PPI) |
20 |
28 |
Dependent |
|
I2 |
Effectiveness of mangrove management policies |
44 |
18 |
Driving |
|
I3 |
Anthropogenic pressures |
31 |
37 |
Relay |
|
I4 |
Spatial planning/zoning regulation compliance |
38 |
19 |
Driving |
|
I5 |
Law enforcement capacity vs. illegal encroachment |
20 |
22 |
Dependent |
|
I6 |
Cross-sectoral institutional coordination |
44 |
18 |
Driving |
Figure 4. Direct influence-dependence map
The four driving variables aquaculture land conversion (B6), mangrove policy effectiveness (I2), spatial planning compliance (I4), and cross-sectoral coordination (I6) carry high driving power and low dependence.
Eleven variables populate the relay quadrant: mangrove cover (B1), deforestation rate (B2), vegetation health index (B3), shoreline change (B4), blue carbon stock (B5), biodiversity index (B7), fisheries GRDP (SE2), spatial vulnerability (SE3), community participation (SE4), social capital (SE6), and anthropogenic pressure (I3). These variables absorb shocks from the driving tier and retransmit them downward, making the relay core the most structurally volatile zone in the system.
The four dependent variables, coastal poverty rate (SE1), sustainability standard compliance (SE7), fish landing infrastructure (I1), and law enforcement capacity (I5), present low driving power alongside high dependence.
Fisher household livelihood diversification (SE5) is the sole excluded variable, with low scores on both driving power and dependence. Network-level visualization reinforces the quadrant structure: relay variables form a dense central cluster that receives strong inputs from the peripheral institutional and land-use hubs, while law enforcement and livelihood diversification occupy marginal positions consistent with their dependent and excluded status.
3.2 Direct influence graph
To further substantiate the quadrant classification derived from the MDI, the structural data is visualized as a network topology through the direct influence graph (Figure 5). While the influence/dependence map plots the aggregated driving power and dependency of each variable, the direct influence graph explicitly maps the specific relational pathways and the intensity of connections between individual nodes. The visual encoding of the lines where the thickest red edges represent the strongest direct impacts and the solid blue edges indicate relatively strong influences provides an immediate diagnostic view of how systemic shocks are transmitted.
The direct influence graph provides a network-based representation of the structural influence pattern identified in the influence-dependence map. Edge weight and color—red for the strongest direct relationships, blue for moderately strong ones correspond to the MDI scoring matrix, making the graph a visual complement to the MICMAC quadrant classification [35]. The resulting network topology shows a system organized around a densely connected transmission core whose internal coupling is far greater than its periphery.
The highest concentration of crossing red and blue edges falls at the network's center, where deforestation rate (B2), anthropogenic pressure (I3), and mangrove cover (B1) converge. Policy effectiveness (I2) and aquaculture land conversion (B6), by contrast, occupy peripheral positions yet emit a disproportionate share of the strongest outgoing edges. Their structural role is that of primary driving variables: high driving power with low dependence, feeding continuously into the relay core. Law enforcement capacity (I5) and coastal village poverty rate (SE1) present the inverse configuration receiving many incoming edges from across the network while generating few of their own.
Figure 5. Direct influence graph
The network topology identifies the same small set of upstream variables I2, B6, I4, and I6 that the MICMAC quadrant and displacement analyses flagged as the system's primary control points.
3.3 Indirect influence graph
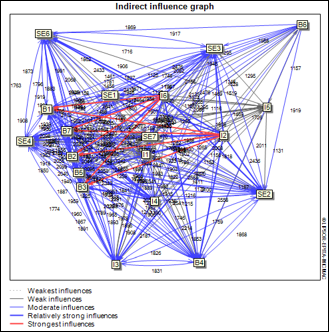
Building upon the immediate interactions mapped in the direct influence graph, the structural analysis advances to uncover the hidden, multi-step pathways within the system through the indirect influence graph (Figure 6). This network topology is generated mathematically by raising the initial MDI to successive powers, simulating how cascading effects and feedback loops propagate throughout the system over time. While the direct graph captures immediate, observable relationships, the indirect influence graph visualizes the ultimate structural architecture of the coastal SES.
3.4 Displacement analysis
The displacement map generated from the MICMAC analysis visualizes the trajectory of each variable as the computational model shifts from calculating direct influences to uncovering indirect and potential pathways (Figure 7). This step is critical in structural analysis, as complex SES often contain hidden feedback loops where a variable's true impact is mediated through multiple intermediate actors.
Figure 6. Indirect influence graph
Figure 7. Displacement map
Table 3. Direct vs. indirect influence and dependence scores
|
Kode |
MI_direct |
MI_indirect |
ΔM (%poin) |
DI_direct |
DI_indirect |
ΔD (%poin) |
|
B1 |
33 |
31,831 |
+0.08 |
38 |
36,087 |
-0.01 |
|
B2 |
34 |
32,649 |
+0.06 |
39 |
37,091 |
0.00 |
|
B3 |
32 |
30,888 |
+0.08 |
38 |
36,148 |
0.00 |
|
B4 |
31 |
29,872 |
+0.07 |
37 |
34,937 |
-0.04 |
|
B5 |
34 |
32,018 |
-0.05 |
38 |
35,589 |
-0.10 |
|
B6 |
35 |
32,562 |
-0.13 |
18 |
17,723 |
+0.11 |
|
B7 |
32 |
30,512 |
+0.02 |
39 |
37,414 |
+0.06 |
|
SE1 |
18 |
17,723 |
+0.11 |
35 |
33,784 |
+0.09 |
|
SE2 |
32 |
30,173 |
-0.04 |
35 |
33,285 |
0.00 |
|
SE3 |
31 |
29,141 |
-0.06 |
36 |
33,812 |
-0.07 |
|
SE4 |
32 |
29,722 |
-0.12 |
36 |
33,823 |
-0.07 |
|
SE5 |
0 |
0 |
0.00 |
0 |
0 |
0.00 |
|
SE6 |
33 |
31,182 |
-0.03 |
35 |
33,235 |
-0.01 |
|
SE7 |
20 |
19,684 |
+0.12 |
28 |
26,489 |
-0.02 |
|
I1 |
20 |
19,655 |
+0.11 |
28 |
26,399 |
-0.04 |
|
I2 |
44 |
41,314 |
-0.09 |
18 |
17,723 |
+0.11 |
|
I3 |
31 |
29,591 |
+0.02 |
37 |
34,683 |
-0.09 |
|
I4 |
38 |
35,661 |
-0.08 |
19 |
18,766 |
+0.12 |
|
I5 |
20 |
19,211 |
+0.03 |
22 |
19,992 |
-0.16 |
|
I6 |
44 |
41,314 |
-0.09 |
18 |
17,723 |
+0.11 |
The quantitative shifts between direct and indirect scores for each variable are explicitly reported in Table 3. This table details the initial direct influence (MI) and dependence (DI) scores alongside the computed indirect scores, quantifying the exact displacement (ΔM and ΔD) as multi-step pathways are activated. As visualized in the displacement map (Figure 7) and supported by the quantitative data in Table 3, trajectory lines connecting the direct, indirect, and potential influence coordinates remain short for nearly all variables. No variable migrates across quadrant boundaries.
Among the driving variables (Quadrant I), governance indicators (I2, I4, I6) and aquaculture land conversion (B6) show minimal vertical displacement. Their driving power persists when indirect pathways are incorporated into the iterative matrix algorithm.
Within the relay quadrant (Quadrant II), variables including the vegetation health index (B3), blue carbon stock (B5), and social capital (SE6) shift toward higher dependence or reduced influence when indirect pathways are activated. As these indirect effects propagate through the coastal system, relay variables become more embedded in the feedback structure.
The dependent quadrant (Quadrant III) yields particularly clear results. Law enforcement capacity (I5) and coastal village poverty rate (SE1) show distinct horizontal displacements under indirect analysis, confirming that both are structurally downstream in this system. For poverty, the indirect mapping traces its accumulation through declining fisheries productivity (SE2) and reduced ecological carrying capacity. For law enforcement, the rising indirect dependence on cross-sectoral coordination (I6) and policy effectiveness (I2) is evident.
Fisher household livelihood diversification (SE5) shows no displacement under either direct or indirect analysis. This is a null result worth examining carefully. Even through multi-step hidden pathways, diversification has no measurable structural connection to the broader coastal ecosystem dynamics.
The displacement analysis shows that the hidden pathways in this SES consolidate structural influence rather than redistribute it. Indirect loops increase the effective driving power of governance failures and tighten the dependence of ecological and economic indicators on upstream conditions.
3.5 Adaptive policy zoning map for coastal SES
Building on the quadrant classifications derived from this study, three spatially differentiated management zones are proposed across the five administrative regencies. As visualized in the GIS-based zoning map (Figure 8), these zones are geographically delineated using spatial criteria corresponding to the structural role of the variables concentrated within them. To ensure spatial consistency, these three policy zones are explicitly mapped onto the three ecological clusters defined in the methodology.
The first zone (corresponding to the eastern ecological cluster) covers coastal areas subject to unregulated aquaculture expansion and documented jurisdictional overlap, with Pangpang Bay Banyuwangi being a representative case. The target variables (B6, I2, I4, I6) are Quadrant I drivers whose positional persistence under indirect analysis confirms their function as primary control parameters for the broader SES.
The second zone (corresponding to the northern ecological cluster) targets actively degrading production forests where biophysical decline has measurably reduced local economic resilience notably the heavily abraded estuaries along the northern coast covering Pasuruan and Probolinggo. The relay variables here (B1, B2, B3, B5, B7, I3, SE4, SE6) showed heightened sensitivity to upstream shocks under displacement analysis, and anthropogenic pressure within this zone is partly generated internally through economic incentives.
The third zone (corresponding to the southern ecological cluster) covers marginalized fishing villages in the southern coast of Malang and sections of Situbondo, where the accumulated effects of upstream failures are most visible. Dependent variables (SE1, SE7, I5, I1) and the excluded variable (SE5) define this zone's target portfolio. The displacement analysis shows poverty in this zone accumulates through declining fisheries productivity and reduced ecological carrying capacity; it is a downstream indicator, not an upstream driver.
Figure 8. GIS-based adaptive policy zoning map across the five coastal regencies of East Java
4.1 Interpretation of the direct influence and dependence classification
In structural-analysis terms, a relay-heavy configuration indicates a tightly coupled SES in which most components both transmit and absorb influence, rather than a system organized around a small number of clearly separable causes and effects. This pattern is consistent with system-leverage theory, which holds that densely interconnected systems are particularly resistant to single-variable interventions and instead require leverage applied at a small number of upstream control points [31]. Coastal SES organized this way—where most variables both transmit and receive influence—do not respond well to isolated interventions; they require pressure applied at a small number of upstream control points [36, 37].
The four driving variables carry high driving power and low dependence. Their trajectories are shaped more by exogenous forces such as national fiscal incentives and commodity market demand than by ecological feedback within the study area. Aquaculture conversion's status as a driving variable is consistent with evidence that pond expansion in Indonesia and across Southeast Asia proceeds with limited sensitivity to local mangrove condition, remaining the dominant cause of forest loss even in the presence of restoration efforts [5, 38]. The three institutional variables cluster together and reflect a well-documented pattern in Indonesian coastal governance: fragmented mandates across fisheries, forestry, and spatial planning agencies generate regulatory gaps that competing economic interests routinely exploit [39, 40]. This quasi-exogenous behavior makes institutional coordination the most structurally defensible entry point for intervention.
Within the relay quadrant, vegetation loss reduces habitat integrity in ways that further depress biodiversity and carbon storage capacity—a dynamic confirmed in global analyses of connected mangrove loss trajectories [5, 41]. Anthropogenic pressure is partly endogenous: economic incentives tied to fishing and aquaculture generate deforestation pressure that persists regardless of ecological condition [39, 42]. Community participation and social capital are contingent on the resource base that sustains collective organization, as documented in community-based fisheries literature [37]. Intervening directly on individual relay variables without addressing the upstream drivers risks amplification through these paths; relay variables are more appropriate as early-warning indicators than as primary policy levers.
For the dependent variables, poverty accumulates through intermediate ecological and economic steps rather than acting as an immediate cause of land-use change: declining fish stocks reduce household income, which intensifies extraction pressure on remaining resources, creating a negative spiral that operates well below the level at which direct poverty-reduction programs typically intervene [43]. Enforcement and infrastructure follow the budget allocations and institutional priorities determined by the driving variables, while sustainability compliance tracks the regulatory environment produced upstream. These four variables therefore function best as outcome benchmarks for evaluating governance reforms in the driving tier.
The peripheral position of livelihood diversification is not confirmation that it is irrelevant, but indicates that it currently lacks structural connectivity to the coastal system's dynamics. Evidence from comparable small-scale fisheries contexts in Southeast Asia points to occupational entrenchment, limited capital access, and narrow labor market options as barriers that prevent diversification from emerging as a systemic stabilizer [44]. The structural architecture of this system is organized around a small cluster of land-use and governance drivers feeding a tightly coupled ecological and socioeconomic core—and this is where policy leverage must be concentrated.
4.2 Interpretation of the direct influence graph
The resulting network topology is consistent with broader social-ecological analyses of interacting mangrove degradation drivers [26]. The highest concentration of crossing edges at the network's center reflects a system in which disturbances recirculate through feedback pathways rather than dissipating at a single node—consistent with evidence that ecological degradation and anthropogenic pressure reinforce each other across ecological and economic dimensions in coastal mangrove systems [45, 46].
Law enforcement capacity and coastal village poverty rate function as terminal indicators of upstream failures rather than autonomous drivers [2, 47]. Policy that engages only the densely connected central nodes, without disrupting the outgoing edges from these peripheral sources, addresses observable symptoms while leaving their structural origins intact [48, 49]
4.3 Interpretation of the displacement analysis
In structural prospective analysis, the absence of inter-quadrant displacement indicates a stable system architecture whose structural hierarchies remain consistent across levels of analytical complexity [17, 35]. The classifications produced by the direct influence matrix are therefore a reliable representation of the system's structural organization, not an artefact of first-order matrix construction.
The persistence of the driving variables' influence under indirect analysis is expected behavior at stable MICMAC convergence [35], but the degree of persistence observed here is notable. Institutional arrangements and land-use dynamics are not merely associated with downstream degradation; within this structural model, they consistently occupy an upstream position that constrains it. This finding is consistent with regional evidence that identifies weak institutional coordination and unregulated aquaculture expansion as primary drivers of mangrove loss in Southeast Asia [50]. Interventions that target only ecological conditions or poverty indicators therefore remain structurally downstream of the actual control parameters of this system.
The pattern observed within the relay quadrant aligns with observations that mangrove ecosystem degradation compounds under multi-pathway pressure, where reductions in forest cover progressively erode ecosystem services and reduce community adaptive capacity [51, 52]. What the displacement analysis adds is structural confirmation: hidden pathways increase the sensitivity of relay variables to whatever state the driving variables are in, rather than attenuating it.
For poverty, the indirect displacement is consistent with the finding that coastal poverty in Indonesia operates through multi-step pathways mediated by ecosystem condition rather than as an autonomous driver of land-use change [53]. For law enforcement, the rising indirect dependence on cross-sectoral coordination and policy effectiveness confirms that institutional fragmentation at the system's apex directly limits what enforcement capacity can deliver at the operational level [54, 55].
The absence of displacement for livelihood diversification is a null result worth examining carefully: evidence from Java and comparable small-scale fisheries contexts indicates that occupational entrenchment, low educational attainment, and limited institutional support constrain diversification options in ways that current coastal resilience programs have not yet resolved [56]. The absence of any displacement line is interpretable as a structural gap, not a confirmation of irrelevance.
Taken together, the direct and indirect structural analyses converge on the same conclusion: institutional coordination and land-use regulation are the most structurally upstream entry points available for policy intervention—and, by this analysis, the most efficient ones.
4.4 Policy implications of the adaptive zoning framework
The MDI and displacement analyses together support a transition from structural diagnosis to spatial policy design. Coastal zoning in East Java has historically been organized along sectoral lines, with forestry and fisheries agencies operating under separate planning mandates and overlapping jurisdictional boundaries, while spatial plans have responded to visible conditions such as erosion and poverty rather than their structural antecedents.
In the first zone, effective management requires institutional action above the community scale: harmonization of spatial planning across provincial and regency levels, enforcement of restrictions on illegal mangrove conversion, and establishment of permanent interagency coordination mechanisms [54, 57]. Addressing institutional fragmentation here constrains the primary pathways through which governance failures enter the coastal system; interventions that bypass this zone and target downstream conditions directly will leave the root structural sources intact.
In the second zone, restrictions alone are insufficient because anthropogenic pressure is partly generated internally through economic incentives. Co-management arrangements that tie mangrove stewardship to sustainable fisheries access or ecotourism revenue have demonstrated capacity to restructure these local incentives without requiring communities to forgo immediate income [58, 59]. Ecological restoration—replanting, carbon stock protection—is most durable when embedded within such co-management frameworks, with social capital providing the organizational continuity needed to sustain interventions beyond individual project cycles.
In the third zone, past government assistance has concentrated on direct transfers and localized infrastructure, which addresses immediate need but does not alter the structural pathways generating it [60]. Two actions are structurally defensible here: integrating livelihood diversification into the coastal institutional economy to move it out of structural isolation [61, 62], and using the dependent variables as the primary monitoring indicators for evaluating whether upstream governance reforms in the first two zones are producing measurable community-level change.
This study finds that the coastal mangrove system in East Java is governed structurally by four upstream variables—aquaculture land conversion (B6), policy effectiveness (I2), spatial planning compliance (I4), and cross-sectoral coordination (I6)—that precede and condition the ecological and socioeconomic outcomes most visible to policymakers. Displacement analysis confirmed that these variables retain their driving positions under both direct and indirect pathway analysis, indicating that their structural primacy is embedded in the system's architecture rather than a function of first-order expert scoring. The eleven relay variables, including mangrove cover, blue carbon stock, social capital, and anthropogenic pressure, form a densely coupled transmission core that amplifies and retransmits shocks originating from the driving tier. Coastal poverty, enforcement capacity, and infrastructure accumulate at the dependent end of this structure as products of upstream conditions. Livelihood diversification remains structurally isolated throughout, pointing to an institutional gap that current coastal programs have not resolved.
The main implication of these findings is what they contradict. Government programs in coastal East Java have historically concentrated resources on the dependent tier—cash transfers, infrastructure investment, and site-level ecological restoration—while the institutional and land-use conditions generating system-wide degradation have remained structurally unaddressed. The analysis shows that this sequencing cannot produce durable outcomes while the driving variables continue operating undisturbed. The three-zone adaptive policy framework proposed here—upstream institutional reform, relay-zone co-management with ecological rehabilitation, and dependent-zone outcome monitoring—offers a structurally grounded alternative to this pattern.
The relevance of these findings extends beyond the five coastal regencies and three ecological clusters examined in this study. Indonesia's decentralized governance system has produced analogous jurisdictional fragmentation in mangrove-adjacent coastal systems across the archipelago, and the prospective structural approach applied here offers a transferable diagnostic method for identifying governance leverage points in those contexts. More broadly, the finding that institutional and land-use variables occupy the upstream driving position provides empirical support for centering governance reform in coastal management policy, complementing a growing body of evidence that governance capacity constitutes the binding constraint in mangrove conservation outcomes.
Three limitations warrant acknowledgment. The MDI rests on expert elicitation, which introduces scoring subjectivity; livelihood diversification's isolated position may partly reflect conservative assessments of its indirect linkages rather than a genuine structural absence. The analysis also produces a structural snapshot rather than a temporal trajectory, and whether the driving variables' positional dominance persists through active governance reform is an empirical question the MICMAC method cannot resolve without longitudinal validation. Third, because the structural matrix was generated through a consensus-oriented FGD rather than independently scored and retained individual matrices, a formal inter-rater agreement coefficient (e.g., Kendall's W) could not be calculated; agreement was instead addressed procedurally through structured deliberation, which we acknowledge as a methodological limitation relative to designs that preserve individual expert scores.
Future work should move in two directions. Within the study area, participatory re-scoring workshops and field monitoring of relay variables can test whether the structural predictions hold under observed management conditions. Beyond East Java, applying this analytical framework to comparable coastal governance contexts elsewhere in Indonesia would determine whether the institutional dominance identified here reflects a site-specific configuration or a systemic feature of the country's coastal governance landscape.
The authors gratefully acknowledge the Graduate School, Brawijaya University, Indonesia, for providing academic support and research facilities that made this study possible. The authors also express their sincere appreciation to the experts from government institutions, academia, and coastal community organizations who participated in the expert assessment and FGDs, contributing valuable knowledge and insights to the MICMAC structural analysis. Their expertise and constructive input were essential to the successful completion of this research.
[1] Food and Agriculture Organization. (2023). The world’s mangroves 2000–2020. https://doi.org/10.4060/cc7044en
[2] Goldberg, L., Lagomasino, D., Thomas, N., Fatoyinbo, T. (2020). Global declines in human-driven mangrove loss. Global Change Biology, 26(10): 5844-5855. https://doi.org/10.1111/gcb.15275
[3] Ostrom, E. (2009). A general framework for analyzing sustainability of social-ecological systems. Science, 325(5939): 419-422. https://doi.org/10.1126/science.1172133
[4] Berkes, F., Folke, C. (1998). Linking Social and Ecological Systems: Management Practices and Social Mechanisms for Building Resilience. Cambridge University Press.
[5] Ju, C., Fu, D., Lyne, V., Xiao, H., Su, F., Yu, H. (2025). Global declines in mangrove area and carbon-stock from 1985 to 2020. Geophysical Research Letters, 52(8): e2025GL115303. https://doi.org/10.1029/2025GL115303
[6] Doctorina, W.F., Rukmi, A.M., Prasetya, K.D. (2024). Assessing forest cover change detection and carbon stock in East Java using GIS. GEOMATE Journal, 27(122): 20-27. https://doi.org/10.21660/2024.122.4243
[7] Quevedo, J.M.D., Lukman, K.M., Ulumuddin, Y.I., Uchiyama, Y., Kohsaka, R. (2023). Applying the DPSIR framework to qualitatively assess the globally important mangrove ecosystems of Indonesia: A review towards evidence-based policymaking approaches. Marine Policy, 147: 105354. https://doi.org/10.1016/j.marpol.2022.105354
[8] Chen-Florea, A.L., Kurniawan, T., Afra, S.A., Putri, S.A., Syarien, M.I.A., Angwyn, M. (2024). The pangpang bay mangrove conservation and restoration (MCR) program.
[9] Polas, M.A.B., Ahammad, R., Topp, E., Plieninger, T. (2025). Participatory mapping of degradation and restoration processes in the Sundarbans mangrove ecosystem. Forest Policy and Economics, 173: 103460. https://doi.org/10.1016/j.forpol.2025.103460
[10] Marimuthu, M., Wong, H.H., Bangash, R. (2025). Unravelling feedback loop effects in oil-macro-financial linkages: An interdisciplinary approach using econometrics, network analysis and SVAR. Open Journal of Business and Management, 13(3): 1955-1973. https://doi.org/10.4236/ojbm.2025.133102
[11] Guzzo, D., Walrave, B., Videira, N., Oliveira, I.C., Pigosso, D.C. (2024). Towards a systemic view on rebound effects: Modelling the feedback loops of rebound mechanisms. Ecological Economics, 217: 108050. https://doi.org/10.1016/j.ecolecon.2023.108050
[12] Vazirian, R., Karimian, A., Ghorbani, M., et al. (2026). Strategic foresight for sustainable rural landscapes: Balancing environment and society. Land Degradation & Development, 37(9): 3767-3788. https://doi.org/10.1002/ldr.70341
[13] Godet, M. (2000). The art of scenarios and strategic planning: Tools and pitfalls. Technological Forecasting and Social Change, 65(1): 3-22. https://doi.org/10.1016/S0040-1625(99)00120-1
[14] Godet, M., Durance, P. (2007). Prospectiva Estratégica: Problemas y métodos. Cuadernos de LIPSOR, 104(20): 169-187.
[15] Villegas Vilchis, A., Platas Rosado, D., Gallardo-López, F., López-Romero, G. (2020). MicMac structural analysis to determine the strategic variables of the sugar agribusiness in Mexico. Revista Mexicana de Ciencias AgrÍcolas, 11(6): 1325-1335. https://doi.org/10.29312/remexca.v11i6.2194
[16] Kumar, H., Singh, M.K., Gupta, M.P. (2019). A policy framework for city eligibility analysis: TISM and fuzzy MICMAC-weighted approach to select a city for smart city transformation in India. Land Use Policy, 82: 375-390. https://doi.org/10.1016/j.landusepol.2018.12.025
[17] Vásquez-Chaux, P., Soto, J.D., Gallego, V. (2025). Pathways to green careers: Using MICMAC analysis to address gender barriers in STEM-related TVET education in Colombia. Empirical Research in Vocational Education and Training, 17(1): 20. https://doi.org/10.1186/s40461-025-00196-2
[18] Efani, A., Manzilati, A., Wardana, F.C., Tiarantika, R. (2024). Prospective variable design for agribusiness success: Sustainability and food security prospects in the coastal areas of East Java. International Journal of Safety & Security Engineering, 14(5): 1419-1429. https://doi.org/10.18280/ijsse.140509
[19] Paulus, C.A., Fauzi, A. (2017). Factors affecting sustainability of alternatives livelihood in coastal community of nembrala east nusa tenggara: An application of MICMAC method. Jurnal Ekonomi Pembangunan: Kajian Masalah Ekonomi dan Pembangunan, 18(2): 175. https://doi.org/10.23917/jep.v18i2.4397
[20] Partelow, S., Villamayor-Tomas, S., Eisenack, K., et al. (2024). A meta-analysis of SES framework case studies: Identifying dyad and triad archetypes. People and Nature, 6(3): 1229-1247. https://doi.org/10.1002/pan3.10630
[21] Sarker, M.M.H., Gain, A.K., Giupponi, C. (2025). Modelling mangrove social-ecological systems–A review. Environmental Research Communications, 7(6): 062001. https://doi.org/10.1088/2515-7620/addbac
[22] Winarso, G., Rosid, M.S., Kamal, M., Asriningrum, W., Margules, C., Supriatna, J. (2023). Comparison of mangrove index (MI) and normalized difference vegetation index (NDVI) for the detection of degraded mangroves in Alas Purwo Banyuwangi and Segara Anakan Cilacap, Indonesia. Ecological Engineering, 197: 107119. https://doi.org/10.1016/j.ecoleng.2023.107119
[23] Proisy, C., Viennois, G., Sidik, F., et al. (2018). Monitoring mangrove forests after aquaculture abandonment using time series of very high spatial resolution satellite images: A case study from the Perancak estuary, Bali, Indonesia. Marine Pollution Bulletin, 131: 61-71. https://doi.org/10.1016/j.marpolbul.2017.05.056
[24] Damastuti, E., de Groot, R., Debrot, A.O., Silvius, M.J. (2022). Effectiveness of community-based mangrove management for biodiversity conservation: A case study from Central Java, Indonesia. Trees, Forests and People, 7: 100202. https://doi.org/10.1016/j.tfp.2022.100202
[25] Taufik, I., Kinseng, R.A., Pandjaitan, N.K. (2025). Unraveling structural poverty: Insights from small-scale fishermen’s households on the coast of Muara Gembong, Indonesia. Simulacra, 8(2): 207-224. https://doi.org/10.21107/sml.v8i2.30463
[26] Sagala, P.M., Bhomia, R.K., Murdiyarso, D. (2024). Assessment of coastal vulnerability to support mangrove restoration in the northern coast of Java, Indonesia. Regional Studies in Marine Science, 70: 103383. https://doi.org/10.1016/j.rsma.2024.103383
[27] Damastuti, E., de Groot, R. (2017). Effectiveness of community-based mangrove management for sustainable resource use and livelihood support: A case study of four villages in Central Java, Indonesia. Journal of Environmental Management, 203: 510-521. https://doi.org/10.1016/j.jenvman.2017.07.025
[28] Yuniarti, T., Mulyono, M., Mardiana, M., et al. (2023). Profile of fisheries capture in Cikidang fish landing base (PPI): Pangandaran, West Java Study 2017-2021 and its potential utilization for fisheries product processing industry. IOP Conference Series: Earth and Environmental Science, 1289(1): 012014. https://doi.org/10.1088/1755-1315/1289/1/012014
[29] Tacconi, L., Rodrigues, R.J., Maryudi, A. (2019). Law enforcement and deforestation: Lessons for Indonesia from Brazil. Forest Policy and Economics, 108: 101943. https://doi.org/10.1016/j.forpol.2019.05.029
[30] Zadegan, M.G., Ghazinoory, S., Nasri, S. (2025). The triple helix model of innovation and sustainable development goals: A literature review. Sustainable Development, 33: 1482-1497. https://doi.org/10.1002/sd.70041
[31] Espuny, M., Reis, J.S.D.M., Giupponi, E.C.B., et al. (2025). The role of the triple helix model in promoting the circular economy: Government-led integration strategies and practical application. Recycling, 10(2): 50. https://doi.org/10.3390/recycling10020050
[32] Widiarti, R., Kusumawardhani, A.D., Burhanuddin, E., et al. (2025). The enhancement of community perception and participation in gaining sustainable coral reef management models. Frontiers in Marine Science, 12: 1577199. https://doi.org/10.3389/fmars.2025.1577199
[33] Alka, T.A., Raman, R., Suresh, M. (2025). Analyzing the causal relationships among socioeconomic factors influencing sustainable energy enterprises in India. Energies, 18(16): 4373. https://doi.org/10.3390/en18164373
[34] Tsakalerou, M., Efthymiadis, D., Abilez, A. (2022). An intelligent methodology for the use of multi-criteria decision analysis in impact assessment: The case of real-world offshore construction. Scientific Reports, 12(1): 15137. https://doi.org/10.1038/s41598-022-19554-1
[35] Nazlabadi, E., Maknoon, R., Moghaddam, M.R.A., Daigger, G.T. (2023). A novel MICMAC approach for cross impact analysis with application to urban water/wastewater management. Expert Systems with Applications, 230: 120667. https://doi.org/10.1016/j.eswa.2023.120667
[36] Refulio-Coronado, S., Lacasse, K., Dalton, T., et al. (2021). Coastal and marine socio-ecological systems: A systematic review of the literature. Frontiers in Marine Science, 8: 648006. https://doi.org/10.3389/fmars.2021.648006
[37] Steenbergen, D.J., Song, A.M., Andrew, N. (2022). A theory of scaling for community-based fisheries management. Ambio, 51(3): 666-677. https://doi.org/10.1007/s13280-021-01563-5
[38] Gerona-Daga, M.E.B., Salmo III, S.G. (2022). A systematic review of mangrove restoration studies in Southeast Asia: Challenges and opportunities for the united nation’s decade on ecosystem restoration. Frontiers in Marine Science, 9: 987737. https://doi.org/10.3389/fmars.2022.987737
[39] Gunawan, H., Basyuni, M., Subarudi, et al. (2025). Empowering conservation: The transformative role of mangrove education in Indonesia’s climate strategies. Forest Science and Technology, 21(4): 374-396. https://doi.org/10.1080/21580103.2025.2519475
[40] Karso, A.J. (2025). Natural resources governance and the vulnerability of indigenous communities in Indonesia. Frontiers in Political Science, 7: 1601480. https://doi.org/10.3389/fpos.2025.1601480
[41] Susilo, H., Takahashi, Y., Sato, G., Nomura, H., Yabe, M. (2018). The adoption of silvofishery system to restore mangrove ecosystems and its impact on farmers’ income in Mahakam Delta, Indonesia. Journal of the Faculty of Agriculture, Kyushu University, 63(2): 433-442. https://doi.org/10.5109/1955666
[42] Bamasood, S.A., Sayed, K., Syakir, M.I., Jaafar, M.H., Zuknik, M. (2025). Small-scale fishers livelihood strategies amid coastal reclamation in Malaysia. Fisheries Management and Ecology, 32(6): 529-541. https://doi.org/10.1111/fme.12823
[43] Shah, B.V., O'leary, B.C., Rejula, K., et al. (2025). Adaptation strategies of small-scale marine fisheries in response to climate change, resource changes, and sudden systemic shocks. Wiley Interdisciplinary Reviews: Climate Change, 16(5): e70019. https://doi.org/10.1002/wcc.70019
[44] Baloch, Q.B., Shah, S.N., Iqbal, N., et al. (2023). Impact of tourism development upon environmental sustainability: A suggested framework for sustainable ecotourism. Environmental Science and Pollution Research, 30(3): 5917-5930. https://doi.org/10.1007/s11356-022-22496-w
[45] Fairuzabadi, A., Afrianto, E., Pratama, L.U., Bahtiar, M.Y. (2025). The role of digital technology in sustainable public asset management in Malang City. PANGRIPTA, 8(2): 179-195. https://doi.org/10.58411/eb5hta18
[46] Bhowmik, A.K., Padmanaban, R., Cabral, P., Romeiras, M.M. (2022). Global mangrove deforestation and its interacting social-ecological drivers: A systematic review and synthesis. Sustainability, 14(8): 4433. https://doi.org/10.3390/su14084433
[47] Kim, A.J., Brown, A., Nelson, M., et al. (2019). Planning and the so-called ‘sharing’economy/can shared mobility deliver equity?/the sharing economy and the ongoing dilemma about how to plan for informality/regulating platform economies in cities–disrupting the disruption?/regulatory combat? how the ‘sharing economy’is disrupting planning practice/corporatised enforcement: Challenges of regulating Airbnb and other platform economies/nurturing a generative sharing economy for local public goods and service provision. Planning Theory & Practice, 20(2): 261-287. https://doi.org/10.1080/14649357.2019.1599612
[48] Perry, G.L., Richardson, S.J., Harré, N., et al. (2021). Evaluating the role of social norms in fostering pro-environmental behaviors. Frontiers in Environmental Science, 9: 620125. https://doi.org/10.3389/fenvs.2021.620125
[49] Efani, A., Tiarantika, R., Manzilati, A., Sambah, A.B., Riza, M.F. (2024). Key variables for successful community-based ecotourism management in East Java, Indonesia. Evergreen, 11(4): 2831-2847. https://doi.org/10.5109/7326927
[50] Richards, D.R., Friess, D.A. (2016). Rates and drivers of mangrove deforestation in Southeast Asia, 2000–2012. Proceedings of the National Academy of Sciences, 113(2): 344-349. https://doi.org/10.1073/pnas.1510272113
[51] Armawi, A., Limbongan, S.A. (2022). The local-wisdom-based social capital for strengthening social resilience during the COVID-19 pandemic. Masyarakat, Kebudayaan & Politik, 35(4): 514-526. https://doi.org/10.20473/mkp.v35i42022.514-526
[52] Jackson, L.A. (2026). Community-based tourism entrepreneurial ecosystems for the sustainable development goals: Tackling grand societal challenges in emerging economies. Sustainability, 18(5): 2389. https://doi.org/10.3390/su18052389
[53] De la Rosa-Velázquez, M.I., Espinoza-Tenorio, A., Díaz-Perera, M.Á., Ortega-Argueta, A., Ramos-Reyes, R., Espejel, I. (2017). Development stressors are stronger than protected area management: A case of the Pantanos de Centla Biosphere Reserve, Mexico. Land Use Policy, 67: 340-351. https://doi.org/10.1016/j.landusepol.2017.06.009
[54] Falayi, M., Lukhabi, D.K., Bana, L., et al. (2026). Nested institutions and overlapping mandates: A policy analysis of mangrove governance in Ghana, Tanzania Mainland, and Zanzibar. Environmental Policy and Governance, 36(4): 1019-1033. https://doi.org/10.1002/eet.70092
[55] Ajakaye, O., Lawal, A. (2024). Reforming intellectual property systems in Africa: Opportunities and enforcement challenges under regional trade frameworks. International Journal of Multidisciplinary Research and Growth Evaluation, 1(4): 84-102. https://doi.org/10.54660/.IJMRGE.2020.1.4.84-102
[56] Soedarmono, W., Gunadi, I., Indawan, F., Wulandari, C.S. (2022). The dynamics of foreign capital flows in Indonesia: Sources and implications on bond market and bank stability. Working Paper, Bank Indonesia.
[57] Nasution, M.S., Rusli, Z., Heriyanto, M., et al. (2025). Green governance and institutional resilience: Strengthening environmental policies for a low-carbon economy in mangrove ecosystems. Frontiers in Political Science, 7: 1631249. https://doi.org/10.3389/fpos.2025.1631249
[58] Arifanti, V.B., Sidik, F., Mulyanto, B., et al. (2022). Challenges and strategies for sustainable mangrove management in Indonesia: A review. Forests, 13(5): 695. https://doi.org/10.3390/f13050695
[59] Hagger, V., Worthington, T.A., Lovelock, C.E., et al. (2022). Drivers of global mangrove loss and gain in social-ecological systems. Nature Communications, 13(1): 6373. https://doi.org/10.1038/s41467-022-33962-x
[60] van Zanten, B., Brander, L.M., Castaneda, J.P., et al. (2025). Integrated spatial cost-benefit analysis of large-scale mangrove conservation and restoration in Indonesia. Frontiers in Environmental Science, 13: 1459034. https://doi.org/10.3389/fenvs.2025.1459034
[61] Anna, Z., Handaka, A.A., Dewanti, L.P., et al. (2026). Socio-economic characterization and operational patterns of multi-gear artisanal fisheries in Pangandaran Coastal Waters, West Java, Indonesia. Fishes, 11(4): 230. https://doi.org/10.3390/fishes11040230
[62] Bottema, M.J., Bush, S.R., Oosterveer, P. (2021). Assuring aquaculture sustainability beyond the farm. Marine Policy, 132: 104658. https://doi.org/10.1016/j.marpol.2021.104658