Rizki Adityaji | I Dewa Gde Satrya* | Denis Fidita Karya | Eshaby Mustafa | Aaron Kingsbury
© 2026 The authors. This article is published by IIETA and is licensed under the CC BY 4.0 license (http://creativecommons.org/licenses/by/4.0/).
OPEN ACCESS
The advancement of digital technologies has transformed the landscape of Indonesian tourism, particularly in destinations that actively implement smart tourism systems, such as Bali, Surabaya, and Lampung. This study examines the effect of Smart Tourism Applications (STA) on Co-Creation Experience (CCE), the influence of CCE on Memorable Tourism Experience (MTE), and the moderating roles of Digital Literacy (DL) and Destination Attachment (DA). Using a quantitative approach, data were collected from 509 tourists who had utilized digital tourism applications across the three destinations. The data were analyzed using Partial Least Squares Structural Equation Modeling (PLS-SEM). The results indicate that STA positively influence CCE (β = 0.641, p < 0.001), explaining 78.5% of its variance. Furthermore, CCE positively affects MTE (β = 0.472, p < 0.001), explaining 76.8% of the variance. DL does not significantly moderate the relationship between STA and CCE (p = 0.264), indicating that the effectiveness of STA in fostering CCE is relatively consistent across different levels of DL. In contrast, DA significantly and negatively moderates the relationship between CCE and MTE (β = -0.073, p < 0.001). This finding suggests that the contribution of co-creation activities to memory formation becomes less pronounced among tourists who already possess a strong emotional attachment to the destination, as memorable experiences may also stem from pre-existing emotional bonds and place meanings. This study contributes to the smart tourism and experience economy literature by integrating technological, experiential, and emotional dimensions into a single framework. The findings have practical implications for destination managers seeking to enhance STA and develop strategies that strengthen tourists’ emotional connections with destinations and support meaningful tourism experiences.
Co-Creation Experience, Destination Attachment, Digital Literacy, ecotourism, Memorable Tourism Experience, Smart Tourism Application
The rapid advancement of digital technologies has fundamentally transformed the tourism industry, giving rise to the concept of smart tourism destinations. Smart Tourism Application (STA) have become an essential component of tourism by enabling tourists to access real-time information, personalized recommendations, navigation services, digital booking systems, and interactive destination content through mobile technologies [1]. Rather than merely facilitating travel planning, STA increasingly shape tourists’ experiences before, during, and after their visits by creating more connected, efficient, and personalized tourism journeys [2].
Indonesia has experienced significant growth in the implementation of smart tourism initiatives, particularly in destinations with distinct tourism characteristics such as Bali, Surabaya, and Lampung. These destinations represent three tourism ecosystems. Bali is internationally recognized for its cultural and heritage tourism; Surabaya is an urban tourism destination characterized by smart city initiatives and digital public services; and Lampung is known for nature-based and conservation tourism. The diversity of these destination types provides a unique setting for understanding how smart tourism technologies influence tourist experiences across different tourism contexts. Therefore, examining these destinations within a single conceptual framework offers an opportunity to extend smart tourism literature beyond a single-destination perspective and explore whether similar technological mechanisms operate across culturally, geographically, and functionally diverse destinations.
Recent tourism studies suggest that the value of STA extends beyond information provision. Digital technologies increasingly facilitate Co-Creation Experiences (CCE), in which tourists actively shape their own travel experiences through interactions with destinations, local communities, tourism providers, and other tourists [3, 4]. Through destination applications, tourists can leave reviews, share experiences, customize itineraries, join digital communities, and participate in interactive tourism activities. Consequently, STA are expected to serve as important antecedents of CCE by encouraging greater tourist participation and engagement throughout the travel journey [5].
However, tourists may differ considerably in their ability to utilize smart tourism technologies effectively. Such differences are often attributed to Digital Literacy (DL), which refers to an individual's ability to access, evaluate, understand, and use digital information and technologies effectively [6]. Tourists with higher DL are generally better able to navigate tourism applications, interpret digital information, and engage with technology-enabled tourism services [6]. Therefore, DL may strengthen the positive influence of STA on CCE. In this study, DL is conceptualized as a moderating variable that enhances tourists’ ability to transform technological features into meaningful participatory experiences.
The growing importance of CCE is also closely associated with the development of Memorable Tourism Experience (MTE) [7]. MTEs are those that are positively remembered after the trip ends [8, 9]. Previous studies indicate that active participation and personal involvement in tourism activities contribute significantly to memory formation because tourists become emotionally and cognitively engaged in the process of creating experiences. Consequently, tourists who participate more actively in co-creation activities are expected to develop stronger MTE.
Nevertheless, not all co-created experiences are equally memorable. The strength of the relationship between CCE and MTE may depend on tourists’ emotional bonds with the destination. This emotional bond is conceptualized as Destination Attachment (DA), which reflects the degree of emotional and functional connection tourists develop toward a destination [10]. Tourists who possess stronger DA are more likely to assign personal meaning to their experiences, thereby increasing the likelihood that co-created experiences become memorable. Accordingly, DA is proposed as a moderating variable that strengthens the influence of CCE on MTE [11, 12].
Although substantial research has examined smart tourism technologies, CCE, DL, DA, and MTE independently, limited studies have integrated these constructs within a single framework. More importantly, previous studies have largely focused on direct relationships while paying limited attention to the boundary conditions that determine when and for whom smart tourism technologies generate meaningful experiences. This study addresses this gap by proposing an integrated model in which DL and DA serve as moderators explaining the effectiveness of STA and CCE.
The novelty of this study lies not merely in combining existing constructs but in explaining how technological capability and emotional attachment jointly shape tourists’ experience creation processes. Furthermore, by examining Bali, Surabaya, and Lampung, three destinations representing cultural tourism, urban tourism, and nature-based tourism, respectively, this study provides a broader empirical context for understanding the applicability of smart tourism theories across diverse destination settings in Indonesia.
Therefore, this study aims to examine the effect of STA on CCE; investigate the moderating role of DL in this relationship; analyze the influence of CCE on MTE; and evaluate the moderating role of DA in strengthening the relationship between CCE and MTE.
2.1 Smart Tourism Application
STA are digital platforms that assist tourists in accessing information, planning trips, navigating destinations, and interacting with tourism services through mobile technologies and internet-based systems. As a key component of smart tourism, STA enhance tourist experiences by providing real-time information, personalized recommendations, and seamless access to services [13]. These applications also facilitate tourist participation through interactive features such as reviews, social sharing, and customized itineraries, thereby supporting value co-creation between tourists and destinations [11]. Previous studies have shown that smart tourism technologies improve convenience, engagement, and overall travel experiences, leading to greater tourist satisfaction and positive behavioral outcomes [1, 3, 14]. Therefore, STA is considered an important technological tool that enables tourists to engage in and co-create their tourism experiences actively.
2.2 Co-Creation Experience
CCE is an experience formed through the active involvement of tourists in creating value together with service providers, the destination environment, local communities, and fellow tourists. Tourists are not just passive consumers, but also participate in the process of interaction, collaboration, information sharing, and decision-making to shape a personalized and meaningful travel experience [4, 15].
2.3 Memorable Tourism Experience
A MTE leaves a strong emotional, cognitive, and sensory impression, making it easy to remember in the long term. MTE is formed from experiences that are unique, meaningful, enjoyable, authentic, and involve the emotional engagement of tourists as well as interaction with the destination or tourism activity [7].
2.4 Digital Literacy
DL is an individual's ability to use digital devices, understand digital information, evaluate information sources, communicate ethically in a digital environment, and create digital content effectively. DL encompasses technical, cognitive, and social-emotional skills in interacting in the digital world [6].
2.5 Destination Attachment
DA is the emotional, psychological, and functional attachment that tourists feel towards a destination. DA consists of two main components: place identity, the personal meaning and self-representation associated with the destination; and place dependence, the perception that the destination provides functions or experiences that other places cannot provide [12, 16]. The conceptual framework is shown in Figure 1.
Figure 1. Conceptual framework
This study employed a quantitative research approach to examine the relationships among STA, DL, CCE, DA, and MTE. Quantitative methods are appropriate for testing theoretical relationships using numerical data and statistical analysis techniques [17]. The study focused on three Indonesian tourism destinations with distinct characteristics: Bali, Surabaya, and Lampung.
A purposive sampling technique was employed to select respondents who met specific eligibility criteria. The respondents were required to (1) be at least 17 years old, (2) have visited Bali, Surabaya, or Lampung within the previous 12 months, and (3) have used tourism-related digital applications such as destination apps, online travel platforms, navigation applications, review platforms, or online booking systems during their travel experience. Purposive sampling was considered appropriate because the study specifically targeted tourists with prior experience using smart tourism technologies.
Data were collected through an online questionnaire distributed via social media platforms, tourism communities, and travel-related online networks. A total of 509 valid responses were obtained and used for analysis. Table 1 shows that the respondents comprised 170 tourists from Bali (33.4%), 269 from Surabaya (52.8%), and 70 from Lampung (13.8%). In addition to destination distribution, demographic information, including gender, age, visit frequency, tourist type (domestic or international), and tourism application usage profile, was collected to provide a comprehensive description of the sample characteristics.
Table 1. Respondent profile
|
Characteristic |
Category |
Frequency |
Percentage (%) |
|
Destination |
Bali |
170 |
33.4 |
|
Surabaya |
269 |
52.8 |
|
|
Lampung |
70 |
13.8 |
|
|
Gender |
Male |
238 |
46.8 |
|
Female |
271 |
53.2 |
|
|
Age |
17–25 years |
215 |
42.2 |
|
26–35 years |
168 |
33.0 |
|
|
36–45 years |
81 |
15.9 |
|
|
Above 45 years |
45 |
8.9 |
|
|
Tourist Type |
Domestic Tourist |
435 |
85.5 |
|
International Tourist |
74 |
14.5 |
|
|
Visit Frequency |
First-time Visitor |
201 |
39.5 |
|
Repeat Visitor (2–3 times) |
185 |
36.3 |
|
|
Frequent Visitor (> 3 times) |
123 |
24.2 |
|
|
Tourism Application Usage Frequency |
Daily |
127 |
25.0 |
|
Weekly |
182 |
35.8 |
|
|
Monthly |
109 |
21.4 |
|
|
Occasionally |
91 |
17.9 |
|
|
Most Frequently Used Tourism Applications |
Google Maps |
201 |
39.5 |
|
Traveloka |
126 |
24.8 |
|
|
Tripadvisor |
82 |
16.1 |
|
|
TikTok/Instagram Tourism Content |
65 |
12.8 |
|
|
Other Tourism Applications |
35 |
6.9 |
The questionnaire items were adapted from established scales in previous tourism and technology studies to ensure content validity. All items were measured using a five-point Likert scale ranging from 1 (strongly disagree) to 5 (strongly agree). The measurement instrument included constructs of STA, DL, CCE, DA, and MTE.
The collected data were analyzed using Partial Least Squares Structural Equation Modeling (PLS-SEM) with SmartPLS software. PLS-SEM was selected because it is suitable for complex models involving moderation effects, does not require multivariate normality, and is widely recommended for predictive and exploratory research [18]. The moderation analysis examined whether DL strengthened the relationship between STA and CCE, and whether DA moderated the relationship between CCE and MTE.
This methodological approach enabled a comprehensive examination of how technological, experiential, and emotional factors interact in shaping tourists’ memorable experiences across diverse tourism contexts in Indonesia.
In the course of PLS-SEM analysis, the measurement model (outer model) is examined to assess whether the indicators measure the relevant construct reliably and validly. The measure ‘Outer Loading’ is one of the most crucial ones since it denotes the strength of the reflection of the indicator on the latent construct. As stated by Hair et al. [19], outer loadings greater than 0.70 are considered sufficient because they indicate that the indicator explains more than 50% of its variance.
However, values between 0.60 and 0.70 are still acceptable in exploratory research, whereas values below 0.40 are recommended for elimination because their contribution to the construct is very small. In addition, Cronbach's Alpha is used to assess the internal consistency of the variable's indicators. A good Cronbach's Alpha value is above 0.70, although values between 0.60 and 0.70 are acceptable in preliminary research [18]. According to Hair et al. [19], composite reliability (CR) is considered superior because it considers the actual indicator weights in the model. The recommended CR value is ≥ 0.70, although 0.60–0.70 is still acceptable. Meanwhile, Average Variance Extracted (AVE) is used to assess convergent validity, the extent to which the construct indicators are correlated with one another and truly reflect the same construct. Fornell and Larcker [20] state that the AVE must be ≥ 0.50, indicating that the construct explains at least 50% of the variance in its indicators. If the AVE value is below 0.50, the construct is considered to lack adequate convergent validity. These results are presented in Table 2.
Table 2. Outer loading, Cronbach's Alpha, composite reliability, and Average Variance Extracted (AVE)
|
Variable |
Indicator |
Outer Loading |
Cronbach's Alpha |
Composite Reliability |
AVE |
|
Smart Tourism Application (STA) |
STA1 |
0.771 |
0.955 |
0.961 |
0.691 |
|
STA10 |
0.853 |
||||
|
STA11 |
0.847 |
||||
|
STA2 |
0.772 |
||||
|
STA3 |
0.774 |
||||
|
STA4 |
0.846 |
||||
|
STA5 |
0.839 |
||||
|
STA6 |
0.858 |
||||
|
STA7 |
0.872 |
||||
|
STA8 |
0.851 |
||||
|
STA9 |
0.852 |
||||
|
Co-Creation Experience (CCE) |
CCE1 |
0.806 |
0.963 |
0.968 |
0.731 |
|
CCE10 |
0.849 |
||||
|
CCE11 |
0.857 |
||||
|
CCE2 |
0.843 |
||||
|
CCE3 |
0.843 |
||||
|
CCE4 |
0.876 |
||||
|
CCE5 |
0.885 |
||||
|
CCE6 |
0.863 |
||||
|
CCE7 |
0.847 |
||||
|
CCE8 |
0.864 |
||||
|
CCE9 |
0.868 |
||||
|
Memorable Tourism Experience (MTE) |
MTE1 |
0.818 |
0.973 |
0.976 |
0.755 |
|
MTE10 |
0.892 |
||||
|
MTE11 |
0.902 |
||||
|
MTE12 |
0.783 |
||||
|
MTE13 |
0.888 |
||||
|
MTE2 |
0.877 |
||||
|
MTE3 |
0.868 |
||||
|
MTE4 |
0.832 |
||||
|
MTE5 |
0.881 |
||||
|
MTE6 |
0.874 |
||||
|
MTE7 |
0.874 |
||||
|
MTE8 |
0.895 |
||||
|
MTE9 |
0.901 |
||||
|
Destination Attachment (DA) |
DA1 |
0.877 |
0.964 |
0.968 |
0.753 |
|
DA10 |
0.872 |
||||
|
DA2 |
0.870 |
||||
|
DA3 |
0.888 |
||||
|
DA4 |
0.882 |
||||
|
DA5 |
0.877 |
||||
|
DA6 |
0.877 |
||||
|
DA7 |
0.818 |
||||
|
DA8 |
0.854 |
||||
|
DA9 |
0.862 |
||||
|
Digital Literacy (DL) |
DL1 |
0.857 |
0.960 |
0.967 |
0.783 |
|
DL2 |
0.887 |
||||
|
DL3 |
0.888 |
||||
|
DL4 |
0.875 |
||||
|
DL5 |
0.909 |
||||
|
DL6 |
0.907 |
||||
|
DL7 |
0.852 |
||||
|
DL8 |
0.902 |
||||
|
STA * DL |
Moderating Effect |
1.720 |
1.000 |
1.000 |
1.000 |
|
CCE * DA |
Moderating Effect |
1.597 |
1.000 |
1.000 |
1.000 |
In addition, this study incorporates moderating effects using interaction terms between STA and DL, as well as between CCE and DA. The interaction constructs were generated using the product indicator approach in SmartPLS. Unlike conventional reflective constructs, interaction terms are created by multiplying the indicators of the predictor and moderator variables. Therefore, the outer loadings of interaction indicators may occasionally exceed 1.0 and should not be interpreted using the same criteria applied to reflective measurement indicators. Instead, the assessment of moderation focuses on the significance and effect size of the interaction paths within the structural model [18]. The direct effects of the moderator variables (DL and DA) on their respective endogenous constructs were included in the structural model to ensure proper estimation and interpretation of the moderating effects.
A combination of strong outer loadings, good reliability (Cronbach's Alpha and Composite Reliability), satisfactory AVE values, and properly specified interaction constructs provides evidence that the measurement model meets the required validity and reliability standards in PLS-SEM. Therefore, all indicators can be considered capable of consistently and accurately representing their respective constructs. The results of this analysis indicate that all constructs are valid and reliable for further assessment of the structural model.
4.1 Discriminant validity Fornell–Larcker
The Fornell–Larcker criterion was used to assess discriminant validity. According to Fornell and Larcker [20], the square root of the Average Variance Extracted (AVE) for each construct should be greater than its correlations with other constructs. As presented in Table 3, the diagonal values ranging from 0.831 to 1.000 are higher than the corresponding inter-construct correlations. For example, the square root of AVE for CCE (0.855) exceeds its correlations with DA (0.772), DL (0.787), MTE (0.821), and STA (0.817). Therefore, all constructs satisfy the Fornell–Larcker criterion, confirming adequate discriminant validity and demonstrating that each construct is empirically distinct from the others [18, 20].
Table 3. Discriminant validity Fornell–Larcker
|
CCE |
DA |
DL |
MTE |
Moderating Effect 1 DL |
Moderating Effect 2 DA |
STA |
|
|
CCE |
0.855 |
||||||
|
DA |
0.772 |
0.868 |
|||||
|
DL |
0.787 |
0.753 |
0.885 |
||||
|
MTE |
0.821 |
0.818 |
0.862 |
0.869 |
|||
|
Moderating Effect 1 DL |
-0.420 |
-0.392 |
-0.563 |
-0.513 |
1.000 |
||
|
Moderating Effect 2 DA |
-0.296 |
-0.394 |
-0.429 |
-0.417 |
0.858 |
1.000 |
|
|
STA |
0.817 |
0.762 |
0.771 |
0.789 |
-0.423 |
-0.309 |
0.831 |
Note: STA = Smart Tourism Application; CCE = Co-Creation Experience; MTE = Memorable Tourism Experience; DA = Destination Attachment; DL = Digital Literacy.
4.2 Heterotrait–monotrait ratio
Table 4 shows the HTMT values used to assess discriminant validity. Following the recommendation of Henseler et al. [21], all HTMT values should be below 0.90. The results indicate that all HTMT values range from 0.300 to 0.892, remaining below the threshold. The highest value is observed between DL and MTE (0.892), which remains acceptable. Therefore, all constructs demonstrate adequate discriminant validity, confirming that each construct is empirically distinct from the others and suitable for further structural model analysis [18].
Table 4. Heterotrait–monotrait ratio (HTMT)
|
CCE |
DA |
DL |
MTE |
Moderating Effect 1: DL |
Moderating Effect 2: DA |
|
|
CCE |
|
|
||||
|
DA |
0.801 |
|||||
|
DL |
0.816 |
0.782 |
||||
|
MTE |
0.847 |
0.844 |
0.892 |
|||
|
Moderating Effect 1: DL |
0.426 |
0.399 |
0.575 |
0.520 |
||
|
Moderating Effect 2 DA |
0.300 |
0.401 |
0.438 |
0.422 |
0.858 |
|
|
STA |
0.802 |
0.795 |
0.804 |
0.818 |
0.432 |
0.316 |
Note: STA = Smart Tourism Application; CCE = Co-Creation Experience; MTE = Memorable Tourism Experience; DA = Destination Attachment; DL = Digital Literacy.
4.3 Cross-loading
Table 5 presents the cross-loading values of all measurement indicators. The results show that each indicator has the highest loading on its respective construct compared to its loadings on other constructs. This finding indicates that all indicators are more strongly associated with their intended latent variables than with other constructs in the model. Therefore, the cross-loading criterion is fully satisfied, providing additional evidence of discriminant validity and confirming that the measurement items adequately represent their designated constructs [18].
Table 5. Cross-loading
|
CCE |
DA |
DL |
MTE |
Moderating Effect 1: DL |
Moderating Effect 2 DA |
STA |
|
|
CCE1 |
0.806 |
0.648 |
0.586 |
0.627 |
-0.276 |
-0.192 |
0.690 |
|
CCE2 |
0.843 |
0.665 |
0.631 |
0.676 |
-0.317 |
-0.232 |
0.735 |
|
CCE3 |
0.843 |
0.662 |
0.693 |
0.726 |
-0.364 |
-0.265 |
0.741 |
|
CCE4 |
0.876 |
0.677 |
0.730 |
0.753 |
-0.411 |
-0.305 |
0.769 |
|
CCE5 |
0.885 |
0.629 |
0.664 |
0.716 |
-0.383 |
-0.251 |
0.768 |
|
CCE6 |
0.863 |
0.667 |
0.669 |
0.716 |
-0.368 |
-0.256 |
0.745 |
|
CCE7 |
0.847 |
0.671 |
0.695 |
0.702 |
-0.360 |
-0.266 |
0.749 |
|
CCE8 |
0.864 |
0.652 |
0.683 |
0.711 |
-0.385 |
-0.272 |
0.747 |
|
CCE9 |
0.868 |
0.678 |
0.651 |
0.689 |
-0.345 |
-0.228 |
0.728 |
|
CCE10 |
0.849 |
0.671 |
0.654 |
0.672 |
-0.344 |
-0.232 |
0.732 |
|
CCE11 |
0.857 |
0.642 |
0.731 |
0.724 |
-0.380 |
-0.272 |
0.743 |
|
CCE * DA |
-0.296 |
-0.394 |
-0.429 |
-0.417 |
0.858 |
1.000 |
-0.309 |
|
DA1 |
0.682 |
0.877 |
0.671 |
0.733 |
-0.350 |
-0.353 |
0.683 |
|
DA2 |
0.652 |
0.870 |
0.635 |
0.702 |
-0.320 |
-0.330 |
0.644 |
|
DA3 |
0.694 |
0.888 |
0.658 |
0.725 |
-0.317 |
-0.328 |
0.687 |
|
DA4 |
0.676 |
0.882 |
0.699 |
0.743 |
-0.390 |
-0.382 |
0.673 |
|
DA5 |
0.666 |
0.877 |
0.643 |
0.712 |
-0.345 |
-0.346 |
0.625 |
|
DA6 |
0.694 |
0.877 |
0.691 |
0.724 |
-0.380 |
-0.377 |
0.673 |
|
DA7 |
0.624 |
0.818 |
0.605 |
0.626 |
-0.300 |
-0.295 |
0.630 |
|
DA8 |
0.655 |
0.854 |
0.634 |
0.684 |
-0.314 |
-0.319 |
0.671 |
|
DA9 |
0.673 |
0.862 |
0.636 |
0.707 |
-0.324 |
-0.325 |
0.660 |
|
DA10 |
0.678 |
0.872 |
0.660 |
0.731 |
-0.359 |
-0.360 |
0.667 |
|
DL1 |
0.648 |
0.608 |
0.857 |
0.724 |
-0.509 |
-0.372 |
0.634 |
|
DL2 |
0.673 |
0.605 |
0.887 |
0.748 |
-0.553 |
-0.419 |
0.665 |
|
DL3 |
0.712 |
0.644 |
0.888 |
0.750 |
-0.507 |
-0.380 |
0.701 |
|
DL4 |
0.704 |
0.669 |
0.875 |
0.743 |
-0.468 |
-0.345 |
0.682 |
|
DL5 |
0.735 |
0.715 |
0.909 |
0.794 |
-0.490 |
-0.374 |
0.702 |
|
DL6 |
0.687 |
0.683 |
0.907 |
0.755 |
-0.500 |
-0.374 |
0.693 |
|
DL7 |
0.699 |
0.712 |
0.852 |
0.766 |
-0.426 |
-0.346 |
0.678 |
|
DL8 |
0.706 |
0.690 |
0.902 |
0.822 |
-0.537 |
-0.428 |
0.700 |
|
MTE1 |
0.717 |
0.697 |
0.772 |
0.818 |
-0.429 |
-0.316 |
0.689 |
|
MTE2 |
0.714 |
0.748 |
0.746 |
0.877 |
-0.474 |
-0.398 |
0.680 |
|
MTE3 |
0.713 |
0.722 |
0.744 |
0.868 |
-0.458 |
-0.373 |
0.679 |
|
MTE4 |
0.708 |
0.692 |
0.706 |
0.832 |
-0.396 |
-0.321 |
0.651 |
|
MTE5 |
0.752 |
0.733 |
0.779 |
0.881 |
-0.445 |
-0.353 |
0.748 |
|
MTE6 |
0.711 |
0.704 |
0.754 |
0.874 |
-0.439 |
-0.368 |
0.682 |
|
MTE7 |
0.714 |
0.728 |
0.719 |
0.874 |
-0.408 |
-0.353 |
0.674 |
|
MTE8 |
0.712 |
0.726 |
0.749 |
0.895 |
-0.455 |
-0.376 |
0.704 |
|
MTE9 |
0.730 |
0.710 |
0.784 |
0.901 |
-0.469 |
-0.383 |
0.704 |
|
MTE10 |
0.702 |
0.666 |
0.782 |
0.892 |
-0.498 |
-0.397 |
0.695 |
|
MTE11 |
0.704 |
0.714 |
0.805 |
0.902 |
-0.488 |
-0.392 |
0.690 |
|
MTE12 |
0.667 |
0.684 |
0.630 |
0.783 |
-0.368 |
-0.298 |
0.625 |
|
MTE13 |
0.722 |
0.701 |
0.757 |
0.888 |
-0.459 |
-0.372 |
0.683 |
|
STA1 |
0.688 |
0.625 |
0.643 |
0.660 |
-0.352 |
-0.282 |
0.771 |
|
STA2 |
0.627 |
0.608 |
0.524 |
0.580 |
-0.264 |
-0.191 |
0.772 |
|
STA3 |
0.690 |
0.649 |
0.576 |
0.601 |
-0.270 |
-0.239 |
0.774 |
|
STA4 |
0.715 |
0.640 |
0.621 |
0.630 |
-0.340 |
-0.258 |
0.846 |
|
STA5 |
0.711 |
0.617 |
0.704 |
0.700 |
-0.446 |
-0.343 |
0.839 |
|
STA6 |
0.707 |
0.622 |
0.663 |
0.658 |
-0.368 |
-0.258 |
0.858 |
|
STA7 |
0.764 |
0.703 |
0.692 |
0.742 |
-0.402 |
-0.309 |
0.872 |
|
STA8 |
0.748 |
0.652 |
0.614 |
0.640 |
-0.326 |
-0.223 |
0.851 |
|
STA9 |
0.768 |
0.596 |
0.672 |
0.668 |
-0.391 |
-0.262 |
0.852 |
|
STA10 |
0.748 |
0.640 |
0.638 |
0.645 |
-0.322 |
-0.209 |
0.853 |
|
STA11 |
0.746 |
0.620 |
0.692 |
0.684 |
-0.377 |
-0.244 |
0.847 |
|
STA * DL |
-0.420 |
-0.392 |
-0.563 |
-0.513 |
1.000 |
0.858 |
-0.423 |
Note: STA = Smart Tourism Application; CCE = Co-Creation Experience; MTE = Memorable Tourism Experience; DA = Destination Attachment; DL = Digital Literacy.
4.4 R2
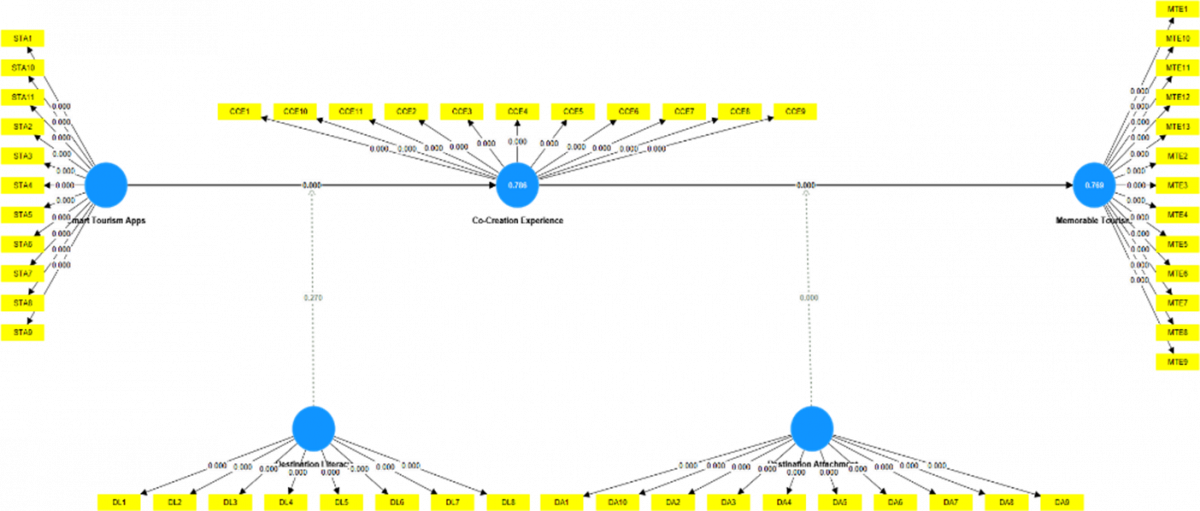
The R² value describes how well the independent variables explain the dependent variable in the research model. In this study, the R² value for CCE was 0.785, indicating that 78.5% of the variation in CCE is explained by STA, thus falling into the strong category in the PLS-SEM structural model [18]. Meanwhile, the R² value for MTE is 0.768, indicating that 76.8% of the variance in MTE is explained by CCE and the moderating effect of DA, which is also in the strong category. Overall, these two values indicate that the research model has high explanatory power and is suitable for predicting relationships among variables in the context of digital tourism. According to Figure 2, the R2 values are shown in Table 6.
Table 6. R2
|
|
R2 Adjusted |
|
CCE |
0.785 |
|
MTE |
0.768 |
Note: CCE = Co-Creation Experience; MTE = Memorable Tourism Experience.
4.5 f²
Table 7 presents the effect size (f²) values, which measure the contribution of each exogenous construct to the endogenous construct's R² value. The results show that STA has a large effect on CCE (f² = 0.778), indicating that STA is the most influential predictor in explaining tourists' CCEs. MTE is substantially influenced by CCE (f² = 0.391), indicating a large effect and suggesting that active participation in experience creation strongly contributes to the formation of MTE.
Furthermore, DA has a medium effect on MTE (f² = 0.269), indicating that tourists’ emotional connection to a destination contributes meaningfully to memory formation. DL shows a small effect on CCE (f² = 0.147), suggesting a limited contribution to tourists' participatory experiences.
Regarding the moderating effects, DL has a negligible effect on the relationship between STA and CCE (f² = 0.002). In contrast, DA exhibits a small moderating effect on the relationship between CCE and MTE (f² = 0.050). Overall, the findings indicate that STA and CCE are the strongest contributors within the structural model, whereas the moderating effects provide relatively limited explanatory power [18].
Table 7. f²
|
CCE |
DA |
DL |
MTE |
|
|
CCE |
|
|
|
0.391 |
|
DA |
|
|
|
0.269 |
|
DL |
0.147 |
|||
|
MTE |
|
|
|
|
|
Moderating Effect 1: DL |
0.002 |
|||
|
Moderating Effect 2: DA |
|
|
|
0.050 |
|
STA |
0.778 |
Note: STA = Smart Tourism Application; CCE = Co-Creation Experience; MTE = Memorable Tourism Experience; DA = Destination Attachment; DL = Digital Literacy.
4.6 Variance Inflation Factor
Table 8 presents the Variance Inflation Factor (VIF) values used to assess potential multicollinearity among the measurement indicators. According to [18], VIF values below 5.0 indicate that multicollinearity is not a serious concern in the measurement model. The results show that all indicators have VIF values ranging from 1.000 to 4.978, which are below the recommended threshold of 5.0. The highest VIF value is observed for MTE9 (4.978), followed by DL5 (4.820) and DL6 (4.733); however, these values remain within the acceptable range.
Furthermore, the interaction terms used in the moderation analysis, namely STA × DL and CCE × DA, both have VIF values of 1.000, indicating the absence of collinearity among the moderating constructs. Therefore, the findings confirm that the measurement model is free of substantial multicollinearity and that the indicators are suitable for further structural model analysis.
Table 8. Variance Inflation Factor (VIF)
|
VIF |
|
|
CCE1 |
2.909 |
|
CCE2 |
3.798 |
|
CCE3 |
3.448 |
|
CCE4 |
4.307 |
|
CCE5 |
4.379 |
|
CCE6 |
4.693 |
|
CCE7 |
3.641 |
|
CCE8 |
3.747 |
|
CCE9 |
4.047 |
|
CCE10 |
3.793 |
|
CCE11 |
3.435 |
|
CCE * DA |
1.000 |
|
DA1 |
3.891 |
|
DA2 |
4.081 |
|
DA3 |
4.266 |
|
DA4 |
4.249 |
|
DA5 |
4.076 |
|
DA6 |
4.028 |
|
DA7 |
2.761 |
|
DA8 |
3.360 |
|
DA9 |
3.739 |
|
DA10 |
3.918 |
|
DL1 |
3.680 |
|
DL2 |
4.729 |
|
DL3 |
3.992 |
|
DL4 |
4.056 |
|
DL5 |
4.820 |
|
DL6 |
4.733 |
|
DL7 |
3.189 |
|
DL8 |
4.215 |
|
MTE1 |
2.868 |
|
MTE2 |
4.240 |
|
MTE3 |
4.014 |
|
MTE4 |
3.302 |
|
MTE5 |
4.130 |
|
MTE6 |
4.140 |
|
MTE7 |
3.961 |
|
MTE8 |
4.573 |
|
MTE9 |
4.978 |
|
MTE10 |
4.342 |
|
MTE11 |
4.640 |
|
MTE12 |
2.380 |
|
MTE13 |
4.335 |
|
STA1 |
2.260 |
|
STA2 |
2.561 |
|
STA3 |
2.458 |
|
STA4 |
3.130 |
|
STA5 |
3.178 |
|
STA6 |
3.376 |
|
STA7 |
3.564 |
|
STA8 |
3.328 |
|
STA9 |
3.686 |
|
STA10 |
3.634 |
|
STA11 |
3.295 |
|
STA * DL |
1.000 |
Note: STA = Smart Tourism Application; CCE = Co-Creation Experience; MTE = Memorable Tourism Experience; DA = Destination Attachment; DL = Digital Literacy.
4.7 Q²
Table 9 presents the Q² values obtained through the blindfolding procedure. According to Hair and Alamer [18], Q² values greater than zero indicate that the model has predictive relevance. The results show that CCE (Q² = 0.569) and MTE (Q² = 0.573) both have Q² values well above 0.35, indicating strong predictive relevance. Therefore, the model demonstrates a high capability to predict the endogenous constructs and possesses satisfactory predictive accuracy.
Table 9. Q²
|
SSO |
SSE |
Q² (=1-SSE/SSO) |
|
|
CCE |
5,599.000 |
2,413.699 |
0.569 |
|
DA |
5,090.000 |
5,090.000 |
|
|
DL |
4,072.000 |
4,072.000 |
|
|
MTE |
6,617.000 |
2,822.168 |
0.573 |
|
Moderating Effect 1: DL |
509.000 |
509.000 |
|
|
Moderating Effect 2: DA |
509.000 |
509.000 |
|
|
STA |
5,599.000 |
5,599.000 |
Note: STA = Smart Tourism Application; CCE = Co-Creation Experience; MTE = Memorable Tourism Experience; DA = Destination Attachment; DL = Digital Literacy; SSO = Sum of Squares of Observations; SSE = Sum of Squares of Prediction Errors.
4.8 PLSpredict
The predictive performance of the model was evaluated using PLSpredict. As shown in Table 10, all Q²_predict values are positive, ranging from 0.476 to 0.640, which exceeds the recommended threshold of zero [22]. These findings indicate that the model has strong predictive relevance for both CCE and MTE. Additionally, the relatively low RMSE and MAE values suggest acceptable prediction errors, further supporting the model's predictive capability.
Table 10. PLSpredict
|
RMSE |
MAE |
MAPE |
Q²_Predict |
|
|
CCE1 |
0.763 |
0.576 |
21.099 |
0.476 |
|
CCE2 |
0.718 |
0.522 |
18.652 |
0.543 |
|
CCE3 |
0.656 |
0.472 |
16.309 |
0.580 |
|
CCE4 |
0.610 |
0.442 |
14.649 |
0.630 |
|
CCE5 |
0.636 |
0.451 |
15.606 |
0.594 |
|
CCE6 |
0.651 |
0.454 |
15.312 |
0.573 |
|
CCE7 |
0.657 |
0.465 |
16.727 |
0.591 |
|
CCE8 |
0.670 |
0.469 |
16.580 |
0.582 |
|
CCE9 |
0.703 |
0.505 |
17.950 |
0.544 |
|
CCE10 |
0.678 |
0.479 |
16.280 |
0.552 |
|
CCE11 |
0.647 |
0.458 |
16.109 |
0.603 |
|
MTE1 |
0.638 |
0.475 |
15.397 |
0.569 |
|
MTE2 |
0.576 |
0.439 |
13.353 |
0.610 |
|
MTE3 |
0.613 |
0.463 |
14.227 |
0.586 |
|
MTE4 |
0.681 |
0.487 |
17.037 |
0.534 |
|
MTE5 |
0.575 |
0.425 |
13.208 |
0.640 |
|
MTE6 |
0.661 |
0.468 |
16.104 |
0.578 |
|
MTE7 |
0.645 |
0.458 |
15.269 |
0.581 |
|
MTE8 |
0.606 |
0.436 |
13.651 |
0.606 |
|
MTE9 |
0.598 |
0.436 |
13.841 |
0.606 |
|
MTE10 |
0.621 |
0.445 |
13.896 |
0.568 |
|
MTE11 |
0.579 |
0.422 |
12.797 |
0.607 |
|
MTE12 |
0.745 |
0.533 |
19.797 |
0.491 |
|
MTE13 |
0.600 |
0.438 |
13.217 |
0.578 |
Note: STA = Smart Tourism Application; CCE = Co-Creation Experience; MTE = Memorable Tourism Experience; DA = Destination Attachment; DL = Digital Literacy.
4.9 Path coefficients
Path coefficients indicate the strength and direction of relationships between variables in PLS-SEM structural models, shown in Table 11.
Table 11. Path coefficients
|
|
Original Sample (O) |
Sample Mean (M) |
Standard Deviation (STDEV) |
t Statistics (|O/STDEV|) |
p-Values |
|
CCE -> MTE |
0.472 |
0.470 |
0.079 |
5.984 |
0.000 |
|
Moderating Effect 1 -> CCE |
0.014 |
0.015 |
0.012 |
1.118 |
0.264 |
|
Moderating Effect 2 -> MTE |
-0.073 |
-0.073 |
0.016 |
4.485 |
0.000 |
|
STA -> CCE |
0.641 |
0.637 |
0.051 |
12.681 |
0.000 |
Note: STA = Smart Tourism Application; CCE = Co-Creation Experience; MTE = Memorable Tourism Experience; DA = Destination Attachment; DL = Digital Literacy.
5.1 Co-Creation Experience on Memorable Tourism Experience
The results of the study show that CCE has a positive and significant effect on MTE, as indicated by a p-value of 0.000. These findings show that the higher the level of tourist involvement in co-creation activities during a trip, the greater the likelihood of forming a MTE that will remain in long-term memory. Therefore, the willing participation of tourists in value co-creation through interaction and collaboration during the visit is an important influence on the development of MTE.
This finding is consistent with recent tourism studies that emphasize the role of active participation in enhancing tourism experiences. Co-creation allows tourists to move beyond passive consumption and become active contributors to the experience creation process. Such involvement generates stronger emotional engagement, deeper personal meaning, and a greater sense of ownership over the experience, all of which contribute to the formation of MTE. Doan and Raj [23] found that interactive participation and social engagement significantly enhance tourists’ experiential value and emotional involvement. Similarly, Juliana et al. [24] demonstrated that co-created experiences involving interaction with local stakeholders and storytelling activities contribute positively to tourists’ memory formation. Angeloni [25] further reported that participatory tourism experiences strengthen tourists’ emotional connections with destinations, thereby increasing the likelihood of creating memorable experiences.
The results also support the experiential perspective on tourism, which argues that MTE are created not only by destination attributes but also by tourists’ active involvement in the production of experiences. When tourists participate in cultural activities, community-based tourism programs, conservation initiatives, or interactive tourism experiences, they are more likely to perceive the experience as meaningful and unique. As suggested by Yin et al. [26], smart tourism environments facilitate co-creation by enabling tourists to interact, customize experiences, and engage more deeply with destinations, ultimately enhancing memorable tourism outcomes.
From a practical perspective, destination managers should focus on developing tourism products that encourage active tourist participation rather than passive observation. Designing interactive experiences, community engagement programs, cultural workshops, and technology-supported tourism activities can strengthen tourists’ involvement and contribute to more MTE. Therefore, co-creation should be viewed as a strategic mechanism to enhance tourist experiences and increase destination competitiveness.
5.2 Smart Tourism Application on Co-Creation Experience
The data indicate that STA positively and significantly influences CCE, with a p-value of 0.000. This finding suggests that the positive influence of STA on CCE occurs regardless of tourists’ levels of DL. In other words, tourists with both higher and lower levels of DL can similarly benefit from STA that facilitate participation and engagement during their travel experiences.
One possible explanation is that contemporary STA are increasingly designed with user-friendly interfaces, intuitive navigation, and automated features that reduce the need for advanced digital skills. As a result, tourists can easily access information, receive recommendations, and interact with tourism services without requiring extensive technological knowledge. Recent studies have also shown that the effectiveness of smart tourism technologies is often driven more by system quality, ease of use, and perceived usefulness than by users’ digital competencies [27]. Furthermore, smart tourism platforms are becoming increasingly accessible and inclusive, enabling a wider range of tourists to participate in digitally supported tourism experiences [3].
The insignificant moderating effect also suggests that STAs have become sufficiently mature and standardized to support co-creation activities across different user groups. As tourists increasingly rely on mobile applications for travel planning, navigation, communication, and information search, the benefits of these technologies may be experienced relatively equally regardless of individual differences in DL. Similar findings have been reported in recent smart tourism studies, which suggest that system quality, perceived ease of use, and user-friendly design are more influential in shaping tourists' technology experiences than individual technological competencies [27, 28].
From a practical perspective, destination managers and application developers should continue prioritizing usability, accessibility, and user-centered design when developing STA. Rather than focusing solely on improving tourists’ DL, greater benefits may be achieved by enhancing application functionality, personalization, and ease of use. These findings suggest that well-designed STA can facilitate CCE for a broad range of tourists, making digital tourism experiences more inclusive and accessible.
5.3 Digital Literacy as a moderator of Smart Tourism Applications and Co-Creation Experience
The results of the study indicate that DL does not moderate the relationship between STA and CCE, as shown by the p-value = 0.264, which is well above the significance threshold of 0.05. This finding suggests that the positive influence of STA on CCE remains relatively consistent across tourists with different levels of DL. Therefore, the ability of STA to encourage tourist participation and engagement does not depend on tourists' DL.
One possible explanation is that contemporary STA have become increasingly user-friendly, intuitive, and accessible. Features such as personalized recommendations, GPS navigation, automatic translations, digital booking systems, and interactive destination information reduce the need for advanced technological competencies. As a result, tourists can effectively utilize these applications regardless of their DL levels. Recent studies have suggested that the success of smart tourism technologies is often driven by system usability, perceived usefulness, and ease of use rather than by individual technological capabilities. A possible explanation is that contemporary STA are increasingly designed to be intuitive, user-friendly, and accessible to a wide range of users. Consequently, the effectiveness of smart tourism technologies is often determined by system usability, perceived usefulness, and perceived ease of use rather than by individual technological capabilities [28-30].
The insignificant moderating effect may also indicate that digital technologies have become deeply integrated into everyday travel behavior. Many tourists are already familiar with mobile applications for navigation, accommodation booking, transportation services, and information searching. Consequently, differences in DL no longer substantially affect how tourists engage with STA. In this context, STA functions as a universally accessible tool that facilitates CCE across a broad range of users.
This finding contributes to the smart tourism literature by suggesting that DL may no longer be a critical boundary condition in the relationship between smart tourism technologies and CCE. Instead, the effectiveness of STA appears to depend more on application quality, functionality, and user-centered design. Therefore, destination managers and application developers should focus on improving usability, personalization, and interactive features rather than assuming that higher DL is necessary for tourists to engage in co-creation activities.
5.4 Destination Attachment as a moderator of Co-Creation Experience and Memorable Tourism Experience
The findings reveal that DA has a significant negative moderating effect on the relationship between CCE and MTE (β = -0.073, p < 0.001). This result indicates that higher levels of DA are associated with a weaker influence of CCE on the formation of MTE. In other words, as tourists become more emotionally attached to a destination, the contribution of co-creation activities to generating memorable experiences decreases.
A possible explanation for this negative moderating effect is that tourists with high levels of DA have already developed strong emotional bonds and personal meanings associated with the destination. As a result, their MTE are often shaped by feelings of familiarity, belonging, and emotional connection rather than by newly created participatory experiences. Consequently, the additional contribution of co-creation activities to MTE becomes less pronounced as DA increases.
This finding is consistent with recent DA literature suggesting that emotionally attached tourists tend to revisit destinations for their symbolic meanings, emotional satisfaction, and sense of place rather than for specific activities undertaken during the visit. In such cases, tourists derive memorable experiences from reconnecting with places that are already meaningful to them, reducing the relative importance of co-creation activities in generating new memories [31]. Furthermore, tourists with strong DA may prioritize emotional continuity and nostalgic experiences over novelty-seeking behaviors. While CCE are particularly important for first-time visitors or tourists with weaker emotional bonds, highly attached tourists may already possess a rich collection of memories associated with the destination [32, 33]. Therefore, additional participatory experiences contribute relatively less to memory formation than the emotional attachment accumulated through previous visits and personal experiences.
The negative moderation effect suggests that DA weakens the positive relationship between CCE and MTE. In other words, the beneficial effect of co-creation on memory formation becomes smaller as DA increases. This finding indicates that DA and CCE represent two distinct mechanisms through which MTE can be developed. For tourists with low DA, co-creation activities play a crucial role in creating memorable experiences. However, for highly attached tourists, memorable experiences are influenced more strongly by their existing emotional bond with the destination than by participatory activities undertaken during the visit.
This study confirms that technology-based tourism experiences and active participation in them positively influence the quality of modern tourism experiences. The findings from this study demonstrate that the use of STA positively enhances the CCE. This indicates that the use of digital technology enhances tourists' active participation in the value co-creation process of tourism. In addition, CCE is positively and significantly associated with MTE. This confirms that unique travel experiences arise from active, interactive, and collaborative encounters among tourists, service providers, and the destination's environment. However, the present study yields some interesting and contradictory relationships. DL does not impact the connection between STA and CCE. This indicates that tourism applications today are likely simple, regardless of the user's DL. On the contrary, the results show that DA negatively affects the relationship between CCE and MTE. This indicates that tourists who are strongly attached to destinations tend to be emotionally and sentimentally involved during the experience, thus lessening the role of co-creation.
Overall, this research expands knowledge of the interface between the technological and psychological components of the destination. The results of the study affirm the necessity of tailoring destination promotion and development strategies to tourists' level of emotional attachment to the destination. The study significantly bolsters the discourse on smart tourism, co-created experiences, and memorable tourism. This study also provides destination managers and stakeholders seeking to enhance the tourism experience in Bali, Surabaya, and Lampung with innovative digital tools and experience design that prioritize personalization and interaction with compatible technology.
6.1 Recommendations
Based on the findings, several practical and theoretical recommendations can be proposed. First, managers of tourism destinations in Bali, Surabaya, and Lampung should continue improving and developing STA that enable co-creation through activities such as interactive storytelling, community content, tool engagement, real-time personalization, and personalized itineraries. Usability and accessibility of these applications should be a priority for tourists so that co-creation can be utilized efficiently. Second, tourism operators should be able to design activities that pose challenges and offer opportunities for greater engagement and collaboration, including co-creation activities that are most beneficial for first-time and low-attachment visitors. For tourists with a greater DA, it is proposed that programs focused on the emotional, cultural, and nostalgic elements of the experience be offered. Third, investment in digital infrastructure is essential for policymakers, as is support for training local tourism actors so they can co-create and facilitate in both digital and face-to-face formats. Future research should consider additional moderators, such as cultural orientation, technology, and types of activities within tourism, to better understand the influence of co-creation on the formation of memorable experiences.
6.2 Limitations
Several limitations in this research must be discussed. Firstly, the research employed self-reported data via questionnaires, which may have introduced response bias, social desirability bias, or recall problems. Secondly, while the 509-respondent sample was quite large, the data collection was restricted to three regions in Indonesia: Bali, Surabaya, and Lampung, limiting the ability to extrapolate the findings to tourism destinations of a different culture or with different technology environments. Third, the cross-sectional design does not allow for a true understanding of causal relationships over time; in this case, co-creation, attachment, and memorable experiences might develop over a series of visits. Longitudinal studies are always needed for this kind of research. Fourth, the study attempted to measure specific variables, STA, CCE, DL, DA, and MTE, while ignoring other variables that have strong relevance, such as satisfaction, involvement, perceived value, and social influence. More additional variables should be included in future studies to increase model complexity and improve prediction accuracy. Finally, the study used generalized indicators to measure DL, which may have failed to capture specific differences between general and special-task digital skills in tourism. More specific measurement scales to capture this construct should be used in future research.
This research was funded by Universitas Ciputra Surabaya (2026).
[1] Azis, N., Amin, M., Chan, S., Aprilia, C. (2020). How smart tourism technologies affect tourist destination loyalty. Journal of Hospitality and Tourism Technology, 11(4): 603-625. https://doi.org/10.1108/JHTT-01-2020-0005
[2] Fatma, A., Bhatt, V. (2026). Conceptualizing smart tourism ecosystem: Multi-level framework integrating smart technologies and stakeholders for value co-creation. Journal of Hospitality and Tourism Insights, 9(8): 2993-3016. https://doi.org/10.1108/JHTI-06-2025-0693
[3] Chuang, C.M. (2023). The conceptualization of smart tourism service platforms on tourist value co-creation behaviours: An integrative perspective of smart tourism services. Humanities and Social Sciences Communications, 10: 367. https://doi.org/10.1057/s41599-023-01867-9
[4] Sabiote-Ortiz, C.M., Coves-Martínez, Á.L., Peco-Torres, F., Frías-Jamilena, D.M. (2025). Can smart technologies enhance co-creation and destination perceived authenticity? Culture’s moderating effect. Journal of Vacation Marketing. https://doi.org/10.1177/13567667241307393
[5] Lin, H.X., Zhang, M., Gursoy, D. (2022). Effects of tourist-to-tourist interactions on experience cocreation: A self-determination theory perspective. Journal of Travel Research, 61(5): 1105-1120. https://doi.org/10.1177/00472875211019476
[6] Wahyuningsih, Y., Pratisti, C. (2026). The impact of smart tourism technology on tourist satisfaction moderating by digital literacy. International Journal of Multidisciplinary Sciences and Arts, 5(1): 189-197. https://doi.org/10.47709/ijmdsa.v5i1.7740
[7] Chen, X., Cheng, Z.F., Kim, G.B. (2020). Make it memorable: Tourism experience, fun, recommendation, and revisit intentions of Chinese outbound tourists. Sustainability, 12(5): 1904. https://doi.org/10.3390/su12051904
[8] Hurdawaty, R., Dahana, W.D., Farradia, Y. (2025). Understanding revisit intention in local culinary tourism: The mediating role of memorable culinary tourism experience and destination image. Tourism and Hospitality, 6(4): 184. https://doi.org/10.3390/tourhosp6040184
[9] Sthapit, E., Coudounaris, D.N. (2018). Memorable tourism experiences: Antecedents and outcomes. Scandinavian Journal of Hospitality and Tourism, 18(1): 72-94. https://doi.org/10.1080/15022250.2017.1287003
[10] Dong, Y.Y., Qu, Y. (2022). The mechanism of body–mind integration in the formation of destination attachment: A comparison of first-time and repeat tourists. Frontiers in Psychology, 13: 1010589. https://doi.org/10.3389/fpsyg.2022.1010589
[11] Li, T., Liao, C.M., Law, R., Zhang, M. (2023). An integrated model of destination attractiveness and tourists’ environmentally responsible behavior: The mediating effect of place attachment. Behavioral Sciences, 13(3): 264. https://doi.org/10.3390/bs13030264
[12] Šagovnović, I., Kovačić, S., Kurež, B., Tretyakova, T.N., Syromiatnikova, Y.A. (2024). Getting closely attached to it: The role of destination personality and emotional experience in tourists’ attachment to a tourist destination. International Journal of Hospitality & Tourism Administration, 25(5): 1091-1125. https://doi.org/10.1080/15256480.2023.2235692
[13] Dorcic, J., Komsic, J., Markovic, S. (2019). Mobile technologies and applications towards smart tourism–State of the art. Tourism Review, 74(1): 82-103. https://doi.org/10.1108/TR-07-2017-0121
[14] Novianti, S., Susanto, E., Rafdinal, W. (2022). Predicting tourists’ behaviour towards smart tourism: The case in emerging smart destinations. Journal of Tourism Sustainability, 2(1): 19-30. https://doi.org/10.35313/jtospolban.v2i1.30
[15] Nyangwe, S., Buhalis, D. (2018). Branding transformation through social media and co-creation: Lessons from Marriott International. In Information and Communication Technologies in Tourism 2018, pp. 257-269. https://doi.org/10.1007/978-3-319-72923-7_20
[16] Patwardhan, V., Ribeiro, M.A., Woosnam, K.M., Payini, V., Mallya, J. (2020). Visitors’ loyalty to religious tourism destinations: Considering place attachment, emotional experience and religious affiliation. Tourism Management Perspectives, 36: 100737. https://doi.org/10.1016/j.tmp.2020.100737
[17] Leavy, P. (2022). Research Design: Quantitative, Qualitative, Mixed Methods, Arts-Based, and Community-Based Participatory Research Approaches (2nd ed.). The Guilford Press.
[18] Hair, J.F., Alamer, A. (2022). Partial Least Squares Structural Equation Modeling (PLS-SEM) in second language and education research: Guidelines using an applied example. Research Methods in Applied Linguistics, 1(3): 100027. https://doi.org/10.1016/j.rmal.2022.100027
[19] Hair, J.F., Risher, J.J., Sarstedt, M., Ringle, C.M. (2019). When to use and how to report the results of PLS-SEM. European Business Review, 31(1): 2-24. https://doi.org/10.1108/ebr-11-2018-0203
[20] Fornell, C., Larcker, D.F. (1981). Evaluating structural equation models with unobservable variables and measurement error. Journal of Marketing Research, 18(1): 39-50. https://doi.org/10.1177/002224378101800104
[21] Henseler, J., Ringle, C.M., Sarstedt, M. (2015). A new criterion for assessing discriminant validity in variance-based structural equation modeling. Journal of the Academy of Marketing Science, 43: 115-135. https://doi.org/10.1007/s11747-014-0403-8
[22] Shmueli, G., Sarstedt, M., Hair, J.F., et al. (2019). Predictive model assessment in PLS-SEM: Guidelines for using PLSpredict. European Journal of Marketing, 53(11): 2322-2347. https://doi.org/10.1108/EJM-02-2019-0189
[23] Doan, T.T., Raj, S.H.C. (2026). How host-guest interaction drives visitor experience, satisfaction, and support for regenerative tourism: Evidence from homestays in Sapa. SSRN Electronic Journal. https://doi.org/10.2139/ssrn.6556205
[24] Juliana, J., Indra, F., Sianipar, R., Djakasaputra, A., Effendy, L. (2025). Reimagining heritage tourism through co-creation: Insights from Prenggan Tourism Village, Yogyakarta. Sustainability, 17(24): 11112. https://doi.org/10.3390/su172411112
[25] Angeloni, S. (2023). A conceptual framework for co-creating memorable experiences: The metaphor of the journey. Journal of Consumer Marketing, 40(1): 67-86. https://doi.org/10.1108/JCM-03-2022-5230
[26] Yin, Y., Gao, J.J., Pan, Y. (2024). What impacts tourists’ co-creation experiences in smart tourism destinations? A mixed methods research from four Chinese smart tourism destinations. Tourism and Hospitality, 5(4): 1327-1343. https://doi.org/10.3390/tourhosp5040074
[27] Zhang, Y.W., Sotiriadis, M., Shen, S.W. (2022). Investigating the impact of smart tourism technologies on tourists’ experiences. Sustainability, 14(5): 3048. https://doi.org/10.3390/su14053048
[28] Rafdinal, W., Susanto, E., Novianti, S., Juniarti, C. (2021). Is smart tourism technology important in predicting visiting tourism destination? Lessons from West Java, Indonesia. Journal of Tourism Sustainability, 1(2): 102-115. https://doi.org/10.35313/jtos.v1i2.20
[29] Nguyen, T., Nguyen, T.T.N., Chau, N.T. (2024). Do the characteristics of smart tourism technologies stimulate tourists’ co-creative behaviour? A case study at the destination of Danang, Vietnam. SSRN Electronic Journal. https://doi.org/10.2139/ssrn.5077776
[30] Tiwari, V., Mishra, A., Tiwari, S. (2024). Role of data safety and perceived privacy for acceptance of IoT-enabled technologies at smart tourism destinations. Current Issues in Tourism, 27(19): 3079-3094. https://doi.org/10.1080/13683500.2023.2247534
[31] González-Reverté, F., Corrons, A., Gomis-López, J.M. (2025). Exploring the role of memorable tourism experiences and place attachment in the revisit intention of tourists staying in short-term rentals. Journal of Hospitality and Tourism Insights, 8(11): 79-99. https://doi.org/10.1108/JHTI-05-2024-0451
[32] Campos, A.C., Mendes, J., do Valle, P.O., Scott, N. (2016). Co-creation experiences: Attention and memorability. Journal of Travel & Tourism Marketing, 33(9): 1309-1336. https://doi.org/10.1080/10548408.2015.1118424
[33] Qian, Y.R., Peng, X.J., Jung, E. (2026). The role of cultural memory and place attachment in designing cultural heritage tourism. Scientific Reports, 16: 14321. https://doi.org/10.1038/s41598-026-44178-0