Chahrazed Elhabiri*![]() | Nassera Ghellai
| Nassera Ghellai![]() | Miloud Benmedjahed
| Miloud Benmedjahed![]() | Zakaria Bouzid
| Zakaria Bouzid![]() | El Mahdi Merad Boudia
| El Mahdi Merad Boudia![]()
© 2026 The authors. This article is published by IIETA and is licensed under the CC BY 4.0 license (http://creativecommons.org/licenses/by/4.0/).
OPEN ACCESS
This study aims to evaluate the wind potential of the Adrar province. It is mostly based on data from the Touat weather station, which is the only one in the area and has been in operation for 30 years (1994–2024). Wind speed variations were modeled using the Weibull distribution. However, being located near the airport, the station does not accurately represent the wind conditions in remote areas, especially since the Adrar province suffers from a lack of meteorological coverage. To overcome this limitation, a complementary approach based on interpolation was adopted. This method was validated by comparison with measured data and allowed for the identification of the four most favorable sites among 86,000 simulated points in the wilaya, with an average annual speed exceeding 7 m/s. These results offer a strong basis for the growth of renewable energy initiatives in southern Algeria.
wind energy, Weibull distribution, python, interpolation, renewable energy, Algeria
Reducing greenhouse gas emissions and promoting renewable energy have emerged as global strategic goals in the current energy transition context. Clean and renewable energy sources like solar and wind are becoming more and more important in energy policies as a result of the problems caused by climate change, the depletion of fossil fuels, and the need to guarantee sustainable energy security. Wind energy stands out among these options due to its low environmental impact, high development potential, and cost-competitiveness after the required infrastructure is put in place.
Algeria, a country with vast area (more than 2.38 million km²) and characterized by notably diverse climatic situations among the Mediterranean north and the Saharan south, has an especially significant wind resource, especially in its Saharan regions [1-4]. With wind speeds ranging from slight to sturdy values and remarkable seasonal balance in some regions, the Algerian Sahara affords favorable ground for the development of huge-scale wind tasks. However, this ability remains largely underutilized, despite numerous research and planning initiatives undertaken in recent years.
In order to better understand and exploit this resource, several studies have been undertaken, notably within the framework of the update of the National Wind Atlas, aiming to characterize wind potential at different regional scales [5-25].
Among the areas that have attracted particular attention is the Adrar region, known for its regular and sustained wind patterns. Previous studies have highlighted the areological assets of this region and suggested its relevance for the establishment of wind farms [26, 27].
Moreover, despite the growing interest in wind energy in southern Algeria, the effective exploitation of available data remains hindered by several limitations, notably the spatial coverage of meteorological stations in the Adrar province remains very limited, which makes it difficult to identify the windiest areas. Furthermore, the accuracy of wind modeling studies and simulations are strongly reliant on the abundance, volume, and consistency of meteorological data.
In the context of the present study, we are specifically interested in evaluating the wind potential of the Adrar region. This study is based on two complementary axes:
First, a geographic information system (QGIS) was used to generate wind speed and wind energy maps and estimate monthly, seasonal, and annual Weibull parameters using Python libraries such as NumPy, Pandas, Scipy, and Scikit-Learn.
Second, based on hourly wind data collected by the Touait meteorological station over a 30-year period, wind speed variations were modeled using the Weibull distribution. The observed results were compared with the predicted results to evaluate the effectiveness of the first method. This approach also made it possible to complete missing data through linear interpolation, identify the windiest areas in the region, and estimate monthly and seasonal Weibull distributions for these areas.
Thus, this study aims to provide a rigorous, comprehensive, and spatially detailed assessment of the wind resource in the Adrar region. It highlights the importance of the method.
2.1 Meteorological data
The meteorological station from which we obtained the necessary information for our work is located in the Touat region, an area of the Adrar province located in southwestern Algeria (Figure 1). It is located exactly next to the Sheik Sidi Mohamed Belkbir airport [28]. These geographical coordinates are presented in Table 1. The data is measured at a height of 10 m, with a measurement duration of 30 years.
Table 1. Geographical position of the measuring station
|
Site |
Longitude |
Latitude |
Altitude |
Period |
|
Touat |
0.286°W |
27.838°N |
280.1 m |
1994-2024 |

Figure 1. Location of the Adrar meteorological station
2.2 Weibull-based modeling
Given that wind speed changes rapidly and frequently over time, the statistical probability function, namely the distribution function, must be used to predict wind behavior over a given period. Weibull, Gamma, and Rayleigh distributions are types of probability distribution functions used to estimate wind potential using statistical distribution models [29, 30]. Several researchers have demonstrated that the Weibull distribution offers greater accuracy than other statistical functions for capturing the asymmetry of the wind speed distribution. For this reason, it is widely used [31, 32]. This distribution has two parameters that need to be estimated to find the probability density function and the cumulative distribution function; these parameters are the shape parameter k, which describes the shape of the distribution, and the scale parameter C, which informs about the average speed. The probability density function of the Weibull distribution is, according to Pavia and O'Brein [33], given by Eq. (1):
$f(v)=\frac{k}{C}\left(\frac{v}{C}\right)^{k-1} \exp \left(-\left(\frac{v}{C}\right)^k\right)$ (1)
where, v is the wind speed in (m/s) at time t.
Furthermore, the parameters k and C are determined by Eqs. (2) and (3) according to the work of several authors [34, 35]:
$k=\left(\frac{\sigma}{\bar{v}}\right)^{-1.086}$ (2)
$C=\frac{\bar{v}}{\Gamma\left(1+\frac{1}{k}\right)}$ (3)
with $\bar{v}$ is the average speed, σ is the standard deviation (m/s), and Γ is the gamma function. For the statistical processing of wind speeds, we applied the Linearized Normal Probability (PNL) classification. This method involves grouping the speed data into representative classes in order to reduce random variability and obtain a smoothed distribution.
In order to characterize the directional distribution of winds, a wind rose was developed. This tool allows for a graphical representation of the frequency and intensity of winds according to their direction, thereby providing a better understanding of the wind regime and dominant orientations. The data used comes from the Touat meteorological station, covering a period of 30 years, and was processed in Python using the Windrose library.
2.3 Interpolation method
The meteorological station whose coordinates are provided in Table 1, being the only one available, does not alone allow for the characterization of the entire territory of the Adrar wilaya, nor does it precisely identify the most favorable areas for the installation of wind turbines. Moreover, the previously available wind maps have several methodological limitations: they do not take into account the roughness of the terrain, nor the presence of natural or artificial obstacles, wrongly considering the region as perfectly flat terrain. To address these shortcomings, we chose to use data from the Global Wind Atlas (GWA) website. This tool is based on a combination of atmospheric reanalysis data, such as ERA5 or MERRA-2, coupled with high-resolution numerical models based on the Weather Research and Forecasting (WRF) meteorological model. The latter allows for dynamic downscaling, which refines global climate data by integrating local factors such as topography, terrain roughness, slope effects, and variations in ground friction, resulting in a spatial resolution of up to 250 meters [36, 37].
The GWA thus allows for the simulation of wind conditions over a period of 10 to 30 years, producing detailed statistical maps including: average wind speed at different heights, wind power density (expressed in W/m²), as well as Weibull parameters (shape factor k and scale factor C).
Following this approach, we used the average wind speed and wind power density maps provided by the Global Wind Atlas [36]. These maps were converted into usable digital data using spatial processing tools (such as Geospatial Data Abstraction Library (GDAL) and Python), then exported as Comma Separated Values (CSV) files. Each file represents the average wind speeds at different geographical points in the Adrar region, with high spatial resolution.
The numerical data enabled the extraction of annual mean wind speeds using the method of moments, which provides an analytical estimation of the Weibull distribution parameters based on statistical moments of the observed data. To estimate seasonal and monthly wind speeds at each geographic location, a dataset of monthly and seasonal Weibull parameters was utilized. These parameters, derived from available meteorological stations throughout Algeria, were spatially interpolated the usage of linear interpolation based on the geographic coordinates of every station. This manner allows for the estimation of month-to-month wind speed distributions at any arbitrary place inside the look at region.
Linear interpolation, in this context, represents the most effective and maximum direct approach for estimating the price of a continuous feature between acknowledged factors. Mathematically, for a function f(x,y,z) the interpolated fee among neighboring factors (x0,y0,z0) and (x1,y1,z1) is acquired by way of assuming that the variation of among these points is linear. In the prevailing examine, the variables x, y, and z correspond respectively to the longitude, latitude, and the Weibull parameter (both the size parameter C or the form parameter k) associated with every meteorological station. Although this approach is computationally green and simple to put into effect, it assumes a uniform gradient between remark points, which might also introduce uncertainty in areas characterized via complex terrain or unexpectedly changing wind regimes. Nevertheless, it affords a reliable first-order approximation suitable for preliminary spatial interpolation of wind parameters and subsequent estimation of wind velocity distribution throughout the examine region. The steps of this approach are offered in the wind statistics processing diagram from the Global Wind Atlas, which illustrates the method of extraction, processing, and analysis of facts from the GWA within the context of comparing the wind capability of the Adrar area (Figure 2).

Figure 2. Linear interpolation of monthly and seasonal Weibull parameters and mean wind speed
For the estimation of the Weibull distribution coefficients, we used the method of moments, based on the first and third-order moments [38]. The theoretical moments of the Weibull distribution are given by the following relation:
$M_n=C^n \Gamma\left(1+\frac{n}{k}\right)$ (4)
In order to estimate these parameters, the moment-based approach establishes relationships between statistical moments of wind speed and Weibull parameters through the dimensionless ratio d, defined as [38]:
$\begin{gathered}d=f(k)=\frac{\Gamma\left(1+\frac{3}{k}\right)}{\left(\Gamma\left(1+\frac{1}{k}\right)\right)^3}=\frac{M_3}{\left(M_1\right)^3}=\frac{\overline{v^3}}{(\bar{v})^3}=\frac{2 \bar{P}}{\rho S(\bar{v})^3}\end{gathered}$ (5)
This relationship allows for the estimation of the parameter k by numerically solving the inverse Eq. (6) [38].
$k=f^{-1}(d)$ (6)
Once k is determined, the scaling parameter C is calculated from the average speed according to relation (3).
2.4 Method validation
Data interpolation significantly reduces biases due to missing data, which is crucial for the accuracy of energy analysis.
The root mean squared error (RMSE) is a commonly used statistical measure to evaluate the performance of predictive models, particularly in contexts such as regression and time series modelling. It allows for the quantification of the average difference between the measured values and the values predicted by the model. The lower the RMSE value, the higher the model's accuracy [39], indicating a better match between the predictions and the actual observations. It is calculated using Eq. (7):
$R M S E=\sqrt{\frac{\sum_{i=1}^N\left(y_i-\widehat{y}_l\right)^2}{N}}$ (7)
where, yi is the actual value, ŷi is the value predicted by the model, and N is the number of data points.
The wind speed and wind power maps were extracted from the Global Wind Atlas website [36] and processed using the QGIS software. The results are presented in Figures 3 and 4.
Figure 3 presents the spatial distribution of the annual mean wind speed over the Adrar region at a height of 10 m above ground level. The wind speed classes range from less than 1 m/s to more than 7 m/s, clearly revealing spatial variations across the study area.

Figure 3. Annual wind speed map of the Adrar region at 10 m above ground

Figure 4. Annual wind power map of the Adrar region at 10 m above ground
The eastern and northeastern zones exhibit the highest wind speeds, often exceeding 7 m/s, represented by dark red shades on the map. These areas correspond to elevated plateaus and open desert landscapes where surface roughness is minimal and the pressure gradient is enhanced by regional circulation. Such wind regimes indicate excellent potential for wind energy development, as they provide consistent and strong airflow suitable for large-scale wind turbines.
In contrast, the central and southern parts of Adrar show moderate wind speeds ranging between 4 and 6 m/s (orange tones). These areas still offer viable wind resources, particularly for medium-capacity or hybrid wind-solar systems that can compensate for moderate wind intensity with high solar irradiance.
The western and southeastern sectors reveal lower wind speeds (below 3 m/s, in green and cyan tones). These regions are characterized by more complex terrain or higher surface roughness, which may reduce wind flow uniformity. Consequently, they are considered less favorable for wind energy generation unless micro-siting studies identify localized acceleration zones.
The annual map of wind energy density over the Adrar region, Algeria, derived from wind speed data measured at 10 m above ground level, provides a preliminary spatial assessment of the wind energy potential in the region. The gradation of wind power density over a gradient ranging from less than 100 W/m² to more than 410 W/m² reveals a significant spatial heterogeneity across the region. Some areas, especially the central and southern parts of Adrar, have moderate to high power density, indicating favorable conditions for wind energy utilization. This spatial variation reflects the influence of local topographic features, surface roughness and regional wind regimes that shape the distribution of wind resources.
However, the measurement height of 10 m represents a significant methodological limitation. Due to the combined effects of surface friction and atmospheric stability, wind speeds recorded near the surface are generally lower than those encountered at the hub height of modern wind turbines (typically between 50 m and 100 m). As a result, the calculated power density at 10 m underestimates the actual energy potential available at the operating height. When this discrepancy is taken into account, estimating wind speed at turbine height requires vertical extrapolation using logarithmic or power-law wind profiles that include site-specific parameters such as surface roughness length and stability ratio.
Despite this limitation, the map provided remains a valuable decision support tool for pre-screening potential wind farm sites. This effectively identifies areas of relative advantage where further on-site measurements and high-resolution numerical modeling can be prioritized. Nevertheless, for accurate feasibility assessment, additional data are needed, including long-term wind measurements, disturbance intensity, diurnal and seasonal variability, and vertical wind shear profiles. Integrating these parameters enables more reliable quantification of the economically exploitable wind energy resource, ensures better alignment with turbine design specifications and improves the accuracy of energy yield predictions.
In this study, available wind data are limited to measurements obtained from the meteorological station operated by the National Meteorological Office (ONM) at Touait Airport [28]. This unmarried station provides a non-stop document of wind velocity and path, and gives a precious reference factor for characterizing nearby wind behaviour. While, the spatial coverage of this records set may be very restrained and consequently inadequate to capture the whole variability of the wind regime over the wider Adrar area, that's characterized with the aid of complicated terrain and heterogeneous surface conditions. As a result, data from Touait Airport is primarily used for comparative analysis and validation purposes, to assess consistency between measured measurements and predicted wind characteristics through regional wind atlases. This comparative approach supports the assessment of the reliability and representativeness of modeled data, which is essential for preliminary wind resource assessment and potential site identification.
From the measured data, we calculated the Weibull parameters and the average annual and seasonal hourly speed, which allow us to plot the Weibull curves and frequency histograms (Figures 5 and 6).

Figure 5. Annual Weibull curve and frequency histogram of wind speeds at 10 meters above ground
Figure 5 highlights the annual Weibull curve and the frequency histograms. It is noted that the relative frequency for a wind speed in the range [5–6] m/s is equal to 19%, while that of calm winds [0.1-0.99] is equal to 5%. The estimated annual Weibull parameters are: the shape factor k is 2.25, indicating that this distribution is stable, the scale factor C is 6.6 m/s, and the average annual speed is 5.9 m/s.
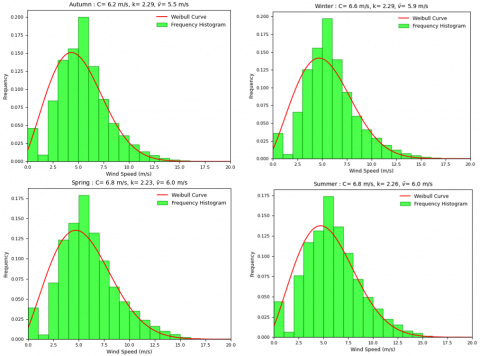
From the Weibull distributions and seasonal frequencies represented in Figure 6, we note the following points. The frequency of wind speeds in the range [5–6] m/s is approximately 19% in autumn and winter, and about 18% in spring and summer.
It is interesting to note in this context that the frequency accompanying calm speeds of 0.1 to 0.9 m/s hardly exceeds 5% regardless of the season studied.
Figure 6. Seasonal Weibull curves and speed frequency histograms

Figure 7. Annual wind rose
Figure 7 presents the wind rose obtained from the measured data.
We observe that the dominant wind direction is North-Northeast, representing a value equal to 14.6% of the wind frequency. This directional distribution confirms that the Adrar region benefits from a relatively stable wind regime.
In this section, we conclude that this site is suitable for wind energy production; it is of class 4 according to the PNL classification [6] with a good wind speed and a shape factor of approximately 2, which confirms that the distribution is stable. But since it is close to the airport and the possibility of finding other more favourable sites, we will use the interpolation method.
To validate the interpolation method, we calculated the Weibull parameters for the Touat site using the interpolation method, then we compared them to the results obtained from the measured data, the results are given in Table 2.
The analysis of the Weibull parameters (C and k) and the mean wind speeds (v̅), both measured and estimated, highlights a strong overall correlation between the modeled and observed data. The shape parameter (k) ranges from 1.4 to 2.1 for the estimated values and from 2.1 to 2.5 for the observed ones, indicating a moderate dispersion of wind speeds with greater stability during the summer months. The scale parameter (C) varies between 4.9 and 6.6 m/s for the estimated data and between 6.0 and 7.2 m/s for the observations, suggesting that the model slightly underestimates wind intensity, particularly in winter and spring. Similarly, the mean wind speed (v̅) is slightly lower in the estimates (4.4–5.9 m/s) compared to the measured values (5.3–6.4 m/s), with an average deviation of about 0.6 m/s. On a seasonal scale, the highest wind speeds are observed in spring and winter, while the lowest occur in autumn. At the annual level, the estimated parameters (C = 5.8, k = 1.6, v̅ = 5.2 m/s) are close to the observed ones (C = 6.6, k = 2.25, v̅ = 5.9 m/s), confirming that the Weibull model effectively reproduces the main trends of wind variability. These results demonstrate that Weibull-based modeling provides a consistent and realistic estimation of the wind potential in the studied region, with minor discrepancies attributable to local topographic effects and the spatial resolution of the data.
Table 2. Observed and estimated Weibull parameters and mean wind speed
|
Distribution |
Estimated |
Observed |
||||
|
C(m/s) |
k |
$\bar{v}(m / s)$ |
C(m/s) |
k |
$\bar{v}(m / s)$ |
|
|
January |
5.2 |
1.43 |
4.7 |
6.3 |
2.34 |
5.6 |
|
February |
6.0 |
1.59 |
5.4 |
6.9 |
2.24 |
6.1 |
|
March |
6.3 |
1.67 |
5.6 |
7.1 |
2.3 |
6.3 |
|
April |
6.5 |
1.78 |
5.8 |
7.2 |
2.13 |
6.3 |
|
May |
6.6 |
1.87 |
5.9 |
7.2 |
2.26 |
6.4 |
|
June |
6.3 |
1.95 |
5.6 |
6.7 |
2.19 |
5.9 |
|
July |
6.2 |
2.05 |
5.5 |
7.1 |
2.31 |
6.3 |
|
August |
5.8 |
1.99 |
5.2 |
6.8 |
2.37 |
6.0 |
|
September |
5.8 |
1.86 |
5.1 |
6.3 |
2.10 |
5.6 |
|
October |
5.4 |
1.7 |
4.8 |
6.3 |
2.26 |
5.6 |
|
November |
4.9 |
1.47 |
4.4 |
6.0 |
2.25 |
5.3 |
|
December |
5.0 |
1.00 |
4.5 |
6.3 |
2.52 |
5.6 |
|
Autumn |
5.2 |
1.59 |
4.7 |
6.2 |
2.29 |
5.5 |
|
Winter |
5.7 |
1.53 |
5.1 |
6.6 |
2.29 |
5.9 |
|
Spring |
6.1 |
1.72 |
5.4 |
6.8 |
2.23 |
6.0 |
|
Summer |
6.0 |
1.96 |
5.3 |
6.8 |
2.26 |
6.0 |
|
Annual |
5.8 |
1.63 |
5.2 |
6.6 |
2.25 |
5.9 |
The RMSE computed between the observed and estimated Weibull parameters is summarized in Table 3.
Table 3. The root mean squared error (RMSE) computed between the observed and estimated Weibull parameters
|
Distribution |
C(m/s) |
k |
$\bar{v}(m / s)$ |
|
Monthly |
0.19 |
0.21 |
0.26 |
|
Seasonal |
0.11 |
0.09 |
0.16 |
|
Annual |
0.06 |
0.05 |
0.12 |
Monthly values had the biggest variance, with RMSE values of 0.19 for the scale parameter (C), 0.21 for the shape parameter (k), and 0.26 for the average wind speed $(\overline{\boldsymbol{v}})$. These increased inaccuracies reflect the considerable short-term variability of wind regimes. Seasonally, RMSE reduces to $0.11, 0.09$, and 0.16 for $C, k$ of, and $\overline{\boldsymbol{v}}$, respectively. This demonstrates that seasonal aggregation efficiently reduces variability while improving parameter stability. The annual scale had the fewest mistakes, with RMSE values of 0.06, 0.05, and 0.12, demonstrating that the long-term mean produces the most accurate and dependable estimations of the Weibull distribution parameters.
Overall, the map highlights considerable spatial heterogeneity in the Adrar wind regime. The northeastern corridor emerges as the most promising zone for wind farm deployment due to its high and consistent wind speeds, while central areas remain suitable for smaller decentralized systems. This spatial pattern aligns with the regional atmospheric dynamics of southern Algeria, dominated by strong trade winds and desert convection effects.
The map made it possible to identify suitable locations for the installation of wind turbines. To validate these results, the wind data were analyzed using approximately 86,000 data points. From this dataset, four sites were selected as the most appropriate, considering both wind speed and the geotechnical characteristics of the terrain [26]. Areas exhibiting particularly high wind speeds were clearly highlighted. The geographical coordinates and annual wind speed distributions of the selected sites are summarized in Table 4, while these locations are illustrated in Figure 8.
The monthly and seasonal wind speed distribution at the chosen locations was estimated using linear interpolation following the identification of the most advantageous wind potential areas throughout the region, despite its simplicity, this method offers a trustworthy way to approximate how a continuous variable will behave between discrete measurement points. The interpolated results, which reflect the temporal distribution of wind speeds throughout the year, are summarized in Table 5.
Table 4. Weibull parameters at 10 m height for optimal wind farm sites
|
Site |
Longitude |
Latitude |
C(m/s) |
k |
$\bar{v}(m / s)$ |
|
A |
1.17°E |
27.70°N |
8.9 |
1.86 |
7.9 |
|
B |
1.10°E |
27.45°N |
7.9 |
1.84 |
7.0 |
|
C |
1.42°E |
27.31°N |
8.0 |
1.95 |
7.1 |
|
D |
1.37°E |
24.66°N |
7.7 |
1.47 |
7.0 |
Table 5. Monthly and seasonal wind speed distribution for selected sites at 10 m from ground
|
Distribution |
A |
B |
C |
D |
||||||||
|
C(m/s) |
k |
$\overline{\boldsymbol{v}}$ (m/s) |
C(m/s) |
k |
$\overline{\boldsymbol{v}}$ (m/s) |
C(m/s) |
k |
$\overline{\boldsymbol{v}}$ (m/s) |
C(m/s) |
k |
$\overline{\boldsymbol{v}}$ (m/s) |
|
|
January |
9.8 |
2.00 |
8.6 |
8.7 |
1.98 |
7.7 |
8.8 |
2.08 |
7.8 |
8.5 |
1.61 |
7.6 |
|
February |
9.4 |
1.88 |
8.4 |
8.4 |
1.86 |
7.4 |
8.5 |
1.98 |
7.5 |
8.1 |
1.41 |
7.4 |
|
March |
9.8 |
1.90 |
8.7 |
8.7 |
1.88 |
7.7 |
8.8 |
1.99 |
7.8 |
8.5 |
1.52 |
7.6 |
|
April |
10.1 |
2.00 |
8.9 |
8.9 |
1.98 |
7.9 |
9.0 |
2.08 |
8.0 |
8.7 |
1.61 |
7.8 |
|
May |
10.0 |
2.05 |
8.9 |
8.9 |
2.03 |
7.9 |
9.1 |
2.13 |
8.0 |
8.8 |
1.70 |
7.9 |
|
June |
9.4 |
2.14 |
8.3 |
8.4 |
2.13 |
7.5 |
8.5 |
2.23 |
7.5 |
8.3 |
1.85 |
7.4 |
|
July |
9.2 |
2.18 |
8.1 |
8.3 |
2.17 |
7.3 |
8.4 |
2.27 |
7.4 |
8.2 |
1.90 |
7.3 |
|
August |
8.5 |
2.05 |
7.5 |
8.0 |
2.35 |
7.0 |
7.8 |
2.45 |
6.9 |
7.7 |
1.37 |
6.8 |
|
September |
8.6 |
2.16 |
7.6 |
7.7 |
2.14 |
6.9 |
7.8 |
2.25 |
6.9 |
7.7 |
1.86 |
6.9 |
|
October |
8.2 |
1.96 |
7.2 |
7.3 |
1.94 |
6.5 |
7.4 |
2.06 |
6.6 |
7.3 |
1.56 |
6.5 |
|
November |
7.6 |
1.85 |
6.8 |
6.7 |
1.83 |
6.0 |
6.8 |
1.95 |
6.1 |
6.4 |
1.41 |
5.8 |
|
December |
6.4 |
2.19 |
5.6 |
5.1 |
2.09 |
4.5 |
5.4 |
2.10 |
4.8 |
5.6 |
2.13 |
5.0 |
|
Autumn |
8.0 |
1.88 |
7.1 |
7.1 |
1.85 |
6.3 |
7.2 |
1.97 |
6.4 |
6.9 |
1.46 |
6.3 |
|
Winter |
8.9 |
1.81 |
7.9 |
7.9 |
1.79 |
7.0 |
8.0 |
1.90 |
7.1 |
7.7 |
1.38 |
7.0 |
|
Spring |
9.3 |
1.91 |
8.3 |
8.3 |
1.89 |
7.3 |
8.4 |
2.00 |
7.4 |
8.1 |
1.55 |
7.3 |
|
Summer |
9.3 |
2.68 |
8.3 |
8.2 |
2.53 |
7.3 |
8.4 |
2.55 |
7.5 |
8.4 |
2.58 |
7.4 |
|
Annual |
8.9 |
1.86 |
7.9 |
7.9 |
1.84 |
7.0 |
8.0 |
1.95 |
7.1 |
7.7 |
1.47 |
7.0 |

Figure 8. Position of the windy sites in Adrar
With mean values ranging from 8 to 8.9 m/s, the results clearly show that spring and winter have the highest recorded wind speeds. These times line up with increased air mass movements brought on by Mediterranean and Saharan interactions as well as the strengthening pressure gradients. On the other hand, mean wind speeds are lowest in the fall and early winter, usually ranging from 6 to 7 m/s, indicating calmer air and less pronounced pressure gradients. According to this seasonal contrast, the best conditions for wind energy generation happen in the spring and winter, while the worst conditions happen in late autumn.
For all locations and seasons, the Weibull shape parameter (k), which measures wind speed uniformity, ranges from 1.37 to 2.58. A more stable and less turbulent wind regime is indicated by higher values of k (above 2), especially in the spring and summer. This is beneficial for wind turbine operation because it reduces mechanical stress. Greater variability and intermittency in wind speeds are suggested by lower k values (about 1.38–1.81), which are primarily observed in the fall and early winter. These variations are frequently linked to orographic effects, local convection, and shifting synoptic patterns.
The scale parameter (C) follows a pattern similar to the mean wind speed, confirming the internal consistency of the Weibull model. Its values range from approximately 7 m/s in November–December to over 10 m/s in March–May, emphasizing the dominance of strong and persistent winds during the transitional seasons. The close correlation between C and supports the reliability of the Weibull approach for characterizing wind climatology.
Spatially, clean variations emerge a number of the selected sites:
Site A continually famous the highest scale and suggest wind velocity values, identifying it because the most promising location for wind energy exploitation;
Site B and Site C show intermediate wind characteristics with relatively clean seasonal cycles, making them suitable for medium-scale installations;
Site D, alternatively, information the bottom wind speeds and form parameters, reflecting a greater irregular and much less energetic wind regime, possibly due to local topographic affects or regional wind shadow results.
Overall, the once-a-year common wind speeds range between 7 and 7.9 m/s, which locations the studied websites within the mild to true wind capability class according to global wind resource class, the consistency of the Weibull parameters, particularly in the course of the excessive-power seasons, confirms that these regions keep good sized capacity for sustainable wind power development, provided that local site checks are conducted to optimize turbine placement and overall performance.
This study highlights a significant wind energy potential in the Adrar region, with annual wind speeds exceeding 7 m/s in the northeastern zones, making them suitable for large-scale turbine installation, Weibull parameter analysis, validated through interpolation and comparison with measured data, demonstrates high reliability and seasonal stability, particularly in spring and summer, central and southern areas, characterized by moderate wind speeds, remain suitable for medium-scale or hybrid systems. Four optimal sites were identified based on wind intensity and topographic conditions to maximize energy production. These findings provide a solid foundation for sustainable wind energy development in the Adrar wilaya, enabling the strategic placement and efficient operation of wind turbines.
The authors are grateful for the support and facilities provided by Unité de Recherche Matériau et Energie Rénovables (URMER), Université de Tlemcen, Tlemcen 01300, Algeria and Unité de Recherche en Energies Rénovables en Milieu Saharan (URERMS), Center de Déve Rénovement des Energies, (CDER), Adrar 01000, Algeria. His help and resources were invaluable in completing this task.
|
C |
Scale parameter (m/s) |
|
k |
Shape parameter |
|
P |
Power (W) |
|
S |
Wind turbine section (m²) |
|
v |
Wind speed (m/s) |
|
$\bar{v}$ |
Velocity (m/s) |
|
Greek symbols |
|
|
ρ |
Standard air density (kg/m3) |
|
Γ |
Gamma function |
|
Subscripts |
|
|
f(v) |
Frequency distribution |
[1] Abderrahim, A. (2024). Réactualisation du gisement éolien dans le sud Algérien: Cas d'une ferme éolienne et son impact sur l'environnement. Doctoral dissertation, Université Abou Bekr Belkaid de Tlemcen.
[2] Boudia, S.M. (2013). Optimisation de l'évaluation temporelle du gisement énergétique éolien par simulation numérique et contribution à la réactualisation de l'atlas des vents en Algérie. Doctoral dissertation, Université Abou Bekr Belkaid de Tlemcen.
[3] Kadbadji Marzouk, N. (2006). Evaluation du gisement énergétique: Contribution à la détermination du profil vertical de la vitesse du vent en Algérie. Doctoral dissertation, Université Abou Bekr Belkaid de Tlemcen.
[4] Benmedjahed, M., Maouedj, R., Mouhadjer, S., Menni, Y., Ameur, H., Dahbi, A., Saba, D., Touahri, T. (2021). Analysis of the wind resources in Saharan Atlas of Algeria: Adrar region as a case study. Iranian Journal of Energy and Environment, 12(2): 155-162. https://doi.org/10.5829/ijee.2021.12.02.08
[5] Boudia, S.M., Santos, J.A. (2019). Assessment of large scale wind resource features in Algeria. Energy, 189: 116299. https://doi.org/10.1016/j.energy.2019.116299
[6] Boudia, S.M., Benmansour, A., Ghellai, N., Benmedjahed, M., Tabet Hellal, M.A. (2012). Monthly and seasonal assessment of wind energy potential in Mechria region, occidental highlands of Algeria. International Journal of Green Energy, 9(3): 243-255. https://doi.org/10.1080/15435075.2011.621482
[7] Boudia, S.M., Benmansour, A., Ghellai, N., Benmedjahed, M., Tabet Hellal, M.A. (2013). Temporal assessment of wind energy resource at four locations in Algerian Sahara. Energy Conversion and Management, 76: 654-664. https://doi.org/10.1016/j.enconman.2013.07.086
[8] Guarienti, J.A., Almeida, A.K., Neto, A.M., de Oliveira Ferreira, A.R., Ottonelli, J.P., de Almeida, I.K. (2020). Performance analysis of numerical methods for determining Weibull distribution parameters applied to wind speed in Mato Grosso do Sul, Brazil. Sustainable Energy Technologies and Assessments, 42: 100854. https://doi.org/10.1016/j.seta.2020.100854
[9] Abderrahim, A., Ghellai, N., Bouzid, Z., Menni, Y. (2019). Wind energy resource assessment in south western of Algeria. Mathematical Modelling of Engineering Problems, 6(2): 157-162. https://doi.org/10.18280/mmep.060202
[10] Benmedjahed, M., Maouedj, R. (2019). Assessment of acoustic impact for the wind farm in Algeria. In 2019 1st Global Power, Energy and Communication Conference (GPECOM), Nevsehir, Turkey, pp. 316-320. https://doi.org/10.1109/gpecom.2019.8778498
[11] Benmedjahed, M., Ghellai, N., Benmansour, A., Boudia, S., Hellal, M.T. (2014). Assessment of wind energy and energy cost in Algeria. Journal of Renewable Energy and Smart Grid Technology, 9(1): 31-40. https://ph01.tcithaijo.org/index.php/RAST/article/view/26347.
[12] Benmedjahed, M., Mouhadjer, S. (2016). Evaluation of wind energy cost and site selection for a wind-farm in the south of Algeria. AIP Conference Proceedings, 1758(1): 030001. https://doi.org/10.1063/1.4959397
[13] Benmedjahed, M., Ghellai, N., Bouzid, Z., Chiali, A. (2015). Temporal assessment of wind energy resource in Adrar (south of Algeria); calculation and modeling of wind turbine noise. In 2nd International Congress on Energy Efficiency and Energy Related Materials (ENEFM2014), pp. 33-42. https://doi.org/10.1007/978-3-319-16901-9_5
[14] Benmedjahed, M., Boudaoud, L. (2015). Temporal assessment of wind energy resource in Algerian desert sites: Calculation and modelling of wind noise. Journal of Fundamentals of Renewable Energy and Applications, 5(3): 1-4. https://doi.org/10.4172/2090-4541.1000160
[15] Benmedjahed, M., Bouzid, Z., Ghellai, N. (2015). Wind potential assessment of Ain Salah in Algeria; calculation of the cost energy. International Journal of Energy and Power Engineering, 4(2): 38-42. https://doi.org/10.11648/j.ijepe.20150402.14
[16] Benmedjahed, M., Ghellai, N., Benmansour, A. (2012). Wind potential assessment of three coastal sites in Algeria: Calculation and modeling of wind turbine noise using Matlab. International Journal of Computer Applications, 56(2): 20-25. https://doi.org/10.5120/8864-2827
[17] Benmedjahed, M., Maouedj, R. (2017). L'impact d'un parc éolien sur l'environnement au sud Algérien. Editions Universitaires Europeennes.
[18] Benmdjahed, M., Maouedj, R. (2017). The Wind Farm Impact on the Environment in Tindouf. LAP LAMBERT Academic Publishing.
[19] Benmedjahed, M., Dahbi, A., Hadidi, A., Mouhadjer, S. (2021). Temperature and wind distribution effects on wind energy production in Adrar region (Southern Algeria). International Journal of Sustainable Development and Planning, 16(8): 1473-1477. https://doi.org/10.18280/ijsdp.160808
[20] Benmedjahed, M., Maouedj, R., Mouhadjer, S. (2017). Wind potential assessment of M'sila in Algerian highlands regions; modeling of wind turbine noise. Energy Procedia, 119: 642-649. https://doi.org/10.1016/j.egypro.2017.07.090
[21] Benmedjahed, M., Maouedj, R. (2018). Wind power assessment in Algeria; Methods development. In International Conference on Wind Energy Applications in Algeria (ICWEAA), Algiers, Algeria, pp. 1-6. https://doi.org/10.1109/icweaa.2018.8605049
[22] Benmedjahed, M., Maouedj, R. (2018). Technical and economic analysis of wind turbine system for isolated location at Adrar in Algeria. In 6th International Renewable and Sustainable Energy Conference (IRSEC), Rabat, Morocco, pp. 1-4. https://doi.org/10.1109/irsec.2018.8702948
[23] Benmedjahed, M., Maouedj, R., Mouhadjer, S., Dahbi, A., Saba, D., Touahri, T. (2020). Wind energy source assessment for four locations in the Adrar region: Southern Algeria. In 10th International Conference on Information Systems and Technologies, Lecce, Italy, pp. 1-6. https://doi.org/10.1145/3447568.3448535
[24] Benmedjahed, M., Maouedj, R., Mouhadjer, S. (2020). Wind energy resource assessment of desert sites in Algeria: Energy and reduction of CO2 emissions. International Journal of Applied Power Engineering, 9(1): 22-28. https://doi.org/10.11591/ijape.v9.i1.pp22-28
[25] Mehdi, M.B., Ghellai, N., Benmedjahed, M., Dahbi, A. (2024). Wind resource for Tindouf location in southern Algeria. International Journal of Sustainable Development and Planning, 19(2): 549-555. https://doi.org/10.18280/ijsdp.190212
[26] Benmedjahed, M., Dahbi, A., Hadidi, A., Khelfaoui, A., Mouhadjer, S., Djaafri, O. (2023). Adrar initial state investigation for the use of renewable energies in irrigation systems. International Journal of Sustainable Development and Planning, 18(6): 1671-1680. https://doi.org/10.18280/ijsdp.180603
[27] Atlas, T., Saf, B. (2024). A review of the wind resources in the Ain Temouchent Atlas (North Algeria); Beni Saf location as a case study. In The 5 th International Seminar on Avanced Mecahnical TechnologiesAt: Tlemcen.
[28] OurAirports. (2024). “Touat-Cheikh Sidi Mohamed Belkebir Airport (DAUA/AZR), Adrar, Algeria,” airport metadata page, coordinates 27.837601, -0.186414, elevation 919 ft. https://ourairports.com/airports/DAUA/.
[29] Teimourian, H., Abubakar, M., Yildiz, M., Teimourian, A. (2022). A comparative study on wind energy assessment distribution models: A case study on Weibull distribution. Energies, 15(15): 5684. https://doi.org/10.3390/en15155684
[30] Serban, A., Paraschiv, L.S., Paraschiv, S. (2020). Assessment of wind energy potential based on Weibull and Rayleigh distribution models. Energy Reports, 6: 250-267. https://doi.org/10.1016/j.egyr.2020.08.048
[31] Aziz, A., Tsuanyo, D., Nsouandele, J., Mamate, I., Mouangue, R., Elé Abiama, P. (2023). Influence of Weibull parameters on the estimation of wind energy potential. Sustainable Energy Research, 10(1): 5. https://doi.org/10.1186/s40807-023-00075-y
[32] Ayua, T.J., Emetere, M.E. (2023). Technical analysis of wind energy potentials using a modified Weibull and Raleigh distribution model parameters approach in the Gambia. Heliyon, 9(9): e20315. https://doi.org/10.1016/j.heliyon.2023.e20315
[33] Pavia, E.G., O'Brein, J.J. (1986). Weibull statistics of wind speed over the ocean. Journal of Applied Meteorology and Climatology, 25(10): 1324-1332. https://doi.org/10.1175/1520-0450(1986)025<1324:WSOWSO>2.0.CO;2
[34] Kidmo, D.K., Danwe, R., Djongyang, N., Doka, S.Y. (2014). Performance assessment of two-parameter Weibull distribution methods for wind energy applications in the district of Maroua in Cameroon. International Journal of Science: Basic and Applied Research, 17(1): 39-59.
[35] Indhumathy, D., Seshaiah, C.V., Sukkiramathi, K. (2014). Estimation of Weibull parameters for wind speed calculation at Kanyakumari in India. International Journal of Innovative Research in Science, Engineering and Technology, 3(1): 8340-8345.
[36] Global Wind Atlas. (2024). Global wind resource data. Technical University of Denmark (DTU) and World Bank Group. https://globalwindatlas.info.
[37] Gruber, K., Regner, P., Wehrle, S., Zeyringer, M., Schmidt, J. (2020). Towards a global dynamic wind atlas: A multi-country validation of wind power simulation from MERRA-2 and ERA-5 reanalyses bias-corrected with the Global Wind Atlas. arXiv preprint arXiv:2012.05648. https://doi.org/10.48550/arXiv.2012.05648
[38] Benmedjahed, M., Mouhadjer, S., Dahbi, A., Khelfaoui, A., Djaafri, O., Bouraiou, A. (2025). An overview of Adrar wind resources in Southern Algeria: Using wind atlases to compute wind distribution parameters. In Proceedings of the 3rd International Conference on Electronics, Energy and Measurement (IC2EM), Algiers, Algeria, pp. 1-5. https://doi.org/10.1109/ic2em63689.2025.11101047
[39] Hodson, T.O. (2022). Root-mean-square error (RMSE) or mean absolute error (MAE): When to use them or not. Geoscientific Model Development, 15(14): 5481-5487. https://doi.org/10.5194/gmd-15-5481-2022