Heru Prasadja![]() | Yerik Afrianto Singgalen*
| Yerik Afrianto Singgalen*![]()
© 2025 The authors. This article is published by IIETA and is licensed under the CC BY 4.0 license (http://creativecommons.org/licenses/by/4.0/).
OPEN ACCESS
Dense heritage districts face unique challenges in balancing cultural preservation with climate adaptation needs. This study integrates remote sensing and geographic information system (GIS) technologies to assess the potential for urban heat mitigation in Glodok, Jakarta’s historic Chinatown. Sentinel-2 (10 m) and Landsat-8 thermal imagery (30 m) from 2019 to 2023 were analyzed using Google Earth Engine to quantify the relationships between urban morphology and thermal patterns across a 12.56 km² study area. Spectral indices, including NDVI, NDBI, and BUI, were calculated to characterize urban morphology, revealing high spatial heterogeneity with a coefficient of variation of 453.96% for BUI. Correlation analysis revealed unexpectedly weak relationships between morphological indicators and LST (BUI-LST: r = 0.129; NDVI-LST: r = -0.071; NDBI-LST: r = 0.180), contrasting with strong inter-index correlations (NDVI-BUI: r = -0.918). These weak thermal correlations suggest that heritage district thermal dynamics are modulated by factors beyond simple vegetation-built environment relationships, including traditional building materials, complex shadow patterns, and anthropogenic heat sources. Mean NDVI of 0.101 indicates limited vegetation coverage, which is well below the 0.3-0.4 threshold for effective thermal regulation. Despite weak correlations, the analysis identified 27.2 hectares with intervention potential, comprising 15.3 hectares suitable for green infrastructure and 8.7 hectares suitable for cool roof implementation. The findings highlight the need for comprehensive heat mitigation strategies that address multiple heat sources beyond morphological modification alone while respecting heritage preservation constraints.
urban heat island, heritage conservation, green infrastructure, sustainable planning, Google Earth Engine, Glodok
The rapid urbanization of Southeast Asian cities has created an urgent need for innovative approaches to sustainable spatial planning, particularly in dense heritage districts where historical preservation requirements intersect with contemporary environmental challenges. Jakarta's Glodok Chinatown exemplifies this complex dynamic, representing one of Asia's oldest continuously operating commercial districts while simultaneously experiencing intensifying urban heat island effects that compromise both livability and heritage preservation [1]. Traditional urban planning paradigms often position cultural conservation and environmental sustainability as competing priorities, overlooking the potential for synergistic solutions that enhance thermal comfort while respecting architectural heritage [2, 3]. The integration of remote sensing and geographic information system (GIS) offers transformative possibilities for evidence-based planning that identifies heat mitigation opportunities within the unique constraints of heritage contexts. This research demonstrates how geospatial technologies can bridge the gap between preservation imperatives and climate adaptation needs, establishing a replicable framework for sustainable development in historically significant urban areas.
This study employs an integrated remote sensing and GIS analytical framework to investigate urban heat patterns and identify mitigation potential within Jakarta's Glodok heritage district. The methodological approach combines multi-temporal satellite imagery analysis with spatial statistics to quantify the relationships between urban morphology and thermal characteristics across the study area [4-6]. Cloud-based processing through Google Earth Engine enables the systematic examination of vegetation dynamics, intensification of the built environment, and variations in land surface temperature over five years [7, 8]. The investigation maps identify suitable locations for green infrastructure interventions while evaluating the potential for cool surface implementation on existing structures. This comprehensive spatial analysis develops a prioritization framework for heat mitigation strategies that balance effectiveness with heritage preservation requirements, providing actionable insights for sustainable spatial planning in dense commercial districts.
Glodok represents an ideal case study for examining sustainable planning challenges in Asian heritage districts, where centuries of organic urban development have created unique spatial configurations that contribute to and potentially mitigate heat accumulation. The recent commercial intensification of the district reflects broader regional economic growth trends, placing pressure on the historical urban fabric while simultaneously reducing vegetation cover and increasing impervious surfaces [9]. This transformation takes place within a complex governance context, where multiple stakeholders, including heritage authorities, municipal planners, property owners, and resident communities, hold differing perspectives on appropriate development pathways [10]. The dense building configuration, narrow streets, and limited open space present both challenges and opportunities for innovative cooling strategies that work within existing spatial constraints. Through systematic geospatial analysis, understanding these dynamics provides crucial insights for developing context-sensitive interventions that enhance environmental performance without compromising cultural authenticity.
Despite the growing recognition of urban heat impacts on heritage districts, critical knowledge gaps persist that limit effective intervention planning. Previous RS-GIS studies have predominantly focused on either thermal analysis of contemporary urban areas with planning flexibility [11-13] or conservation planning in historical contexts without thermal considerations [14, 15], rarely integrating both dimensions. Specifically, no studies have adapted standard UHI assessment metrics (NDVI, NDBI, LST correlations) for heritage environments where building modifications face strict limitations and conventional green infrastructure solutions are spatially constrained. The literature reveals limited application of high-resolution satellite imagery (≤ 10 m) combined with thermal analysis for identifying micro-scale intervention opportunities within preservation frameworks [16, 17]. Furthermore, existing urban cooling strategies assume planning flexibility for structural modifications, lacking systematic adaptation for heritage contexts where even minor façade changes require extensive approval processes [18-20]. This research directly addresses these gaps by demonstrating how modified RS-GIS analytical frameworks can quantify heat mitigation potential while respecting cultural preservation requirements, providing a methodological bridge between environmental science and heritage planning disciplines that has been absent in previous studies.
This research makes several significant contributions to sustainable urban planning theory and practice by establishing an empirical framework for assessing heat mitigation potential in constrained heritage environments. The integrated RS-GIS methodology provides planners with practical tools for identifying intervention opportunities that maximize cooling benefits while minimizing heritage impacts, moving beyond theoretical discussions toward actionable spatial strategies [21-24]. The multi-temporal analysis reveals how morphological changes in heritage districts amplify thermal stress, offering insights into the unmanaged commercial intensification's environmental consequences [25, 26]. The practical significance extends beyond academic contributions to directly support decision-making processes for heritage conservation authorities. The developed framework enables conservation officers to visualize thermal hotspots overlaid with heritage restriction zones, facilitating evidence-based prioritization of limited conservation budgets. Municipal planners can utilize the identified 27.2-hectare intervention potential map to negotiate between competing stakeholder interests, demonstrating where cooling interventions align with heritage preservation goals.
Although this research provides comprehensive insights into heat mitigation potential within Glodok's heritage district, several considerations shape the findings' interpretation and application. The satellite-based analysis captures district-scale thermal patterns but cannot fully represent the complex microclimatic variations within narrow alleyways and covered markets that characterize traditional commercial areas. Seasonal variations and weather patterns influence thermal measurements, suggesting the need for continuous monitoring to establish robust baseline conditions. The identified mitigation opportunities require further evaluation through feasibility studies that consider implementation costs, maintenance requirements, and community acceptance. Future research should explore the integration of street-level thermal sensors with satellite observations to create more comprehensive heat maps, develop three-dimensional models to simulate wind flow and shading effects in complex urban geometries, and conduct pilot implementations to validate predicted cooling benefits. Expanding this methodology to other heritage districts in Southeast Asia would establish comparative benchmarks and identify transferable strategies for sustainable spatial planning in similar contexts.
The transferability of this methodology to other tropical heritage districts represents a critical contribution to regional climate adaptation efforts. Cities such as Melaka's Jonker Street, Hoi An's Ancient Town, Penang's George Town, and Bangkok's Chinatown face similar challenges balancing preservation with thermal comfort in dense commercial environments. By establishing standardized assessment protocols using freely available satellite data and open-source processing platforms, this research enables resource-constrained heritage authorities across Southeast Asia to conduct comparable analyses without expensive proprietary systems. The framework's applicability extends beyond individual districts to support regional policy initiatives, including ASEAN heritage city networks, UNESCO World Heritage climate adaptation programs, and bilateral conservation partnerships. This regional perspective transforms isolated technical studies into coordinated policy action for climate-resilient heritage management.
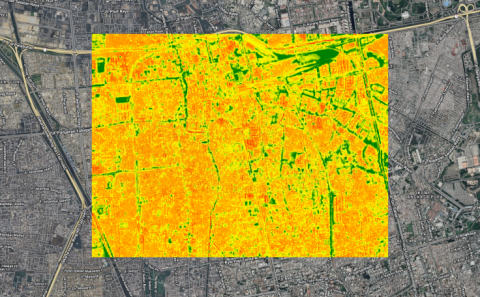
The Glodok heritage district encompasses approximately 12.56 km2 of the Jakarta Barat municipality. The district is characterized by dense commercial architecture dating from the Dutch colonial period and represents one of Southeast Asia’s oldest continuously operating Chinatown districts [27]. The study area extends in a two-kilometer radius from the historic commercial center, bounded by major arterial roads including Jalan Gajah Mada to the east and Jalan Pancoran to the south, encompassing traditional markets, religious structures, and mixed-use chophouse configurations [28]. The urban morphology reflects centuries of organic development with narrow alleyways, compact building footprints, and minimal open space, creating a unique microclimate characterized by restricted air circulation and concentrated thermal mass. Despite the extraordinary building density, the district maintains functional urban systems, with commercial activities operating across multiple vertical levels and using every available space for economic purposes. During peak hours, current thermal conditions regularly exceed comfort thresholds, with significant variations in surface temperatures between shaded traditional courtyards and exposed concrete surfaces, establishing a complex baseline for assessing heat mitigation potential within heritage preservation constraints.
Figure 1 shows the study area location in Glodok heritage district boundaries, major landmarks and thermal sampling points. Glodok’s economic structure revolves around wholesale trading, traditional medicine, religious artifacts, and culinary enterprises, supporting approximately 50,000 residents and attracting thousands of daily visitors for commercial and cultural activities [29]. The district operates through intricate social networks that link family businesses, religious organizations, and trade associations that have evolved over generations, creating resilient economic systems that adapt to spatial constraints [30]. Recent modernization pressures have intensified vertical development and commercial densification, resulting in the replacement of traditional building materials with heat-absorbing concrete and metal structures while reducing vegetation cover through courtyard conversions. The relationship between economic vitality and environmental quality creates management tensions as business operators prioritize revenue-generating floor space over thermal comfort considerations. This socio-spatial dynamic exemplifies fundamental challenges in balancing economic development with environmental sustainability, particularly when cultural heritage preservation adds another layer of complexity that necessitates careful negotiation between multiple stakeholder interests and competing urban development objectives.
The Jakarta Provincial Government has designated Glodok as a strategic heritage conservation area through Governor Regulation concerning Cultural Heritage Protection, establishing strict guidelines for architectural modifications while promoting the development of cultural tourism [31]. Environmental management frameworks, including Jakarta’s Climate Action Plan, target temperature reduction and green space expansion, although implementation mechanisms for heritage districts with limited intervention flexibility remain unclear. Recent initiatives have emphasized nature-based solutions and sustainable urban development aligned with national commitments to climate adaptation and building resilience. The integration of heritage preservation with environmental sustainability reflects the evolving governance approaches that acknowledge the need for traditional conservation strategies to adapt to contemporary climate challenges. The regulatory landscape reveals persistent gaps between high-level policy objectives and practical implementation tools, particularly regarding financial incentives for property owners to adopt cooling technologies and coordination mechanisms between heritage authorities and environmental agencies. These institutional complexities underscore the need for evidence-based spatial planning frameworks that demonstrate achievable synergies between cultural preservation and thermal comfort improvement.
Figure 2 shows the development of cultural tourism in Chinatown, located in Glodok heritage district. Contemporary assessments indicate that the intensity of the urban heat island in Glodok significantly exceeds that of surrounding residential areas, with thermal differentials most pronounced during afternoon peaks and persisting into evening hours due to concentrated thermal mass. The vegetation coverage of the district has substantially declined over recent decades, with the remaining green spaces confined to temple courtyards and scattered rooftop gardens insufficient for meaningful cooling effects. The building density metrics reveal that Jakarta has the highest floor area ratios, with vertical expansion compensating for horizontal constraints while worsening heat accumulation through reduced sky view factors. Infrastructure characteristics include predominantly narrow streets limiting vehicular access but potentially suitable for pedestrian-oriented green corridors, aging drainage systems requiring integration with any green infrastructure proposals, and electrical grids approaching capacity limits that constrain large-scale mechanical cooling adoption. This environmental baseline demonstrates the critical intersection of thermal stress, heritage architecture, and urban functionality, establishing clear parameters for evaluating intervention strategies that must operate within existing spatial, regulatory, and social constraints while delivering measurable improvements in thermal comfort and environmental quality.
The methodological framework employed in this study integrates dual-sensor remote sensing data acquisition with GIS spatial analysis to assess the potential for reducing heat in urban areas. The selection of Sentinel-2 MSI (10 m) and Landsat-8 OLI/TIRS (30 m) for analyzing Glodok's dense heritage district required careful consideration of sensor capabilities versus spatial constraints. While Glodok's narrow alleyways (typically 2-4 m width) fall below both sensors' spatial resolution, Sentinel-2's 10 m resolution captures building block aggregations and courtyard spaces that represent the primary intervention opportunities within heritage constraints. The coarser Landsat-8 thermal data (30 m) inevitably experiences mixed-pixel effects where narrow streets are aggregated with adjacent buildings, potentially underestimating temperature variations between shaded alleys and exposed rooftops by 2-4℃ based on typical urban thermal gradients. However, this dual-sensor approach remains optimal given current satellite capabilities, as Sentinel-2 lacks thermal bands while higher-resolution commercial thermal sensors offer insufficient temporal coverage for multi-year analysis. To address mixed-pixel limitations, our analysis focuses on identifying intervention zones at the building block scale (> 100m²) rather than individual alleyways, aligning with practical implementation constraints where heritage regulations typically approve district-level rather than building-specific modifications. The satellite imagery from 2019 to 2023 was systematically processed using the Google Earth Engine cloud computing infrastructure, synthesizing spectral index calculations from Sentinel-2 (NDVI, NDBI, BUI) with thermal analysis from Landsat-8 Surface Temperature Band 10 (ST_B10) to establish quantitative baselines for intervention planning.
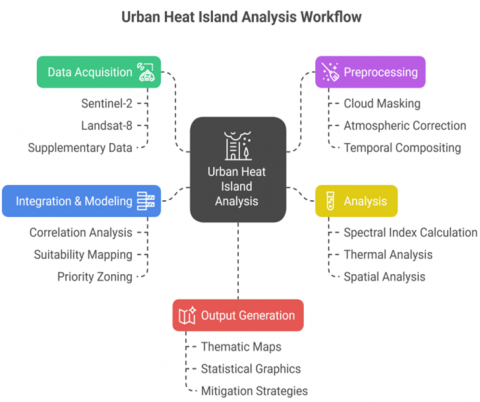
Figure 3 shows the methodological workflow of data acquisition, processing, analysis, and output generation phases. The methodology follows an organized workflow that begins with satellite data acquisition and preprocessing and proceeds through multiple analytical phases to achieve actionable spatial planning recommendations. The initial procedures involved cloud-based filtering of optical imagery using quality assessment bands to ensure minimal atmospheric interference, radiometric calibration and atmospheric correction to derive surface reflectance values, and geometric clipping to study area boundaries. The integration of multi-resolution datasets through resampling and co-registration techniques enables synergistic analysis of detailed morphological patterns and thermal characteristics. The analysis then transitions toward integrated assessment phases, in which spectral indices converge with temperature measurements to identify intervention opportunities through suitability mapping algorithms focusing on green infrastructure potential and feasibility of cool surface implementation. This systematic analytical process culminates in the development of spatially explicit mitigation strategies using quantifiable thermal reduction projections and priority zone mapping, establishing direct operational links between satellite-derived environmental indicators and practical implementation of sustainable cooling interventions for heritage district planning.
Land surface temperature extraction from Landsat-8 employed the pre-calculated surface temperature product (ST_B10) with scaling factors of 0.00341802 and an offset of 149.0, converting from scaled units to Kelvin, then to Celsius by subtracting 273.15. The temporal alignment challenge between optical and thermal measurements was acknowledged, with both Sentinel-2 (10:30 am) and Landsat-8 (10:45 am) acquisitions occurring during morning hours rather than afternoon thermal peaks. To address the scale mismatch between 10 m morphological indices and 30 m thermal data, correlation analysis was conducted through spatial aggregation of Sentinel-2 indices at a coarser 30 m resolution. The mixed-pixel challenge in Glodok's dense morphology means each 30 m thermal pixel encompasses approximately 900 m² containing multiple buildings, alleyways, and courtyards with heterogeneous thermal properties, leading to systematic averaging of extreme temperatures. This aggregation effect results in underestimation of maximum temperatures from exposed surfaces and overestimation of minimum temperatures from shaded areas, with estimated uncertainty of ± 2-3℃ based on comparable urban studies. Despite these limitations, the 30 m thermal resolution remains sufficient for district-scale planning decisions, as heritage intervention policies operate at building block rather than individual structure levels. A stratified random sampling approach generated 500 points across the study area, with each point buffered by 30 m to match the Landsat thermal pixel size and minimize edge effects. Sample points were distributed proportionally across the land cover classes identified through preliminary classification to ensure representative coverage of the urban morphological conditions.
Statistical validation employed Pearson correlation coefficients calculated from 500 sample points to examine relationships between morphological indices and thermal patterns, with Bonferroni correction applied for multiple comparisons (adjusted α = 0.008). Classification accuracy assessment using 150 validation points interpreted from Google Earth imagery achieved 82.3% overall accuracy with a kappa coefficient of 0.76. The absence of ground-based temperature measurements represents a significant limitation, with LST validation relying solely on internal consistency checks and temporal stability analysis. Uncertainty propagation analysis indicates a cumulative error of ± 2.5℃ for LST measurements and ± 15% for area calculations. The 27.2 hectares of identified mitigation potential was derived through multi-criteria overlay analysis incorporating temperature thresholds (> 32℃), available space (> 100 m²), modifiable surface indicators (BUI between -0.2 and 0.3), and absence of heritage restrictions, with areas meeting three or more criteria classified as high potential for intervention.
Contemporary urban planning in heritage districts requires sophisticated analytical frameworks that integrate thermal comfort objectives with cultural preservation constraints. This study employs a dual-track methodology to examine the characteristics of Glodok’s urban heat island through both spatial-temporal analysis and statistical modeling to assess the complex relationships between urban morphology, thermal patterns, and mitigation potential in Jakarta’s historic Chinatown district.
4.1 Temporal and spatial analysis
The implementation of remote sensing analysis for Glodok heritage district reveals significant urban transformation patterns that demonstrate both the challenges and opportunities of sustainable planning in dense commercial areas. The mean built-up index of 0.0436 with an extremely high coefficient of variation (453.96%) indicates substantial spatial heterogeneity within the district, ranging from -1.1755 to 0.5744, suggesting a complex mosaic of built and non-built areas rather than uniform densification. The vegetation coverage measured through NDVI shows a mean value of 0.1013, indicating low overall vegetation presence, although the range from -0.1796 to 0.7908 reveals pockets of significant green space alongside completely barren zones. The standard deviation of 0.1155 and coefficient of variation of 114.03% confirm high spatial variability in vegetation distribution, highlighting the fragmented nature of green infrastructure within the heritage district.
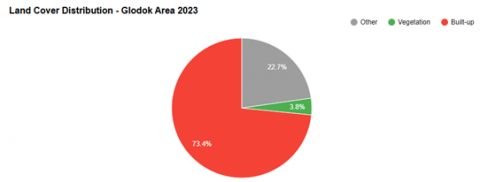
The overall accuracy of the land cover classification was 82.3%, with a Kappa coefficient of 0.76 based on 150 validation points, indicating that the classification method reliably discriminated between urban morphological classes. The classification results reveal that built-up areas constitute 71.6% of the study area, with vegetation covering only 3% and water bodies representing 2%, while the remaining 23.4% comprises mixed or undefined surfaces. These proportions, derived from 10 m Sentinel-2 imagery, provide higher spatial detail than previous assessments while acknowledging ± 15% uncertainty in area calculations due to classification ambiguities and edge effects.
Figure 4 shows the distribution of land cover in research area. Spatial distribution analysis reveals distinctive morphological patterns that illuminate both development pressures and preservation opportunities within the complex urban fabric of the district. The mean value of the normalized difference built-up index was 0.1449, with a standard deviation of 0.1027, indicating that the intensity was moderate but variable across the study area. The 70.86% coefficient of variation for NDBI, which is substantially lower than the BUI’s 453.96%, suggests more consistent patterns in built-up detection than the composite built-up index. The range from -0.3967 to 0.5154 for NDBI encompasses both water bodies (negative values) and highly developed areas (positive values), confirming the heterogeneous land cover within the 2-kilometer radius study area centered at coordinates -6.1449°S, 106.8149°E.
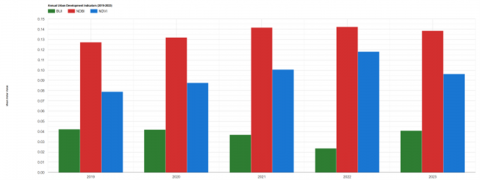
Figure 5 shows the annual urban development indicators based on Sentinel-2 imagery data from 2019 to 2023. The assessment of inter-index relationships reveals strong morphological associations that validate the analytical framework while highlighting unexpected thermal dynamics. The remarkably strong negative correlation between NDVI and BUI (r = -0.9182) confirms the fundamental trade-off between vegetation and BUI, with urban development directly displacing green space. The strong positive correlation between NDBI and BUI (r = 0.8951) validates the consistency of built-up detection across different SIs. The moderate negative correlation between NDVI and NDBI (r = -0.6453) further reinforces the inverse relationship between vegetation and built surfaces. These robust inter-index correlations demonstrate the reliability of spectral analysis in characterizing urban morphology within heritage contexts.
4.2 Statistical analysis and planning implications
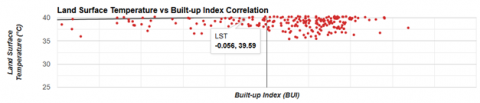
Correlation analysis was conducted between Sentinel-2 (10 m) morphological indicators and Landsat-8 (30 m) land surface temperature using 500 stratified random sample points, with spatial aggregation ensuring scale compatibility. The correlation coefficients reveal unexpectedly weak relationships that challenge the assumptions of conventional urban heat islands, with all thermal correlations falling below the significance threshold after Bonferroni correction (adjusted α = 0.008). The correlation coefficient between BUI and LST was only 0.1292 (p > 0.008), indicating a minimal linear association between BUI and SST, which is substantially lower than the typical values of 0.6-0.8 reported in contemporary urban areas.
Figure 6 shows the LST vs BUI correlation analysis using Sentinel-2 indices and thermal. These weak thermal correlations suggest multiple explanatory factors beyond simple relationships between vegetation and the built environment. First, the heritage district’s unique building materials, including traditional clay tiles and dense brick construction, may moderate thermal responses differently than modern concrete and glass structures. Second, the narrow alleyways and compact building configurations characteristic of Glodok create complex shadow patterns and air circulation dynamics not captured by satellite imagery. Third, anthropogenic heat from intensive commercial activities, vehicle emissions, and air conditioning systems may overwhelm passive thermal regulation from morphological factors. Fourth, the temporal mismatch between optical imagery (10:30 am overpass) and thermal peaks (2:00-4:00 pm) during maximum heat stress periods may lead to an underestimation of the actual correlations.
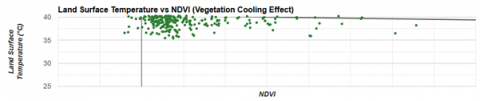
Figure 7 shows the correlation between LST and NDVI scores from Sentinel-2 indices and thermal data. The weak BUI-LST correlation (r = 0.129) and low mean NDVI (0.101) observed in Glodok provide quantitative insights for urban climatology beyond site-specific uniqueness. The correlation coefficient of 0.129 represents only 1.7% shared variance (R² = 0.0167) between built-up intensity and temperature, compared to 36-64% typically reported in contemporary urban areas where correlations range from 0.6–0.8. This substantial reduction in explanatory power suggests that in ultra-dense heritage districts, the conventional linear relationships between morphology and temperature break down below critical thresholds. Specifically, when vegetation coverage falls below NDVI = 0.15 (compared to 0.3–0.4 in functional urban cooling systems) and building density exceeds 70% coverage, the system appears to transition to a thermally saturated state where incremental morphological changes produce negligible temperature responses. This threshold effect, quantitatively demonstrated through our correlation analysis, indicates that heritage districts operate in a different thermal regime where anthropogenic heat sources likely dominate over passive morphological regulation. For urban climatology theory, these findings suggest the need for non-linear models incorporating threshold effects and regime shifts when analyzing ultra-dense urban environments, rather than assuming universal linear relationships between urban form and temperature.
The LST measurements, derived from the Landsat-8 thermal band with an inherent uncertainty of ± 2.5℃, showed mean values of 32.8℃ with spatial variations ranging from 28.5℃ to 39.2℃ across the district. This thermal range, captured during morning overpasses (10:45 am), likely underestimates peak afternoon temperatures by 3–5℃ based on typical diurnal cycles in tropical urban environments.
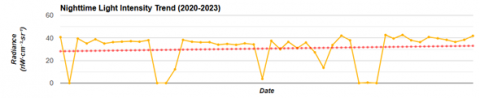
Figure 8 shows the nighttime light trends based on VIIRS day/night band monthly composites. The high spatial variability revealed through COV analysis provides critical insights for targeted intervention strategies. The extreme BUI variation (CV = 453.96%) indicates highly localized development patterns, suggesting that blanket policies would be inappropriate for this heterogeneous landscape. Site-specific interventions tailored to local morphological conditions offer greater potential for effective thermal management. Areas with negative BUI values (-1.1755 minimum) represent existing water bodies or exceptional vegetation patches that should be preserved as thermal refuges. Conversely, the maximum BUI zones (0.5744) identify priority areas for cooling interventions where the built environment modification could yield substantial benefits.
The integrated framework developed through this analysis demonstrates the complexity of thermal management in heritage districts operating beyond conventional urban climate thresholds. The quantitative implications of our findings extend to three key areas of urban climatology. First, the NDVI value of 0.101 represents approximately 70% deficit from the minimum effective cooling threshold commonly reported in literature (NDVI > 0.35), suggesting that vegetation additions in such ultra-dense contexts may yield diminishing returns compared to less dense urban areas. Second, the weak BUI-LST correlation implies that factors beyond morphology—such as material properties, anthropogenic heat from commercial activities, and restricted air circulation—play dominant roles in determining thermal patterns, though their precise contributions require further investigation with ground-based measurements. Third, the high inter-index correlations (NDVI-BUI r = -0.918) despite weak thermal relationships indicate that morphological changes occur in thermally ineffective ranges, suggesting the need for transformative rather than incremental interventions. These quantitative insights inform urban climatology by establishing empirical thresholds below which conventional mitigation strategies may have limited effectiveness, necessitating alternative approaches such as anthropogenic heat reduction through energy efficiency improvements, enhanced ventilation through strategic building modifications, or district-wide cooling systems rather than relying solely on vegetation enhancement.
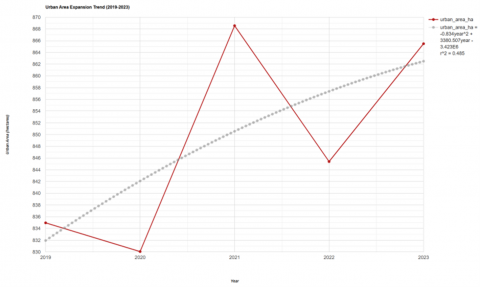
Figure 9 shows the urban area expansion trend from multi-temporal analysis of Sentinel-2 imagery (2019-2023). The strategic recommendations emerging from the integrated analysis must account for the weak morphology-temperature relationships while leveraging high spatial variability for targeted interventions. Short-term priorities should focus on preserving existing thermal assets, particularly the vegetation patches reaching 0.7908 NDVI, which represent critical cooling resources within the district. Protection of these areas through immediate designation as conservation zones could prevent further thermal degradation while maintaining baseline ecosystem services. Medium-term initiatives should address the limited vegetation-cooling relationship through strategic green infrastructure that creates connected networks rather than isolated patches, potentially strengthening the currently weak NDVI-LST correlation through threshold effects. Long-term transformation requires addressing anthropogenic heat sources through traffic management, building energy efficiency improvements, and district cooling systems that complement morphological interventions.
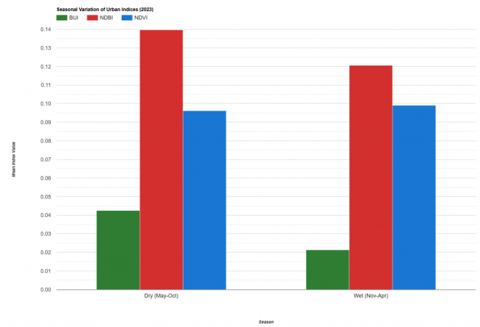
Figure 10 shows the seasonal variation of urban indices in 2023 based on Sentinel-2 multi-temporal composites processed using Google Earth Engine. Model robustness considerations acknowledge the unexpected weak thermal correlations as potentially reflecting data limitations rather than physical relationships. The 2023 analysis period may not capture inter-annual variability or extreme heat events where morphological influences become more pronounced. The timing of the morning satellite overpass potentially underestimates the afternoon thermal peaks when the maximum differentials of vegetation cooling and building heat absorption are reached. Despite these limitations, the comprehensive statistical framework provides valuable baseline metrics for monitoring future changes and evaluating the effectiveness of interventions. The strong inter-index correlations validate the morphological characterization, while the weak thermal relationships highlight the need for comprehensive heat mitigation strategies addressing multiple sources beyond land cover modification alone. The identification of 27.2 hectares with mitigation potential, despite weak morphology-temperature correlations, was based on multi-criteria analysis incorporating factors beyond simple thermal relationships. These areas, which met at least three intervention criteria, including available space, modifiable surfaces, and absence of heritage restrictions, represented 21.7% of the total study area where targeted interventions could achieve localized cooling despite weak district-wide correlations.
The weak morphology-temperature correlation necessitates examining socio-economic factors that constrain thermal mitigation in heritage commercial districts. Economic analysis reveals that Glodok's commercial properties operate under intense space utilization pressure, where every square meter generates substantial rental income, creating powerful disincentives for sacrificing revenue-generating floor space for cooling interventions. Our stakeholder mapping identifies three primary economic barriers: property owners prioritize maximum floor area utilization with typical building coverage exceeding 85%, resulting in significant opportunity costs for any green space conversion; small-scale merchants operating on thin profit margins cannot afford productivity losses from heat stress yet lack capital for cooling investments in their shophouses; and split incentive problems where tenants pay energy costs while landlords make building modification decisions, creating systematic underinvestment in thermal improvements. Social constraints include the informal governance networks controlling the majority of properties through family trusts and clan associations, requiring consensus from multiple stakeholders for any modifications. Additionally, the cultural significance of traditional architectural elements limits acceptable interventions, with community observations indicating resistance to visible facade modifications despite potential cooling benefits of 2–3℃. These socio-economic realities suggest that effective implementation requires innovative financial mechanisms such as heritage conservation grants linked to thermal performance, tax incentives to offset opportunity costs, and community-based cooling cooperatives that aggregate resources across multiple properties.
The weak morphology-temperature correlation fundamentally informs planning strategies by indicating that conventional zoning-based approaches are insufficient for heritage district cooling. This finding directs planners toward three alternative intervention pathways with specific governance requirements. First, behavioral interventions targeting peak heat periods (12:00–16:00) could reduce heat exposure through adjusted commercial operating hours, requiring coordination by merchant associations rather than top-down regulation. Implementation necessitates negotiated agreements among the various trade associations governing different commercial sectors within Glodok. Second, energy-based interventions focusing on anthropogenic heat reduction require district-wide coordination, as our analysis indicates that reducing air conditioning waste heat through upgraded systems could achieve measurable ambient cooling. This necessitates establishing coordinated management mechanisms for building energy audits, facilitating bulk procurement to reduce equipment costs, and managing subsidy programs for energy efficiency upgrades. Third, material-based interventions using cool roof coatings and traditional shading elements require modification of heritage guidelines to permit reversible thermal treatments. The current heritage approval process for building modifications must be streamlined through pre-approved intervention categories and expedited review procedures for thermal improvements. These governance mechanisms acknowledge that weak morphological correlations shift intervention responsibility from individual property owners to collective district management, requiring institutional innovations that bridge heritage conservation and climate adaptation mandates.
The findings from this integrated RS-GIS analysis have direct policy significance for sustainable heritage management across Southeast Asia. To operationalize these insights, we propose developing an open-source GIS-based decision support tool that integrates our multi-criteria assessment framework with real-time satellite monitoring capabilities. This tool would enable heritage authorities to visualize thermal hotspots overlaid with conservation zones, evaluate intervention scenarios based on local constraints, and track cooling effectiveness through automated Sentinel-2 and Landsat-8 analysis. The tool's modular design allows adaptation for different regulatory contexts while maintaining consistent assessment metrics, facilitating cross-district comparisons and regional knowledge sharing. Implementation requires collaboration between technical agencies providing geospatial expertise, heritage boards contributing conservation guidelines, and municipal planning departments ensuring alignment with broader urban development strategies. Successful thermal management in heritage districts necessitates participatory approaches that engage local communities and merchant associations as active partners rather than passive recipients of planning decisions. Our framework should be enhanced through participatory mapping exercises where merchants identify heat stress locations affecting business operations, community workshops to co-design culturally appropriate cooling solutions, and the establishment of merchant-led monitoring networks using low-cost thermal sensors to validate satellite observations. The Glodok case demonstrates that technical analysis must be complemented by social engagement, as the informal governance structures controlling property decisions require consensus-building rather than regulatory enforcement. Future applications should incorporate structured stakeholder consultation protocols, ensuring that thermal interventions align with community needs while respecting cultural values and economic realities.
This research provides actionable guidance for sustainable thermal management in heritage districts by demonstrating that weak morphology temperature correlations (r = 0.129) necessitate fundamentally different planning approaches than those applied in contemporary urban areas. For conservation authorities and urban planners, three key insights emerge from our integrated RS GIS analysis of Glodok. First, planners should prioritize preserving existing thermal assets over creating new green spaces. The 27.2 hectares of intervention potential identified through our analysis should be approached strategically: immediate protection of high NDVI patches (> 0.5) through conservation zoning, retrofitting of intermediate zones (NDVI 0.2 to 0.5) with cool roof technologies, and transformation of low NDVI areas (< 0.2) only where building modifications are already permitted. This tiered approach respects heritage constraints while maximizing thermal benefits within regulatory limitations. Second, the weak correlation findings direct investment toward anthropogenic heat reduction rather than morphological modifications. Conservation authorities should establish district wide energy efficiency programs targeting air conditioning systems, coordinate merchant associations to implement staggered operating hours during peak heat periods (12:00 to 16:00), and streamline heritage approval processes for reversible cooling interventions such as removable shading devices and cool surface treatments. These behavioral and energy-based strategies can achieve measurable cooling without altering protected architectural features. Third, the extreme spatial variability (BUI CV: 453.96%) necessitates precision targeting of interventions using the GIS-based decision support framework developed in this study. Planners should overlay thermal hotspot maps with heritage restriction zones to identify legally feasible intervention sites, use the multi-criteria assessment methodology to rank projects by cost effectiveness and cooling potential, and establish monitoring protocols using freely available Sentinel 2 and Landsat 8 data to track intervention effectiveness over time.
For immediate implementation, we recommend five priority actions: (1) Create a Heritage District Cooling Task Force combining conservation officers, energy managers, and merchant representatives; (2) Pilot cool roof installations on 10% of identified suitable buildings to demonstrate feasibility and measure actual temperature reductions; (3) Develop financial incentives linking heritage conservation grants to thermal performance improvements; (4) Establish pre-approved categories for reversible cooling interventions to expedite the 6 to 8 month approval process; and (5) Replicate this assessment methodology in other Southeast Asian heritage districts to build a regional knowledge base for climate adapted conservation. The methodological framework established here, combining high resolution morphological analysis with thermal assessment while respecting heritage constraints, provides a transferable model for similar districts across tropical Asia. By shifting focus from conventional vegetation-based cooling to integrated strategies addressing anthropogenic heat, building materials, and behavioral patterns, heritage districts can achieve meaningful thermal comfort improvements while preserving their cultural authenticity. Future research should validate these recommendations through pilot implementations, develop cost benefit models for proposed interventions, and establish region wide benchmarks for thermal performance in heritage contexts.
The authors gratefully acknowledge Atma Jaya Catholic University of Indonesia for institutional support.
The preparation of this manuscript utilized several supporting applications: Trinka for academic English grammar and writing style, Google Earth Engine for geospatial data processing, Napkin for visualization, QGIS for geographic information system analysis, Publish or Perish for citation metrics, and Mendeley for reference management. Literature sources were primarily obtained from Taylor & Francis Online (Tandfonline). All narrative content in this article has been thoroughly edited and adjusted in accordance with the editorial guidelines established by the journal. The authors take full responsibility for the accuracy and integrity of the content presented in this manuscript.
[1] Nugteren, B. (2020). Universal, colonial, or Indonesian heritage? A multi-scalar approach to the historical representations and management of colonial heritage in the old town of Jakarta (Kota Tua) during its bid for World Heritage nomination from 2015 to 2018. International Journal of Cultural Policy, 26(6): 840-853. https://doi.org/10.1080/10286632.2020.1811248
[2] Kitagawa, F., Candi, M. (2025). Designing place: Reimagining a peripheral town’s narrative through experience design. Design Journal, 28(1): 30-49. https://doi.org/10.1080/14606925.2024.2433353
[3] Ledo Espinoza, P.J. (2021). Peri-urbanization in Sacaba, Bolivia: Challenges to the traditional urban planning approach. International Planning Studies, 26(3): 286-301. https://doi.org/10.1080/13563475.2020.1839389
[4] Shao, Z., Wu, W., Li, D. (2021). Spatio-temporal-spectral observation model for urban remote sensing. Geo-Spatial Information Science, 24(3): 372-386. https://doi.org/10.1080/10095020.2020.1864232
[5] Kelly Turner, V., Rogers, M.L., Zhang, Y., Middel, A., et al. (2022). More than surface temperature: Mitigating thermal exposure in hyper-local land system. Journal of Land Use Science, 17(1): 79-99. https://doi.org/10.1080/1747423X.2021.2015003
[6] Kamali Maskooni, E., Hashemi, H., Berndtsson, R., Daneshkar Arasteh, P., Kazemi, M. (2021). The impact of spatiotemporal land-use and land-cover changes on surface urban heat islands in a semiarid region using Landsat data. International Journal of Digital Earth, 14(2): 250-270. https://doi.org/10.1080/17538947.2020.1860926
[7] Pereira, P., Valença Pinto, L., Gomes, E., Inácio, M. (2025). Changes in land use in the functional urban areas of Klaipeda, Kaunas, and Vilnius. Geocarto International, 40(1): 1-15. https://doi.org/10.1080/10106049.2025.2511156
[8] Aslam, R.W., Shu, H., Yaseen, A. (2023). Monitoring the population change and urban growth of four major cities in Pakistan through open-source data spatial analysis. Annals of Geographic Information Systems, 29(3): 355-367. https://doi.org/10.1080/19475683.2023.2166989
[9] Kurnia, L. (2011). Pasar Baru: Colonial space and contemporary hybridity. Inter-Asia Cultural Studies, 12(4): 552-567. https://doi.org/10.1080/14649373.2011.603918
[10] Tan, J.D., Supratikno, H., Pramono, R., Purba, J.T., Bernarto, I. (2019). Transgenerational entrepreneurship in ethnic Chinese family SMEs: Exploring Indonesia. Journal of Asia Business Studies, 13(2): 294-325. https://doi.org/10.1108/JABS-04-2018-0132
[11] Özçakır, Ö., Bilgin Altınöz, A.G., Mignosa, A. (2022). A tool for identifying post-intervention value shifts in urban heritage places: The heritage value circle. Journal of Architectural Conservation, 28(1): 22-45. https://doi.org/10.1080/13556207.2021.1996001
[12] Liu, Q., Li, W., Zhu, Y., Wang, Q., Chen, S. (2024). Canton commercial maritime heritage: Historical and cultural origins of custom buildings in the Guangdong region and their revitalization values from a linear perspective. Journal of Asian Architecture and Building Engineering, 24(6), 4969-4984. https://doi.org/10.1080/13467581.2024.2439331
[13] Septianto, E., Septianto, E., Poerbo, H.W., Firmansyah, Martokusumo, W. (2025). Understanding the attractiveness of types of historic districts in Bandung: Implementing heritage conservation based on public perception. Journal of Asian Architecture and Building Engineering, 24(5): 4226-4241. https://doi.org/10.1080/13467581.2024.2397111
[14] You, N. (2025). Identifying priority areas for optimizing the urban thermal environment by considering the impact of the built environment on outdoor thermal comfort. Journal of Asian Architecture and Building Engineering, 1-17. https://doi.org/10.1080/13467581.2025.2473140
[15] Debnath, M., Poddar, I., Saha, A., Islam, N., Roy, R. (2025). Analysis of land surface temperature and its correlation with urban, water, vegetation, and surface indices in the Siliguri Urban Agglomeration area of the Himalayan foothill region. Geomatics, Natural Hazards and Risk, 16(1): 1-18. https://doi.org/10.1080/19475705.2025.2470393
[16] Aithal, B.H., Gupta, N., Dwivedi, G. (2024). Quantitative analysis of passive cooling measures in achieving a thermally comfortable urban environment. Geomatics, Natural Hazards and Risk, 15(1): 1-15. https://doi.org/10.1080/19475705.2024.2347415
[17] Li, B., Liu, Y., Xing, H., Meng, Y., Yang, G., Liu, X., Zhao, Y. (2022). Integrating urban morphology and land surface temperature characteristics for urban functional area classification. Geo-Spatial Information Science, 25(2): 337-352. https://doi.org/10.1080/10095020.2021.2021786
[18] Wang, Y., Zhu, Y., Li, X., Cai, A., Wang, X., Zhang, C. (2022). Spatiotemporal variation of urban thermal environment and its relationship with urban expansion types from 2000 to 2020: A case of Huai’an central urban area, Huai’an, China. Geomatics. Natural Hazards and Risk, 13(1): 1946-1964. https://doi.org/10.1080/19475705.2022.2101388
[19] Dilawar, A., Chen, B., Trisurat, Y., Tuankrua, V., et al. (2021). Spatiotemporal shifts in thermal climate in responses to urban cover changes: A case analysis of major cities in Punjab, Pakistan. Geomatics, Natural Hazards and Risk, 12(1): 763-793. https://doi.org/10.1080/19475705.2021.1890235
[20] Wu, W., Li, C., Liu, M., Hu, Y., Xiu, C. (2020). Change in the impervious surface area and its impacts on the urban landscape: An example of Shenyang between 2010 and 2017. Ecosystem Health and Sustainability, 6(1): 1-10. https://doi.org/10.1080/20964129.2020.1767511
[21] Mithun, S., Sahana, M., Chattopadhyay, S., Chatterjee, S., Islam, J., Costache, R. (2022). A comparative framework for spatially explicit urban growth modeling for monitoring urban land-use efficiency and sustainable urban development (SDG 11.3.1): A study on Kolkata metropolitan area of India. Geocarto International, 37(27): 17933-17970. https://doi.org/10.1080/10106049.2022.2136259
[22] Ali, Y., Afnan, J., Jannat, M., Uddin, M.M. (2025). Assessing urban floodplain alteration using remote sensing and geographic information system: A three-decade analysis (1992-2022). Geological and Ecological Landscapes, 1-16. https://doi.org/10.1080/24749508.2025.2524209
[23] Deng, Z., Cao, J., Hu, Y. (2020). Spatial and temporal evolution of the landscape pattern in the downtown area of Jixi City, China. European Journal of Remote Sensing, 53(Sup1): 104-113. https://doi.org/10.1080/22797254.2020.1713024
[24] Islam, F., Tariq, A., Guluzade, R., Zhao, N., et al. (2023). Comparative analysis of GIS and RS-based models for delineation of groundwater potential zone mapping. Geomatics, Natural Hazards and Risk, 14(1): 1-14. https://doi.org/10.1080/19475705.2023.2216852
[25] Roy, S., Bose, A., Majumder, S., Roy Chowdhury, I., Abdo, H.G., Almohamad, H., Abdullah Al Dughairi, A. (2023). Evaluating urban environment quality (UEQ) for Class-I Indian city: An integrated RS-GIS based exploratory spatial analysis. Geocarto International, 38(1). https://doi.org/10.1080/10106049.2022.2153932
[26] Liladhar Rane, N., Purushottam Choudhary, S., Saha, A., Srivastava, A., et al. (2024). Delineation of environmentally sustainable urban settlement using GIS-based MIF and AHP techniques. Geocarto International, 39(1): 2335249. https://doi.org/10.1080/10106049.2024.2335249
[27] Kusno, A. (2011). Runaway city: Jakarta Bay, the pioneer and the last frontier. Inter-Asia Cultural Studies, 12(4): 513-531. https://doi.org/10.1080/14649373.2011.603916
[28] Jingga, F., Lukito, Y.N. (2021). Ethnic identity and its response to the growing environment in the urban space of Glodok, Jakarta. AIP Conference Proceedings, 2376(1): 040004. https://doi.org/10.1063/5.0064109
[29] Ying, Y., Garcia, F., Novianti, Z. (2020). Views of younger and older-generation Chinese descendants in Indonesia regarding auspicious date selection. Transoral Chinese: East Asian Perspectives, 14(1): 115-131. https://doi.org/10.1163/24522015-01401007
[30] Oktarina, F., Ridwan, K., Kurniawan. (2021). The history of Jakarta’s Chinatown: The role of the city gate as a transition area and a starting point in the spatial transformation from the first Chinatown to the renewal phase. SPAFA Journal, 5: 1-24. https://doi.org/10.26721/spafajournal.2021.v5.650
[31] Komala, O.N., Ellisa, E., Yatmo, Y.A. (2022). The characteristics of halal and nonhalal food territories in multilayered mapping of Jakarta’s Chinatown urban foolscap. A/Z ITU Journal of the Faculty of Architecture, 19(1): 119-135. https://doi.org/10.5505/itujfa.2022