Muhammad Faiz Al Anshari![]()
© 2025 The author. This article is published by IIETA and is licensed under the CC BY 4.0 license (http://creativecommons.org/licenses/by/4.0/).
OPEN ACCESS
This study analyzes how climate anomalies, particularly El Niño and La Niña, influence rice price volatility in Indonesia. Using monthly data from 2011 to 2023, several forecasting models are developed and compared, including ARIMA, ARIMAX with exogenous variables, Random Forest, and XGBoost. The models incorporate both climatic indicators—such as the Oceanic Niño Index (ONI) and ENSO phase dummies—and key macroeconomic variables, including CPI inflation, the exchange rate, the policy interest rate, and international oil prices. The linear benchmarks capture basic autocorrelation patterns but tend to lose accuracy during ENSO-related disruptions. In contrast, the nonlinear ensemble models show more stable performance. XGBoost produces the strongest results, with lower forecast errors (MAE = 2.71, RMSE = 3.69) and higher explanatory power (R² = 0.83), especially during major climate events such as the 2015–2016 El Niño and the 2020 La Niña. Feature importance and SHAP analysis suggest that macro-financial variables dominate under normal conditions, while climate indicators become substantially more influential when extreme weather develops. A simple comparison between ENSO phases and recent production data further supports the link between climate anomalies and weaker harvests. Overall, the findings indicate that climate information can be effectively integrated into rice price forecasting models. For institutions such as Bank Indonesia and food security agencies, climate-sensitive forecasting tools can strengthen early warnings and support more timely policy responses to rising food price pressures.
El Niño–Southern Oscillation, rice price volatility, machine learning, XGBoost, Random Forest, climate risk, inflation forecasting
Climate change is no longer a distant projection—it is a lived reality, unfolding with increasing intensity and reshaping both ecosystems and economies in real time. Among the hardest hit are developing countries, where agriculture can account for over a quarter of GDP and serves as the primary livelihood for large segments of the population [1, 2]. In Indonesia, this vulnerability manifests most acutely through its dependence on rice. As the primary staple, rice is consumed by nearly all households and contributes more than half of daily caloric intake [3, 4]. With average annual per capita consumption around 95 kg, even minor disruptions in supply or price can trigger widespread hardship.
Historically, rice price volatility has carried not just economic but also political consequences. A striking example occurred during the 1998 Asian financial crisis, when surging food prices—especially rice—fueled public discontent and helped precipitate the fall of the Suharto regime [5]. In this context, climate-induced price shocks are not merely agricultural issues; they represent systemic risks with far-reaching implications for food security, inflation, and social stability.
Among the many climate phenomena that shape agricultural outcomes, the El Niño–Southern Oscillation (ENSO) stands out for its widespread and persistent influence—particularly across tropical regions. Characterized by alternating warming (El Niño) and cooling (La Niña) phases in the equatorial Pacific, ENSO disrupts rainfall and temperature cycles critical to crop production [6]. In the Indonesian context, the effects are especially pronounced: El Niño episodes often bring severe drought, while La Niña triggers excessive rainfall and flooding. Both extremes undermine agricultural productivity, damage infrastructure, and complicate rural logistics [7, 8]. Empirical research underscores these vulnerabilities. For example, in Thailand, strong ENSO phases have significantly depressed rice yields, with notable declines during El Niño years [9]. Such climate-induced disruptions interfere with planting and harvest cycles and amplify the risk of food insecurity, threatening both local livelihoods and broader national food systems.
These risks are not theoretical—in recent years, Indonesia has witnessed some of the clearest evidence of ENSO’s disruptive power. The 2023 El Niño episode offers a stark example. According to official data, national paddy production fell to about 53.98 million tons of Gabah Kering Giling (dry unhusked paddy), a 1.4% decrease from the previous year and the lowest output in over a decade. This equates to roughly 31.1 million tons of milled rice, underscoring the tangible impact of climate-induced supply shocks. The effects quickly translated to markets: year-on-year rice inflation reached 18.44% in September 2023 (the highest in nearly ten years), while monthly rice inflation hit 5.61%, making rice one of the top contributors to headline inflation in the second half of the year. Regions in southern Indonesia—historically more exposed to ENSO-linked drought—saw food inflation well above the national average during this period [10]. Although earlier studies struggled to find a consistent national link between ENSO and aggregate economic output [11], more recent findings increasingly affirm that severe ENSO events can disrupt price stability and amplify inflationary pressure [12].
Despite these growing climate-related risks, many inflation forecasting models—including those used by central banks such as Bank Indonesia—still largely rely on traditional, demand-driven indicators. Exchange rates, interest rates, and money supply continue to dominate inflation outlooks, while variables tied to supply shocks, especially those driven by climate anomalies, are often excluded. This narrow focus can lead to blind spots. In years marked by ENSO extremes, overlooking climate variables may result in underestimating food inflation risks. Calls for reform have grown louder in the literature, with scholars urging the inclusion of climate indicators—such as the Oceanic Niño Index (ONI) or ENSO phase classifiers—into inflation forecasting frameworks [12].
Recent developments in predictive analytics offer new tools to address this gap. Machine learning (ML) models such as Random Forest and XGBoost have shown considerable success in agricultural forecasting and food price prediction [13]. In Indonesia, for instance, a Random Forest model significantly outperformed linear regression in predicting rice prices at the provincial level [14], yet notably, such models have often been applied without incorporating climatic factors. While ML-based forecasting is becoming more common, models that integrate ENSO indicators remain rare, particularly in Southeast Asia where climate variability’s effects on food systems are especially pronounced.
This study seeks to address that gap by developing a hybrid forecasting model that integrates Random Forest and XGBoost algorithms with ENSO-related climate indicators. Both methods individually excel at capturing nonlinear dynamics and high-dimensional interactions; however, their combined application to forecasting rice price anomalies in Indonesia—while explicitly accounting for ENSO events—remains underexplored. This forms the crux of the study’s scientific contribution: bridging climate science and macroeconomic forecasting in one of the world’s most climate-vulnerable, rice-dependent economies.
From this standpoint, the central research question is as follows: To what extent does ENSO drive rice price fluctuations in Indonesia, and can machine learning models that incorporate ENSO indicators enhance predictive accuracy? The working hypothesis posits that the inclusion of ENSO-related variables—such as the Oceanic Niño Index (ONI) and categorical phase indicators—will significantly improve model performance, especially during strong El Niño or La Niña periods.
Accordingly, this research aims to evaluate the forecasting power of a hybrid machine learning framework using Random Forest and XGBoost, enriched with climatic and macroeconomic predictors. The ultimate goal is twofold: (1) to support the development of early warning systems for food inflation triggered by climate shocks, and (2) to inform more climate-responsive inflation surveillance frameworks for policy institutions such as Bank Indonesia.
This study adopts a quantitative time-series design to examine how climate anomalies—particularly El Niño and La Niña—affect rice price fluctuations across Indonesia. The analysis spans from January 2011 to December 2023, a period characterized by multiple ENSO episodes and considerable volatility in domestic food prices. The primary objective is to determine whether, and to what extent, these climate shocks–when assessed alongside macroeconomic variables–can explain abnormal movements in rice prices at the national level.
Rather than focusing on specific provinces, national-level data are employed to ensure generalizability across Indonesia. The dataset was compiled from authoritative sources: rice prices and production data were obtained from Statistics Indonesia (BPS), macroeconomic indicators from Bank Indonesia (including exchange rate and BI-7 Day Reverse Repo Rate), and ENSO indices such as the Oceanic Niño Index (ONI) from NOAA. The use of monthly frequency allows the model to capture both seasonal patterns and high-frequency disturbances, striking a balance between data richness and model tractability.
The dependent variable, rice price anomaly, is defined as the percentage deviation of nominal rice prices from their 12-month moving average. This transformation filters out long-term trends and seasonal cycles, allowing the analysis to focus on irregular price spikes or drops. The anomaly is computed as follows:
Rice Price Anomaly $(\%)=\left(\frac{\left(P_t-\bar{P}_{12}\right)}{\bar{P}_{12}}\right) \times 100$ (1)
where Pₜ is the nominal rice price in month t, and $\overline{\mathrm{P}}_{12}$ is the average price over the previous 12 months.
Climate anomalies are operationalized through the Oceanic Niño Index (ONI), a 3-month to capture climate-related disturbances, this study incorporates the Oceanic Niño Index (ONI) as the primary proxy for ENSO activity. ONI measures sea surface temperature anomalies in the Niño 3.4 region over rolling 3-month periods and is widely used by climate agencies, including NOAA. In this analysis, El Niño conditions are defined as months with ONI ≥ +0.5℃, while La Niña is identified when ONI ≤ –0.5℃ [15, 16]. These phases are encoded using dummy variables to help isolate their individual effects on rice price anomalies within the machine learning models.
Beyond climate variables, four macroeconomic indicators are included to control for demand-side and policy-driven influences: year-on-year Consumer Price Index (CPI) inflation, the exchange rate between the Indonesian Rupiah and the US Dollar (USD/IDR), Bank Indonesia’s 7-Day Reverse Repo Rate (BI-7DRRR), and international Brent crude oil prices. These variables were selected based on their demonstrated relevance in previous studies exploring food price volatility in emerging economies [17, 18]. Collectively, they help account for broader economic forces that may co-move with food price changes.
The complete dataset is compiled as a monthly time-series panel. In cases where minor data gaps occurred—such as missing monthly entries—values were estimated through linear interpolation based on adjacent months. Before model fitting, all continuous predictors are standardized (mean = 0, standard deviation = 1) to ensure comparability across variables and to improve the stability and convergence of the algorithms during training.
The final dataset consists of 168 monthly observations for each variable. In cases of minor data gaps—typically due to missing months—values were imputed using linear interpolation based on adjacent entries. All continuous variables were standardized (mean = 0, standard deviation = 1) before modeling to facilitate convergence and comparability.
To capture the potentially nonlinear and interactive effects of climate and macroeconomic shocks, two ensemble machine learning algorithms were applied: Random Forest and Extreme Gradient Boosting (XGBoost). These models are particularly well-suited for handling high-dimensional data and complex variable interactions [19, 20]. These models were selected due to their ability to capture nonlinearities and interactions between economic and climatic variables, which linear models often fail to detect, particularly in highly volatile environments [16, 21].
Random Forest operates by constructing multiple decision trees from bootstrapped samples and averaging their predictions:
$\hat{Y}=\left(\frac{1}{B}\right) \times \sum(b=1$ to $B) T_{b(X)}$ (2)
where Tb(x) is the prediction from the bth decision tree, and B is the total number of trees in the forest. This ensemble approach reduces overfitting by aggregating a diverse set of models trained on different subsets of the data [19].
XGBoost improves upon this by building trees sequentially, each one correcting the residuals of the previous model. Its objective function includes both the squared loss and a regularization term to penalize model complexity:
$\boldsymbol{L}(\boldsymbol{\varphi})=\sum\left(Y_t-\hat{Y}_t\right)^2+\sum \boldsymbol{\Omega}\left(\boldsymbol{f}_m\right)$ (3)
Model performance was evaluated using an 80:20 train-test split, with the last 20% reserved for out-of-sample forecasting. Cross-validation was conducted to ensure robustness, and error metrics—such as Mean Absolute Error (MAE), Root Mean Squared Error (RMSE), and R-squared (R²)—were calculated to assess accuracy. Feature importance scores were extracted from the trained XGBoost model to understand which variables most strongly influenced rice price anomalies.
To benchmark the performance of nonlinear models, several standard linear time-series specifications were evaluated first. Multiple ARIMA configurations were estimated using the rice anomaly series, with the best-performing model being ARIMA(2,0,1), which produced an RMSE of 4.34. To assess the contribution of exogenous variables, ARIMAX models incorporating ENSO and macroeconomic indicators were then tested. The strongest ARIMAX configuration (0,0,1) resulted in an RMSE of 4.88. Although these linear models capture short-run autocorrelation reasonably well, their performance declines during periods of climatic disturbance. This reflects the inherent limitations of linear structures in modeling the nonlinear and asymmetric effects typically associated with El Niño and La Niña events.
While this modeling approach captures key drivers of rice price dynamics, it does not yet account for unstructured or policy-related variables such as government import timing, food reserve releases, or logistic bottlenecks. These limitations are addressed in the discussion section and present promising directions for future research.
This section presents the main empirical findings and discusses their implications for rice price dynamics in Indonesia. We begin with an overview of the behaviour of rice price anomalies and ENSO conditions over the sample period, including recent El Niño and La Niña episodes. We then compare the performance of the forecasting models, focusing on the relative accuracy of ARIMA, ARIMAX, Random Forest and XGBoost.
Next, we examine how macroeconomic and climate variables contribute to prediction accuracy, using feature importance and SHAP analysis, and relate these patterns to observed changes in rice production during ENSO events. Finally, we discuss the main limitations of the model, outline possible improvements, and draw out the policy implications for early warning systems and inflation management in climate-vulnerable economies such as Indonesia.
3.1 Model evaluation and performance comparison
The empirical analysis shows that incorporating climate anomalies—particularly El Niño and La Niña—substantially improves the predictive performance of rice price forecasting models. Among all models tested, XGBoost delivers the strongest results, leveraging sequential tree boosting to capture complex nonlinear patterns in the data more effectively than Random Forest. The full comparison of error metrics across the four model classes is reported in Table 1.
Table 1. Model evaluation metrics for rice price anomaly forecasting
|
Model |
MAE |
RMSE |
R² |
|
ARIMA(2,0,1) |
3.66 |
4.34 |
0.46 |
|
ARIMAX(0,0,1) + exog |
4.05 |
4.88 |
0.31 |
|
Random Forest |
3.14 |
4.02 |
0.79 |
|
XGBoost |
2.71 |
3.69 |
0.83 |
As shown in Table 1, linear benchmarks such as ARIMA and ARIMAX perform reasonably well but remain limited in capturing climate-induced volatility. This is consistent with earlier studies noting that linear autoregressive models tend to struggle when the underlying series exhibits nonlinearities, structural breaks, or irregular climate-related shocks [21]. Research on ENSO–commodity links has also shown that El Niño and La Niña often generate asymmetric and phase-dependent effects on agricultural prices, which further challenge models that assume stable linear relationships [11, 22]. These characteristics help explain the moderate performance of ARIMA(2,0,1) and ARIMAX(0,0,1) in this study.
In contrast, nonlinear ensemble methods demonstrate substantially better predictive capability. Random Forest reduces the RMSE to 4.02 with an R² of 0.79, indicating its ability to capture threshold behavior and interaction effects. XGBoost delivers the best results overall, with the lowest MAE and RMSE and the highest R². Similar findings have been highlighted in recent work showing that machine learning models often outperform linear frameworks in forecasting prices that are sensitive to climate anomalies and macroeconomic fluctuations [16, 18]. These results suggest that nonlinear approaches offer a more reliable foundation for monitoring and forecasting rice price risks under ENSO-driven uncertainty.
Although the improvement in RMSE from Random Forest to XGBoost appears modest (around 0.3–0.4 points), the gain is still meaningful in this context. The improvement is systematic—XGBoost outperforms Random Forest across all evaluation metrics and remains superior under alternative train–test splits, suggesting that the difference is not due to sampling variability. More importantly, even small reductions in forecast error can be operationally relevant when predicting a staple food price that reacts sharply to climate shocks. Recent studies show that climate-related disturbances can produce statistically significant increases in food prices and inflation, even when the magnitude of climatic deviations is moderate [12, 23]. In this environment, improving short-term predictive accuracy–even if incremental–enhances the reliability of early-warning signals during El Niño and La Niña events. For this reason, we interpret XGBoost’s improvement as a policy-relevant refinement over Random Forest, rather than a dramatic change in forecasting regime.
3.2 The role of climate anomalies in price prediction
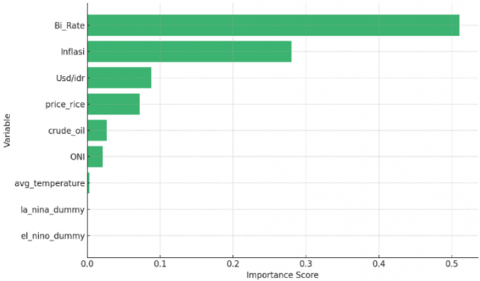
The feature importance analysis provides an initial overview of how different predictors contribute to the model’s performance. As shown in Figure 1, monetary and macroeconomic variables dominate the ranking: the BI Rate emerges as the most influential predictor, followed by inflation and the USD/IDR exchange rate. This pattern aligns with broader evidence that domestic financial conditions and macroeconomic pressures remain primary drivers of food price dynamics in Indonesia, particularly through their influence on credit costs, input prices, and inflation expectations. Meanwhile, climate-related indicators—including the Oceanic Niño Index (ONI), average temperature, and ENSO dummy variables—appear lower in the aggregate importance ranking, suggesting that their influence is not constant across the sample but rather concentrated in specific episodes of climatic stress. In the XGBoost model, macro-financial variables together account for the vast majority of total feature importance (well above ninety percent), while climate-related indicators (ONI, temperature and ENSO dummies) contribute only a modest residual share. Although small in aggregate, this contribution becomes much more visible around ENSO episodes, when its marginal impact on forecast accuracy rises and helps the model track sudden climate-driven price movements more closely.
Figure 1. Global feature importance derived from the XGBoost model
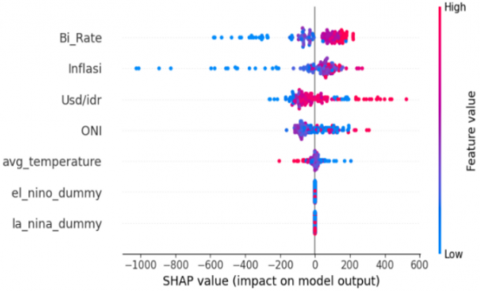
Figure 2. SHAP summary values showing the direction and magnitude of each feature’s impact on predicted rice price anomalies
To obtain a more granular understanding of how each variable shapes the model’s predictions, a SHAP summary plot was generated (Figure 2). In contrast to the bar plot, which summarizes overall contribution, the SHAP results provide insight into the direction and variability of each feature’s impact at the observation level. High values of BI Rate, inflation, and USD/IDR exhibit a clear upward pull on predicted rice price anomalies, reflecting the pass-through effects of monetary tightening, general inflationary pressure, and exchange-rate depreciation. Climate variables display a more distinctive and event-driven pattern: although their average importance is modest, they exert substantial influence during extreme climatic conditions. Elevated ONI values—associated with El Niño—tend to push predictions upward, reflecting supply-side constraints arising from drought and elevated temperatures, whereas La Niña phases cluster toward negative SHAP values, indicating price-stabilizing effects of improved rainfall and harvest outcomes. This asymmetry reinforces the idea that ENSO indicators act as shock-sensitive variables that become highly informative during periods of climatic disruption.
Taken together, the feature importance and SHAP analyses provide a coherent narrative showing that rice price volatility in Indonesia emerges from the interplay of structural macroeconomic drivers and episodic climate disturbances. Macroeconomic conditions govern the general trajectory of price movements, yet climate anomalies create sharp deviations that traditional linear models often fail to capture. ENSO indicators, despite their lower average ranking, provide essential predictive signals during anomalous periods—precisely when accuracy is most critical for policymakers. This combined evidence underscores the value of integrating climate-sensitive predictors with economic fundamentals to develop forecasting frameworks that are robust not only under normal market conditions but also in the face of increasing climate variability.
It is important to note that the feature importance results cannot fully separate “pure” climate effects from indirect macroeconomic responses. In practice, ENSO shocks affect rice prices both directly, through their impact on yields and inventories, and indirectly, through inflation expectations, exchange rate movements and monetary policy reactions [12, 23]. In this paper, macro-financial variables are therefore interpreted as transmission channels rather than competing explanations. Climate indicators such as ONI and the ENSO dummies are used as risk signals that flag periods of heightened weather stress, while macro variables capture how those shocks propagate through the broader economy. As a result, the model is not intended to isolate a strictly “climate-only” effect, but to provide a practical forecasting tool that integrates climatic and macroeconomic information in a single framework.
3.3 ENSO and rice production in Indonesia
Indonesia’s rice calendar is shaped by the monsoon cycle and allows up to three crops per year, with one main wet-season crop followed by up to two dry-season crops [24]. Around half of annual rice output is typically generated during this single wet-season harvest (October–April), so disruptions to the onset or intensity of the rains can have disproportionate effects on national production [25]. On top of this seasonal pattern, rice cultivation is exposed to ENSO (El Niño–Southern Oscillation) variability: warm El Niño phases tend to suppress rainfall and increase drought risk, while cool La Niña phases usually bring above-normal precipitation [26, 27]. In broad terms, El Niño events place stress on rainfed rice systems and can reduce yields, whereas La Niña conditions often improve soil moisture and support larger harvests [26, 27].
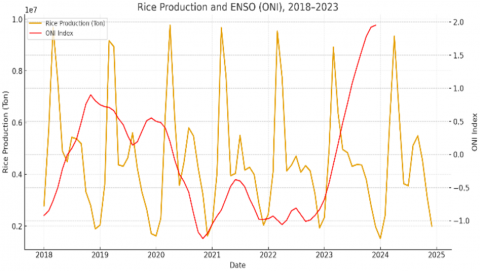
Figure 3. Monthly rice production in Indonesia and ENSO conditions measured by the Oceanic Niño Index (ONI), 2018–2023
The monthly data used in this study reflect these mechanisms, but in a nuanced way. Figure 3 plots rice production against the ONI index over 2018–2023. Production follows a clear seasonal cycle, with sharp peaks around main harvest months and troughs during planting periods. When ONI climbs into positive territory, especially during the El Niño episodes in 2019–2020 and again in 2023, the production spikes tend to be flatter or followed by weaker months. By contrast, when ONI moves into negative values associated with La Niña, production often stabilises at moderate–high levels rather than collapsing. The pattern is not perfect month by month, but it is consistent with the idea that warm ENSO phases make high yields harder to achieve, whereas cooler phases create more favourable growing conditions.
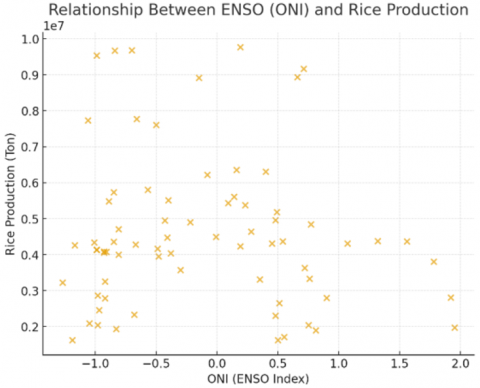
Figure 4. Relationship between ENSO conditions (Oceanic Niño Index, ONI) and monthly rice production in Indonesia, 2018–2023
Figure 4 shows the same relationship from a different angle by plotting rice production against ONI values. The cloud of points is widely scattered, confirming that the ENSO–production link is neither linear nor deterministic. Even so, some tendencies are visible: at strongly negative ONI values, many observations fall in the medium-to-high production range, while at positive ONI values, the points are more dispersed, and low-production months begin to appear. This suggests that El Niño increases the risk of weaker harvests, but the outcome still depends on local conditions and on how farmers and policymakers respond, for example, through irrigation, shifts in planting dates, and the use of public stocks.
This interpretation is consistent with wider evidence for Indonesia. Using a computational time-series approach, Herho et al. [28] found no simple one-to-one correlation between ENSO indices such as the Multivariate ENSO Index and annual rice output, arguing that irrigation infrastructure and regional circulation patterns can partially decouple local growing conditions from Pacific sea-surface temperature anomalies. Empirical and journalistic accounts of recent seasons also show that ENSO episodes did not automatically trigger supply crises: adequate reserves, timely imports and targeted irrigation measures often neutralized what might otherwise have been severe production shortfalls [26, 29]. For instance, after the 2019 El Niño, output reportedly declined by about 7%, yet domestic prices remained relatively stable because government stocks and imports buffered the market [29].
Looking ahead, this implies that ENSO is best viewed as a climate risk signal rather than a standalone driver of production outcomes. The most robust forecasting frameworks will therefore combine ENSO indicators with detailed agronomic and policy-related information. In practice, this means using indices such as the Oceanic Niño Index alongside data on irrigation availability, planting calendars, reservoir and stockpile levels, and support measures such as subsidies or import programs. Ansari et al. [26] explicitly called for a dynamic cropping calendar and proactive irrigation planning to cope with rainfall variability in Indonesian rice systems. By extension, yield-forecasting models that link ENSO-driven rainfall anomalies with information on water management and farm practices are likely to predict harvest outcomes more accurately. In sum, ENSO phases provide an early warning of climate stress, but reliable projections of Indonesia’s rice output require combining large-scale climate signals with domestic agronomic and policy factors from planting through to harvest [26, 27].
3.4 Model limitations, improvements, and prediction accuracy
The model we developed, while strong in many areas, still has clear limitations. XGBoost is particularly effective in detecting price spikes associated with climate shocks. For example, it closely tracks the 8% rise in rice price anomalies during the 2015–2016 El Niño episode. However, in some cases, the model raises “false alarms”. One prominent example occurred in mid-2019: El Niño conditions were present, yet rice prices remained broadly stable. This was not a failure of the climate signal itself, but a result of rapid policy intervention, including import releases and the use of public stockpiles, which helped keep prices in check. Because the model does not include variables that capture these policy actions, it predicts a price surge that did not materialize.
This illustrates a broader limitation of relying solely on economic and climate covariates without explicit information on policy and logistics. When such elements are missing, forecasts may not fully reflect actual market outcomes, especially in periods when strong government responses successfully neutralize supply shocks. In this study, the absence of indicators for stock releases, import decisions, or reserve levels sometimes leads the model to overestimate the impact of El Niño and La Niña events that were, in practice, managed behind the scenes.
A second source of error arises from shocks that are only weakly related to ENSO conditions. The model may overlook price spikes triggered by factors such as global fertilizer shortages, export restrictions or political disruptions. These events lie outside the climate-based learning patterns embedded in the training data and therefore may not be captured accurately, leading to gaps in forecasting during certain episodes. To address this, future work could incorporate signals related to policy and logistics–such as food reserve releases, trade restrictions or satellite-based crop failure alerts–to reduce error. Broader external risks, including global grain prices and energy market shocks, could also be added to better account for non-climate drivers of volatility.
Another way forward is to combine XGBoost with models that can better accommodate structural change over time. Recent studies, such as Wu et al. [30], show that rising temperatures can affect not only food prices but also financial stability and monetary policy. These feedback loops between climate and the macro-financial system suggest that forecasting tools should allow for evolving relationships rather than assuming that historical patterns remain fixed. Simple extensions–such as adding a “climate intervention” flag that marks periods of major government action—could also help make predictions more realistic and useful in practice.
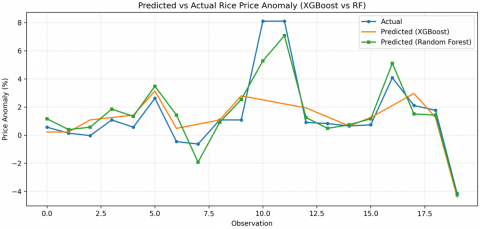
The model’s numerical superiority is supported by visual evidence. Figure 5 compares the predicted and actual rice price anomalies over time, illustrating how closely the XGBoost model (orange line) tracks the observed price movements (yellow line). This visual evaluation adds depth to the statistical results and provides an intuitive check on the model’s real-world performance. Across the 2011–2023 period, XGBoost follows major swings in rice price anomalies, particularly during turbulent episodes. During the 2015–2016 El Niño, for instance, the model captures the price surge with a margin of error below 0.5 percentage points, while Random Forest (red line) performs notably worse. These apparently small differences in prediction accuracy matter. In a country like Indonesia, even a 2–3 percentage point underestimation can lead to substantial fiscal costs, from miscalculated subsidy needs to delayed import decisions [31, 32]. Muslim [17] similarly emphasized how past price spikes—such as during the late-1990s Asian financial crisis—placed considerable pressure on public finances, partly due to the lack of timely policy responses.
Figure 5. Comparison between actual and predicted rice price anomalies using XGBoost and Random Forest
The improved accuracy of XGBoost is therefore not just a statistical refinement; it has direct policy relevance. A model that detects early signs of rising price pressure provides policymakers with a window of opportunity to act before shocks propagate through the economy. As Bellemare [5] argued, early warning systems that link weather anomalies to food price forecasting are becoming essential tools for managing food security risks in the context of climate uncertainty. Even a few extra weeks to respond—by releasing reserves, adjusting tariffs or securing imports—can prevent local shocks from escalating into broader crises. Visually, the close alignment between predicted and actual price anomalies also strengthens the case for incorporating ENSO indicators into economic forecasting. It allows models to recognise market signals associated with droughts and floods rather than treating them as unpredictable events. This fits within the broader idea of “climateflation”, which highlights inflationary pressures arising directly from climate anomalies. Erdogan et al. [23] provided recent evidence from Nigeria showing that temperature spikes are increasingly associated with persistent increases in food prices.
Taken together, these episodes suggest that the model tends to mispredict in two main situations. First, it overestimates price pressures when ENSO-related supply risks are fully offset by policy responses, such as large stock releases or rapid import decisions. Second, it underestimates price spikes that are driven by non-climatic shocks, including fertilizer shortages, export restrictions or geopolitical disruptions that lie outside the climate-based learning patterns. Recognizing these two failure modes helps clarify where ENSO-linked machine learning forecasts are most informative, and where additional information on policy and logistics is needed to support real-time decision-making.
3.5 Policy implications and practical applications
The policy implications of these results are both important and timely. The findings indicate that macro-financial variables continue to drive rice price movements during normal periods, but ENSO-related indicators become particularly useful during climate-stressed conditions. This pattern suggests that Indonesia’s inflation-targeting framework may need to include climate risks more systematically. Repeated ENSO events have demonstrated that food prices can rise rapidly when supply is disrupted; however, these risks are often overlooked in traditional forecasting models, which primarily focus on demand-side factors. The evidence here demonstrates that climate indicators—particularly the Oceanic Niño Index (ONI)-can be added to forecasting tools to help detect such risks earlier. This supports recent calls for climate-sensitive macroeconomic frameworks [33].
Global research by Kotz et al. [16] estimates that rising temperatures and weather extremes may add 0.3 to 3.0 percentage points to food and headline inflation each year under current warming trends. For tropical developing countries like Indonesia, where climate exposure and structural weaknesses in food systems overlap, these effects are likely to be stronger [1, 34]. Evidence from Eastern and Southern Africa also shows that temperature shocks increase inflation volatility, which means climate disturbances are not simply temporary or external shocks [34].
Our findings add to this growing literature by showing that ENSO indicators improve the accuracy of rice inflation forecasting in a country that is highly exposed to climate risks. For Bank Indonesia and similar institutions, including an ENSO early-warning index in their regular inflation monitoring could offer real practical benefits. When ONI values reach El Niño thresholds, scenario-based projections could immediately simulate the possible effects on food inflation. This would allow earlier responses, such as releasing public grain stocks, issuing import licenses, or preparing targeted fiscal support. Previous studies show that rice price spikes often happen faster than policy actions, increasing hardship for vulnerable households [17, 31]. Using climate-enhanced forecasting can help reduce this delay.
Integrating climate signals early into monetary policy could also strengthen credibility. Publishing climate-adjusted inflation projections next to standard forecasts would signal transparency and place Indonesia among the countries that already integrate climate risks into core policy frameworks [35, 36]. The aim is not only to improve prediction accuracy but also to support quicker and better-targeted decisions in an environment where climate variability is increasing.
Climate-risk indicators may also play an important role in monetary policy communication. As Yusuf and Francisco [37] noted, Southeast Asian economies face long-standing vulnerability to climate variability, so being open about these risks can help maintain public trust. Showing the expected impact of a strong El Niño event on inflation would signal that Bank Indonesia is preparing for future risks rather than responding only after shocks occur [33, 38].
Several European central banks have already built climate scenario analysis into their forecasting frameworks, using climate transition and physical risk metrics when projecting inflation and growth [33, 39]. While Indonesia’s policy environment is different, the main idea is similar: central banks must update their analytical tools to remain effective in a world where climate shocks are becoming more frequent. For Indonesia, adopting these practices could also improve coordination between monetary, fiscal, trade, and agricultural policies, especially in managing rice stocks, organizing imports, and strengthening social protection. Climate-informed forecasting, therefore, serves not only as a technical improvement but also as a way to build better cross-sector preparedness.
Finally, the issue goes beyond macroeconomic stability. Rice price volatility directly affects human welfare. Poorly managed inflation increases the risk of hunger, malnutrition, and poverty [36]. Mirzabaev et al. [35] warned that climate change will strongly threaten food security in the Global South unless early-warning systems and adaptive strategies are improved. By integrating ENSO signals into rice inflation forecasting, this study offers a practical step toward stronger early-warning systems. Treating climate indicators as core inputs, as opposed to peripheral factors, enables policymakers to formulate and implement measures with greater timeliness and enhanced efficacy. In this sense, using ENSO-based climate signals is both an academic contribution and a real move toward strengthening resilience in the face of growing climate shocks.
This study examined how climate anomalies, especially ENSO events (El Niño and La Niña), are linked to rice price movements in Indonesia. Using monthly data from 2010 to 2023, we compared traditional time-series models (ARIMA and ARIMAX) with two machine learning models, Random Forest and XGBoost. The results show that ARIMA-type models can follow normal price movements, but their accuracy drops during periods of climate stress. XGBoost provides the best overall performance, with the lowest errors and highest R², particularly around the 2015–2016 El Niño and the 2023 drought episode.
A key result is that macro-financial variables still explain most of the variation in rice prices under normal conditions. The policy interest rate, inflation and the exchange rate are consistently the most important predictors in the model. Climate indicators such as the Oceanic Niño Index and ENSO phase dummies play a smaller role on average, but they become more important during extreme events. Around El Niño and La Niña episodes, these climate variables help the model capture sharp price changes that conventional models often miss. Simple checks using rice production data also suggest that El Niño episodes tend to increase the risk of weaker harvests, while La Niña is more often associated with more favourable production outcomes, even if the relationship is not perfectly deterministic.
These findings have clear implications for policy. They show that it is both possible and useful to include climate information in rice price and inflation forecasting for a country that is highly exposed to weather shocks. For Bank Indonesia and food security agencies, ENSO indicators can be used as an early warning tool. When El Niño risk increases, climate-augmented forecasts can support faster decisions on stock releases, import planning and social assistance, so that poor households are better protected from sudden increases in rice prices.
This study also has limitations. The models do not include direct measures of government interventions, logistics disruptions or global market shocks. They are also not designed to separate a “pure” climate effect from indirect effects through inflation, the exchange rate or interest rates. In this sense, ENSO indicators should be viewed as risk signals that interact with domestic policies and market conditions, rather than as the only driver of price changes. Future research could extend this framework by adding information on reserves, trade measures, irrigation and input markets, and by testing models that allow relationships to change over time. Even with these weaknesses, the main message is clear: in the Indonesian rice economy, forecasting systems that combine economic fundamentals with climate indicators are an important tool for protecting both macroeconomic stability and household welfare.
[1] Diffenbaugh, N.S., Burke, M. (2019). Global warming has increased global economic inequality. Proceedings of the National Academy of Sciences, 116(20): 9808-9813. https://doi.org/10.1073/pnas.1816020116
[2] World Bank International Development Association (IDA). (2018). Agriculture: Results. https://ida.worldbank.org/en/topics/results/agriculture.
[3] Respati, W.M., Gafara, W.G., Al Izzati, R. (2016). Net consumer of rice and poverty in Indonesia: Simulation using equivalent variation. Jurnal Ilmu Ekonomi Pembangunan, 16(2): 43-49. https://doi.org/10.20961/jiep.v16i2.2346
[4] UNICEF. (2023). Fortification of rice in Indonesia: Briefing notes. https://www.unicef.org/indonesia/media/20956/file/Briefing%20notes%20fortification%20of%20rice%20-%20eng.pdf.
[5] Bellemare, M.F. (2015). Rising food prices, food price volatility, and social unrest. American Journal of Agricultural Economics, 97(1): 1-21. https://doi.org/10.1093/ajae/aau038
[6] Heino, M., Puma, M.J., Ward, P.J., Gerten, D., Heck, V., Siebert, S., Kummu, M. (2018). Two-thirds of global cropland area impacted by climate oscillations. Nature Communications, 9: 1257. https://doi.org/10.1038/s41467-017-02071-5
[7] Gentle, P., Maraseni, T.N. (2012). Climate change, poverty and livelihoods: Adaptation practices by rural mountain communities in Nepal. Environmental Science & Policy, 21: 24-34. https://doi.org/10.1016/j.envsci.2012.03.007
[8] Arouri, M., Nguyen, C., Ben Youssef, A. (2015). Natural disasters, household welfare, and resilience: Evidence from rural Vietnam. World Development, 70: 59-77. https://doi.org/10.1016/j.worlddev.2014.12.017
[9] Limsakul, A. (2019). Impacts of El Niño–Southern Oscillation (ENSO) on rice production in Thailand during 1961–2016. Environment and Natural Resources Journal, 17(4): 30-42. https://doi.org/10.32526/ennrj.17.4.2019.29
[10] Tangang, F., Chung, J.X., Juneng, L., Supari, et al. (2020). Projected future changes in rainfall in Southeast Asia based on CORDEX-SEA multi-model simulations. Climate Dynamics, 55: 1247-1267. https://doi.org/10.1007/s00382-020-05322-2
[11] Cashin, P., Mohaddes, K., Raissi, M. (2017). Fair weather or foul? The macroeconomic effects of El Niño. Journal of International Economics, 106: 37-54. https://doi.org/10.1016/j.jinteco.2017.01.010
[12] Cevik, S., Jalles, J.T. (2023). Eye of the storm: The impact of climate shocks on inflation and growth. International Monetary Fund. https://www.imf.org/en/publications/wp/issues/2023/04/28/eye-of-the-storm-the-impact-of-climate-shocks-on-inflation-and-growth-532661.
[13] Silva, R.F., Barreira, B.L., Cugnasca, C.E. (2021). Prediction of corn and sugar prices using machine learning, econometrics, and ensemble models. Engineering Proceedings, 9(1): 31. https://doi.org/10.3390/engproc2021009031
[14] Rasyid Muchtar, I., Afiyati, A. (2024). Comparison of linear regression and random forest algorithms for premium rice price prediction (case study: West Java). Jurnal Indonesia Sosial Teknologi, 5(7): 3122-3133. https://doi.org/10.59141/jist.v5i7.1184
[15] NOAA Climate Prediction Center. (2023.). Cold & warm episodes by season (Oceanic Niño Index, ONI). National Oceanic and Atmospheric Administration.
[16] Kotz, M., Levermann, A., Wenz, L. (2024). The economic commitment of climate change. Nature, 628(8008): 551-557. https://doi.org/10.1038/s41586-024-07219-0
[17] Muslim, A. (2015). Rice price volatility and its implication to food security in Indonesia. https://www.researchgate.net/publication/302192030_Rice_price_volatility_and_its_implication_to_food_security_in_Indonesia.
[18] Paul, R.K., Yeasin, M., Kumar, P., Kumar, P., Balasubramanian, M., Roy, H.S., Paul, A.K., Gupta, A. (2022). Machine learning techniques for forecasting agricultural prices: A case of brinjal in Odisha, India. PLoS ONE, 17(7): e0270553. https://doi.org/10.1371/journal.pone.0270553
[19] Breiman, L. (2001). Random forests. Machine Learning, 45(1): 5-32. https://doi.org/10.1023/A:1010933404324
[20] Chen, T., Guestrin, C. (2016). XGBoost: A scalable tree boosting system. In Proceedings of the 22nd ACM SIGKDD International Conference on Knowledge Discovery and Data Mining, San Francisco, USA, pp. 785-794. https://doi.org/10.1145/2939672.2939785
[21] Bergmeir, C., Benítez, J.M. (2012). On the use of cross-validation for time series predictor evaluation. Information Sciences, 191: 192-213. https://doi.org/10.1016/j.ins.2011.12.028
[22] Cai, X., Sakemoto, R. (2022). El Niño and commodity prices: New findings from partial wavelet coherence analysis. Frontiers in Environmental Science, 10: 893879. https://doi.org/10.3389/fenvs.2022.893879
[23] Erdogan, S., Kartal, M.T., Pata, U.K. (2024). Does climate change cause an upsurge in food prices? Foods, 13(1): 154. https://doi.org/10.3390/foods13010154
[24] Wang, A., Ramadhani, N.F. (2023). Roundup: Indonesia’s rice production disrupted by El Nino, raising inflation. Xinhua. https://english.news.cn/20231104/cff951e2bbc640cc905d1ce1686f9851/c.html.
[25] Christina, B., Kurniawati, D. (2024). Indonesia’s January drought points to lower rice harvest, higher imports. Reuters. https://www.reuters.com/markets/asia/indonesias-january-drought-points-lower-rice-harvest-higher-imports-2024-02-01/.
[26] Ansari, A., Lin, Y.P., Lur, H.S. (2021). Evaluating and adapting climate change impacts on rice production in Indonesia: A case study of the Keduang subwatershed, Central Java. Environments, 8(11): 117. https://doi.org/10.3390/environments8110117
[27] Ludher, E.K. (2024). La Niña: Boon or bane for Southeast Asia’s food security? Eco-Business. https://www.eco-business.com/opinion/la-nina-boon-or-bane-for-southeast-asias-food-security/.
[28] Herho, S.H.S., Brahmana, F., Herho, K.E.P., Irawan, D.E. (2021). Does ENSO significantly affect rice production in Indonesia? A preliminary study using computational time-series approach. International Journal of Data Science, 2(2): 69-76. https://doi.org/10.18517/ijods.2.2.69-76.2021
[29] Christina, B., Asprihanto, H. (2023). “A bit extreme”: Indonesian rice prices surge as drought crimps harvest. Reuters. https://www.reuters.com/markets/commodities/a-bit-extreme-indonesian-rice-prices-surge-drought-crimps-harvest-2023-09-01/.
[30] Wu, N., Zhang, Z., Lin, B. (2024). Responses of financial stress and monetary policy to global warming: Evidence from China. International Review of Financial Analysis, 92: 103092. https://doi.org/10.1016/j.irfa.2024.103092
[31] Ceballos, F., Kramer, B., Robles, M. (2019). The feasibility of picture-based insurance (PBI): Smartphone pictures for affordable crop insurance. Development Engineering, 4: 100042. https://doi.org/10.1016/j.deveng.2019.100042
[32] Headey, D.D., Ruel, M.T. (2020). Economic shocks and child wasting (IFPRI Discussion Paper 1941). International Food Policy Research Institute. https://ssrn.com/abstract=3641543.
[33] European Central Bank. (2023). ECB publishes new climate-related statistical indicators to narrow climate data gap. https://www.ecb.europa.eu/press/pr/date/2023/html/ecb.pr230124~c83dbef220.en.html.
[34] Odongo, M.T., Misati, R.N., Kamau, A.W., Kisingu, K.N. (2022). Climate change and inflation in Eastern and Southern Africa. Sustainability, 14(22): 14764. https://doi.org/10.3390/su142214764
[35] Mirzabaev, A., Bezner Kerr, R., Hasegawa, T., Pradhan, P., Wreford, A., Tirado von der Pahlen, M.C., Gurney-Smith, H. (2023). Severe climate change risks to food security and nutrition. Climate Risk Management, 39: 100473. https://doi.org/10.1016/j.crm.2022.100473
[36] FAO. (2023). Early warning tools and systems for emerging issues in food safety. https://doi.org/10.4060/cc9162en
[37] Yusuf, A.A., Francisco, H.A. (2009). Climate change vulnerability mapping for Southeast Asia. Economy and Environment Program for Southeast Asia (EEPSEA). https://www.preventionweb.net/files/7865_12324196651MappingReport1.pdf.
[38] Krogstrup, S., Oman, W. (2019). Macroeconomic and financial policies for climate change mitigation: A review of the literature. International Monetary Fund. https://www.imf.org/en/publications/wp/issues/2019/09/04/macroeconomic-and-financial-policies-for-climate-change-mitigation-a-review-of-the-literature-48612.
[39] Battiston, S., Monasterolo, I., Min, J., Riahi, K., van Ruijven, B. (2021). Enabling or hampering? Climate risk and the role of finance in the low-carbon transition. SSRN Electronic Journal. https://doi.org/10.2139/ssrn.3748642