Fikri Heriyanto*![]() | Deris Stiawan
| Deris Stiawan![]() | Samsuryadi Samsuryadi
| Samsuryadi Samsuryadi![]() | Dian Palupi Rini
| Dian Palupi Rini![]() | Moh'D Suliman Shakkah
| Moh'D Suliman Shakkah![]()
© 2025 The authors. This article is published by IIETA and is licensed under the CC BY 4.0 license (http://creativecommons.org/licenses/by/4.0/).
OPEN ACCESS
Tourism plays a crucial role in achieving the Sustainable Development Goals (SDGs). However, in many developing regions, tourism data systems remain fragmented and poorly aligned with sustainability frameworks. Indonesia’s Electronic-Based Government System (SPBE) offers an opportunity to integrate dispersed indicators into a coherent governance model. This study seeks to harmonize tourism-related indicators with SDG targets using the SPBE data architecture and to assess their potential for evidence-based planning in South Sumatra Province. A dataset of 67 indicators from the National Tourism Development Index (IPKN) and provincial sources (2015-2023) was compiled. Indicators were mapped through SPBE Reference (RAD) and Domain (DAD) architectures, then manually aligned with SDGs. Data validation included triangulation, field verification, and statistical normality tests. Forecasting for 2015-2030 was conducted using linear regression with residual diagnostics.
Results: Of the 67 indicators, 27 were directly linked to SDG targets. Eighteen indicators with consistent data series were used for forecasting. The findings indicate positive trends: the average years of schooling increased from 8.3 years (2015) to a projected 9.2 years (2030), access to safe drinking water improved from 75.9% (2023) to 82% (2030), and domestic tourist visits rose from 4.0 million (2015) to 6.2 million (2030). These results highlight progress in education, infrastructure, and tourism development. Integrating tourism indicators into the SPBE architecture provides a replicable model for subnational SDG monitoring. While linear regression has limitations for long-term forecasting, the framework demonstrates the potential of e-government to support evidence-based policy, data interoperability, and sustainable tourism governance in resource-constrained regions.
sustainable tourism, SDGs, e-governance, SPBE, data architecture, South Sumatra, digital transformation
The 2030 Agenda for Sustainable Development calls for integrated and evidence-based policy frameworks to accelerate progress across multiple sectors. Tourism plays a strategic role in this agenda. Beyond its contribution to economic growth and employment, tourism also supports cultural heritage, infrastructure, and environmental stewardship [1, 2]. However, as emphasized by UNWTO [2] and Hall [3], governments often struggle to monitor tourism’s contribution to the Sustainable Development Goals (SDGs) due to fragmented datasets and weak interoperability among institutions. Without integrated data frameworks, SDG monitoring risks producing partial and inconsistent evidence, thereby limiting its policy relevance [3, 4].
Digital governance has been proposed as a solution to these challenges. Global scholarship highlights how e-government and open data systems enhance transparency, interoperability, and accountability [5-8]. Janssen et al. [5] demonstrate the importance of standardized architectures in aligning policy and data, while Gil-Garcia et al. [6] and Dawes [7] underscore socio-technical barriers to adoption in developing contexts. Zuiderwijk et al. [8] further note that open data systems can support evidence-based policy, but only when institutional and technical capacity is in place. Comparative studies in Asia show that integrated e-government platforms accelerate SDG monitoring, as evidenced in Vietnam, India, and the Philippines [9]. Despite these advances, few studies examine how such frameworks can be applied to sector-specific datasets such as tourism.
In Indonesia, the Electronic-Based Government System (Sistem Pemerintahan Berbasis Elektronik, SPBE) has been formally adopted to promote data interoperability between national and subnational governments [10]. Several empirical studies at municipal and provincial levels [11-14] show that SPBE improves accountability, efficiency, and information flow in local governance. For example, Supriadi et al. [11] highlight its role in administrative reform, while Nursafitri and Jayadi [14] evaluate its maturity in Bekasi City. These studies provide useful contextual insights but remain descriptive and do not assess how SPBE can be operationalized to integrate sectoral indicators—particularly tourism—with SDG monitoring.
This gap motivates the present study. We investigate how SPBE’s Reference Architecture Data (RAD) and Domain Architecture Data (DAD) can be mobilized to align sustainable tourism indicators with SDG monitoring at the provincial level. Focusing on South Sumatra, Indonesia, this research contributes a replicable framework that bridges global debates on e-government and sustainable development with localized empirical evidence. The contribution is twofold: first, it enriches academic discussions on the intersection of digital governance, data interoperability, and the SDGs; second, it provides policymakers with a practical tool for strengthening evidence-based planning in the tourism sector.
Tourism is widely recognized as a multidimensional contributor to the Sustainable Development Goals (SDGs). It stimulates economic growth, fosters cultural preservation, and promotes environmental stewardship [1, 2]. Gössling and Hall [1] argue that tourism should be viewed as a cross-sectoral phenomenon linking infrastructure, education, and sustainability. However, UNWTO [2] and Hall [3] emphasize that many countries, particularly in the Global South, lack reliable integrated datasets for monitoring tourism’s contribution to the SDGs. Dredge and Jamal [4] warn that without interoperable data frameworks, tourism research risks producing fragmented findings with limited policy relevance.
Digital governance has emerged as a potential solution. Janssen et al. [5] highlight the role of standardized e-government architectures in enabling policy alignment, while Gil-Garcia et al. [6] and Dawes [7] stress that adoption often faces socio-technical barriers in developing contexts. Zuiderwijk et al. [8] further note that open government data can enhance accountability and evidence-based decision-making, provided that institutional capacity is sufficient. Comparative studies in Asia such as those in Vietnam, India, and the Philippines, confirm that integrated e-government platforms accelerate SDG monitoring and facilitate cross-sectoral planning [9]. Nevertheless, these studies largely focus on national-level applications and seldom address sector-specific contexts such as tourism.
In Indonesia, the Electronic-Based Government System (SPBE) has been widely adopted to promote data integration across government institutions [10]. Local empirical studies indicate that SPBE contributes to improved administrative efficiency, interoperability, and transparency [11-14]. For example, Supriadi et al. [11] examine SPBE’s role in strengthening accountability in local government, while Nursafitri and Jayadi [14] assess its maturity in Bekasi City. Although these works provide valuable insights, they remain descriptive and focus primarily on general governance reform rather than sectoral policy integration.
This imbalance highlights a clear research gap. Global scholarship has theorized the potential of digital governance for SDG monitoring [1-9], while Indonesian studies have largely assessed SPBE implementation in local administration [10-14]. However, few works explicitly link e-government architecture to sectoral datasets such as tourism. The present study addresses this gap by operationalizing SPBE’s Reference Architecture Data (RAD) and Domain Architecture Data (DAD) to align tourism indicators with SDG monitoring at the provincial level. This contribution not only advances academic debates on e-government and sustainable development but also provides a replicable framework for evidence-based policymaking in subnational contexts.
This study uses the digital transformation of regional public administration as a lens to examine the disconnect between local tourism data governance and global SDG alignment. To generate tourism datasets aligned with SPBE and the SDGs, the study follows several stages, which can be adapted for future research. The dataset compilation followed five main steps:
•Data Sources: 67 indicators from the National Tourism Development Index (IPKN) and regional datasets (2015-2023), validated with provincial agencies.
•Architecture Mapping: Indicators were classified through the SPBE RAD/DAD framework (up to Level 6 granularity).
•SDG Harmonization: Manual mapping aligned indicators with SDGs, producing 27 directly linked indicators.
•Validation: Data were triangulated through field visits, Shapiro-Wilk and Kolmogorov-Smirnov tests;
•Forecasting: Linear regression (2015-2030) using Excel LINEST; residual normality was confirmed.
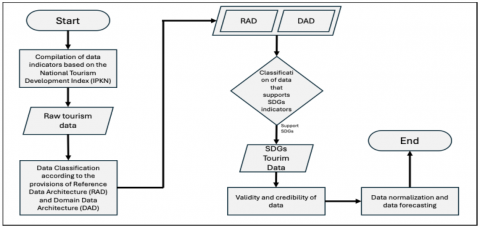
The compilation process employed techniques including literature review, classification, normalization, and forecasting, as illustrated in Figure 1. Data collected from government units were often unstructured and unformatted. These were manually processed in Microsoft Excel following regulatory standards. Researchers compiled the information into new datasets. Previous studies in Indonesia have also developed datasets, for instance by using public opinion to examine tourism data architecture [15].
Step 1: Data sources
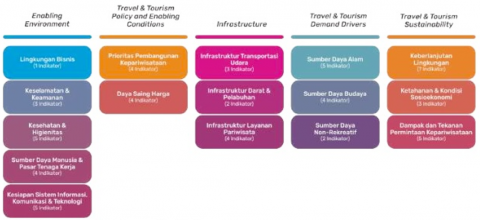
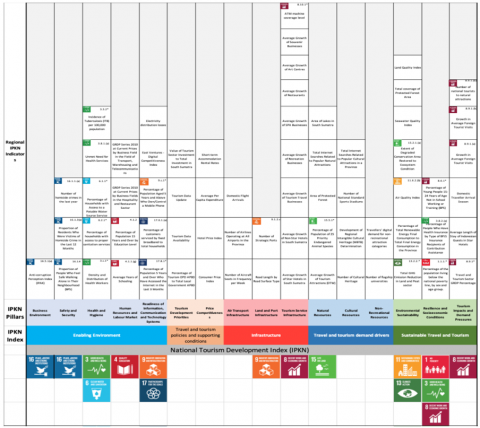
The study began by collecting variables from the 2022 IPKN, which distinguishes it from other approaches [16]. As illustrated in Figure 2, the IPKN framework has 61 indicators, 16 pillars, and 5 sub-indices. Although these national indicators served as the primary reference, they were modified to suit the local context of South Sumatra. Numerous local government organizations that have tasks and data directly related to national indicators conduct literature reviews as part of this process.
This integration makes the dataset unique because it combines tourism variables with social, economic, and infrastructure indicators rarely considered in conventional tourism research. The use of SPBE data further enhanced the dataset’s integration and accountability, thereby strengthening its policy relevance. SPBE data improved integration and accountability, reinforcing the dataset’s policy significance.
The factors that form the basis of this research's dataset collection put it in a unique position to examine how tourism development relates to the Sustainable Development Goals (SDGs). The procedure started by consulting the Republic of Indonesia's Ministry of Tourism's 2022 National Tourism Development Index (IPKN), which consists of 61 indicators, 16 pillars, and 5 sub-indices. The original guidelines were derived from this national framework, which was later modified to meet the administrative and contextual requirements of South Sumatra Province and its cities and districts. Local government organizations whose data obligations align with the national indicators participated in a scientific literature evaluation to carry out the adaptation. When possible, national-level indicators were adjusted to concentrate on the regional level as part of the scientific process for data compilation. However, because there are no regional equivalents, several indicators that are only created by the central government, such as the Corruption Perception Index, were kept in their original national form. On the other hand, national-level datasets were substituted by data released by the Government of South Sumatra Province in cases where local statistics were available. Compared to broad national trends, these localized datasets provide a more accurate and context-specific representation of the region's tourism-related development.
The usefulness of the secondary data utilized in the study is greatly increased by this harmonization process. The study offers a multifaceted and localized analysis of tourism's role in accomplishing various SDG targets by integrating a variety of sectoral variables, such as visitor visits to natural and cultural destinations, domestic tourism growth, internet access, public safety, average years of education, sanitation, and access to clean water. Conventional tourist study rarely finds this degree of integration. As a result, the final dataset is both extremely pertinent to regional development policies and rigorously scientific. The results of this harmonization are displayed in Table 1, which demonstrates how the South Sumatra provincial government's accessible indicators were compared with national IPKN indicators to serve as the foundation for additional study.
A literature review on the relevant South Sumatra provincial government was conducted in order to harmonize the indicators in fourth table, and the results were released by BPS via https://sumsel.bps.go.id/. The data output for 41 harmonized indicators is identical to that of the national data series.
Figure 1. Activity flow of tourism dataset development based on IPKN and SPBE
Figure 2. Framework of the National Tourism Development Index (IPKN) [16]
Table 1. Harmonization of central IPKN indicators with regions
|
No. |
National Government IPKN Indicators |
Adjustment of IPKN Indicators in the South Sumatra Provincial Government |
|
1 |
Safety walking alone at night in public spaces |
Proportion of People Who Feel Safe Walking Alone in Their Neighborhood |
|
2 |
Murder rate |
Proportion of Population Who Were Victims of Murder in the Last 12 Months |
|
3 |
Organized violence |
Number of Murder Crime Cases in the Last Year |
|
4 |
Health worker density |
Density and Distribution of Health Workforce |
|
5 |
Basic sanitation users (toilets) |
Percentage of Households Having Access to Adequate Sanitation Services |
|
6 |
Basic drinking water users (PDAM, bottled, or well) |
Percentage of Households Having Access to Clean Drinking Water Source Services |
|
7 |
Availability of beds in hospitals |
Unmet Need for Health Services |
|
8 |
Number of people affected by infectious diseases |
Incidence of Tuberculosis (ITB) per 100,000 Population |
|
9 |
Number of graduates of junior high or secondary schools |
Percentage of Population Aged 15 Years and Over Based on Education Level |
|
10 |
Labor productivity in the hotel and restaurant sector |
GRDP Series 2010 Based on Fixed Prices by Business Sector: Hotels and Restaurants |
|
11 |
Labor productivity in transportation, warehousing, and telecommunications |
GRDP Series 2010 Based on Current Prices According to Business Sector Transportation, Warehousing, and Telecommunications |
|
12 |
Number of internet users |
Percentage of Population Aged 5 Years and Over Who Have Accessed the Internet in the Last 3 Months |
|
13 |
Broadband internet customers |
Percentage of Customers Served by Fixed Broadband Internet Access Networks to Total Households |
|
14 |
Smartphone internet customers |
Percentage of Population Aged 5 Years and Over Who Own/Control Cellular Phones |
|
15 |
Digital Competitiveness Index 2022 |
East Ventures - Digital Competitiveness Index |
|
16 |
Network Shrinkage |
Electricity Distribution Shrinks |
|
17 |
Use of the provincial government budget in the tourism sector |
Percentage of GRDP from Travel and Tourism Sector |
|
18 |
Tourism sector investment to total investment |
Value of Tourism Sector Investment Against Total Investment in South Sumatra |
|
19 |
Purchasing Power Parity |
Average Per Capita Expenditure |
|
20 |
Aircraft seat availability |
Number of Aircraft Seats in Frequency per Week |
|
21 |
Number of connections to other airports outside the province |
Domestic Flight Arrival |
|
22 |
Length of paved road |
Road Length According to Road Surface Type |
|
25 |
Availability of registered Vehicle rental companies for tourism activities |
Average Growth of Travel and Tourism Business |
|
26 |
Number of world heritage natural sites (included in UNESCO assessment) |
Average Growth of Tourist Attractions (DTW) |
|
27 |
The number of known species of plants and animals |
Percentage of Population of 25 Priority Endangered Animal Species |
|
28 |
Area of lakes, rivers, and swamps |
Area of Lakes in South Sumatra |
|
29 |
Number of world heritage cultural sites (included in UNESCO assessment) |
Number of Cultural Heritage |
|
30 |
The amount of intangible cultural wealth |
Development of Regional Intangible Cultural Heritage (WBTB) Determination |
|
31 |
Greenhouse gas emissions production |
Amount of GHG Emission Reduction in Land and Peat Sector |
|
32 |
Renewable energy consumption |
Percentage of Total Final Renewable Energy Consumption to Total Final Energy Consumption in the Province |
|
33 |
Reduced land cover (deforestation rate) |
Area of Degraded Conservation Areas Whose Ecosystem Conditions Have Been Restored |
|
34 |
Average proportion of key biodiversity covered by conservation areas |
Land Quality Index |
|
35 |
Poverty rate |
Percentage of population living below the national poverty line, by sex and age group |
|
36 |
National Health Insurance Coverage |
Percentage of Population Having Health Insurance According to Type of BPJS Insurance Recipient of Contribution Assistance |
|
37 |
Young workers who attend school or take training |
Percentage of Young People Aged 15-24 Years Who Are Not Currently in School, Working, or Taking Training (BPS) |
|
38 |
GRDP of the travel and tourism sector |
Percentage of GRDP from Travel and Tourism Sector |
|
39 |
length of stay of tourists |
Average Length of Stay of Indonesian Guests at Star Hotels |
|
40 |
Number of visitors to cultural tourist attractions |
Number of Domestic Tourists to Cultural Destinations |
|
41 |
Number of visitors to natural tourist attractions (marine, ecotourism, and adventure) |
Number of Domestic Tourists to Natural Destinations |
Step 2: Architecture mapping
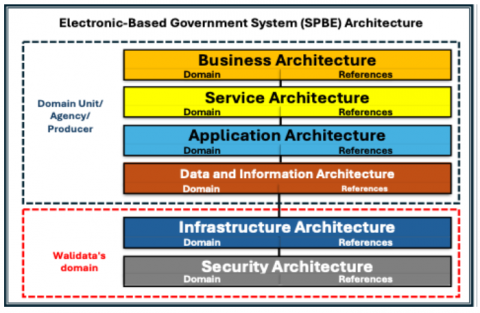
The second stage involved applying the SPBE framework to build the RAD and DAD structures. SPBE architecture integrates processes, data, infrastructure, applications, and security to ensure service interoperability [17]. The SPBE Reference Architecture and the SPBE Domain Architecture make up the SPBE architecture. The SPBE Architecture framework is shown in Figure 3. The data and information components of the SPBE architecture are the needs used in business processes and services that have been classified in the architecture and domain references that seek to determine what data is used in the independent SPBE business and service processes that are in line with the One Data Indonesia principle.
The RAD framework categorizes data into six levels. In this study, Levels 3 to 6 were newly developed for provincial tourism indicators, while Levels 1 and 2 followed the national RAD ID.
The RAD code at the national level is only at level 2, but the RAD code generated in this study is arranged in detail up to level 6, or specifically at the implementing unit in the agency. This is because, according to the arrangement in Table 2, each indicator generates a new identity in the form of a data reference code for each indicator for IPKN. The code arrangement is based on the classification of the IPKN indicator and adjusted to the code in the RAD. As demonstrated in Table 3, the indicator "Proportion of People Who Feel Safe Walking Alone in Their Neighborhood" has a RAD code; Table 1 has modified the RAD ID's layout.
Figure 3. Electronic-Based Government System (SPBE) architecture [10]
Table 2. Tourism sector SPBE data and information architecture (RAD) literature
|
Exist |
Renewables |
||||
|
Basic Data |
Thematic Data |
Data Topic |
Subtopic data |
Sub-subtopic data |
|
|
Presidential Regulation No. 132 of 2022 on National SPBE Architecture [10] |
Governor Decree No. 272/Diskominfo/2024 on South Sumatra Prov SPBE Architecture 2024-2029 [18] and Law No. 10 of 2009 on Tourism [19]; |
Law No. 10 of 2009 on Tourism [19]; Government Regulation Number 50 of Year 2011 on Ripparnas, Year 2010-2025 [20] |
IPKN customized to the needs of local government indicators from desk research. |
||
|
Level 1 |
Level 2 |
Level 3 |
Level 4 |
Level 5 |
Level 6 |
For instance, the indicator ‘Proportion of People Who Feel Safe Walking Alone in Their Neighborhood’ was assigned a new RAD ID: RAD.02.11.01.04.A2.1. This coding approach was applied consistently across all indicators. The DAD table was prepared in compliance with Governor Decree No. 272/Diskominfo/2024, with dataset definitions and purposes drawn from official sources such as BPS and provincial agencies.
Step 3: SDG harmonization
The third stage involved harmonizing 67 tourism indicators with the SDGs. This step enhanced the dataset’s originality by linking traditional tourism indicators to global SDG targets, offering a more comprehensive and policy-relevant perspective. Each tourism indicator was systematically mapped to SDG goals and targets to ensure accurate representation of tourism’s contribution to infrastructure, education, inclusive growth, and environmental protection. This process followed a structured scientific approach, consistent with Guo et al. [17], who used SDG-based indicators in big data analyses to evaluate environmental and biodiversity issues. This creative integration offers a thematic mapping between the worldwide development framework and the dynamics of local tourism, hazards to biodiversity, and other issues facing global development. This creative integration offers a thematic mapping between the worldwide development framework and the dynamics of local tourism.
Table 3. Preparation of reference data and information architecture (RAD) ID code
|
|
Level 1 |
Level 2 |
Level 3 |
Level 4 |
Level 5 |
Level 6 |
|
Level 1 |
RAD.02 |
|
||||
|
Level 2 |
|
RAD.02.11 |
|
|||
|
Level 3 |
|
RAD.02.11.01 |
|
|||
|
Level 4 |
|
RAD.02.11.01.04 |
|
|||
|
Level 5 |
|
RAD.02.11.01.04.A2 |
|
|||
|
Level 6 |
|
RAD.02.11.01.04.A2.1 |
||||
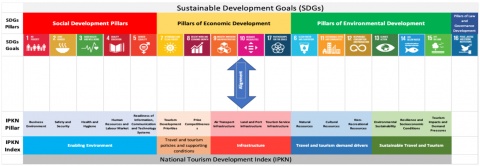
The IPKN consists of five indices and sixteen pillars with 67 indicators, while the SDGs encompass seventeen goals and 169 targets. Harmonization between them established a methodological connection between national and global frameworks (Figure 4). The process clarified tourism’s linkage with SDG goals, notably education (SDG 4), industry and infrastructure (SDG 9), peace and justice (SDG 16), clean water (SDG 6), and economic growth (SDG 8). This harmonization adds substantial scientific value to the secondary data used in the study. In addition to providing descriptive statistics on tourism, the generated dataset can be used as an analytical tool to gauge how much tourism contributes to regional SDG achievement, particularly in Indonesia's South Sumatra Province.
Figure 5 provides a detailed description of the harmonization in Figure 4, wherein 67 IPKN indicators are matched with SDGs indicators that provide the same results, yielding 40 additional indicators as supporters and 27 tourist indicators supporting SDGs. Manual mapping was verified through literature review and cross-checked with the regional SDG database at http://sdgs.sumselprov.go.id.
Step 4: Validation
The fourth stage involved collecting 27 datasets from provincial government agencies in South Sumatra for the 2015-2023 period. Data for 2024 were still under compilation and unavailable during the study. Kelly et al. [21] validation procedures, based on credibility and confirmability criteria, were used to ensure the reliability of secondary data from official archives and online publications [21]. A triangulation technique was used to identify inconsistencies and confirm data accuracy by cross-checking with independent sources [22]. By making sure that the reported values are methodically confirmed rather than taken for granted, this approach helps to strengthen the dataset's robustness.
Figure 4. Harmonizing SDGs and IPKN approaches
Figure 5. Alignment of tourism indicators to SDGs indicators
Researchers performed field visits to agencies responsible for data production and maintenance, comparing published figures with institutional records to ensure validity. Direct validation with agency representatives improved stakeholder trust and confirmed the dataset’s relevance for evidence-based tourism policy. Nine of the 27 SDG-linked indicators were incomplete, primarily due to irregular publication or centralized data authority. The remaining 18 validated indicators from provincial agencies formed the final dataset. By focusing on consistent and regionally representative indicators, the normalization process enhanced the dataset’s analytical robustness and relevance for sustainable tourism–SDG integration.
The sampling frame comprised 67 indicators derived from the National Tourism Development Index (IPKN) and supplementary provincial datasets covering the period 2015-2023. The unit of analysis was each tourism-related indicator harmonized with socio-economic and environmental variables, such as education, sanitation, infrastructure, and digital access. All data were obtained from official government sources, with formal access permissions provided by the South Sumatra Provincial Government, as documented in institutional agreements and support letters. During the validation process, 9 of the 27 SDG-linked indicators were identified as incomplete or inconsistently reported across the study period, primarily due to irregular publication schedules or exclusive central government authority over data release. These indicators were therefore excluded from the forecasting stage to avoid potential bias. The final analysis was conducted using 18 consistently available indicators, ensuring reproducibility and strengthening the statistical validity of the findings.
Step 5: Forecasting
The fifth stage involved normalizing and forecasting 18 tourism indicators supporting the SDGs. Testing model assumptions is crucial for statistical forecasting. The Kolmogorov–Smirnov and Shapiro-Wilk tests were applied to assess normality and ensure the model’s reliability. As long as they are applied in conformity with the statistical goals and features of the data being examined, both of these techniques can be scientifically compared with linear regression [23, 24]. The most fundamental data is analyzed first in this exam. Normality testing involved checking variable distributions against a standard normal distribution using z-scores. In the Kolmogorov–Smirnov test, significance values below 0.05 indicated non-normal data [25]. A data distribution is considered abnormal if p is less than 0.05 and normal if p is greater than 0.05.
Figure 6. Normalization result output
Table 4. Results of data normalization on tourism indicators
|
No. |
Indicators |
Unit |
Normality Test |
|||||||||
|
Mean |
Std. Deviation |
Skewness |
Std. Error of Skewness |
Kurtosis |
Std. Error of Kurtosis |
Shapiro-Wilk |
P-Value of Shapiro-Wilk |
Max |
Min |
|||
|
1 |
Proportion of Residents Who Were Victims of Homicide Crime in the Last 12 Months |
Percent |
0.002 |
3.882×10⁻⁴ |
-0.747 |
0.845 |
0.422 |
1,741 |
0.954 |
0.77 |
9.00×10⁻⁴ |
0.002 |
|
2 |
Number of homicide crimes in the last year |
Case |
122625 |
28560 |
-0.492 |
0.752 |
-0.679 |
1,481 |
0.953 |
0.743 |
77000 |
161000 |
|
3 |
Percentage of households with access to proper sanitation services |
% Household |
71107 |
6.58 |
-0.255 |
0.752 |
-1,772 |
1.481 |
0.903 |
0.31 |
61300 |
78620 |
|
4 |
Percentage of households with access to safe drinking water sources |
% Household |
75,874 |
10,358 |
-0.247 |
0.752 |
-2,144 |
1,481 |
0.848 |
0.091 |
63.27 |
87.19 |
|
5 |
Unmet Need for Health Services |
Percent |
4,322 |
0.567 |
-1,295 |
0.845 |
1,338 |
1,741 |
0.883 |
0.283 |
3.32 |
4.85 |
|
6 |
Incidence of Tuberculosis (ITB) per 100,000 Population |
per 100,000 population |
196667 |
55,084 |
-0.458 |
0.845 |
-0.431 |
1,741 |
0.972 |
0.904 |
112000 |
262000 |
|
7 |
Average Years of Schooling |
Percent |
8,539 |
0.196 |
0.1 |
0.717 |
-1,199 |
1.4 |
0.96 |
0.794 |
8.26 |
8.82 |
|
8 |
Percentage of Population 15 Years and Over by Education Level |
Percent |
21,074 |
0.445 |
0.214 |
0.717 |
-1,203 |
1.4 |
0.94 |
0.577 |
20.46 |
21.69 |
|
9 |
Percentage of Population 5 Years and Over Who Have Accessed the Internet in the Last 3 Months |
Percent |
40,794 |
18,318 |
0.176 |
0.717 |
-1,556 |
1.4 |
0.931 |
0.494 |
17.71 |
66.66 |
|
10 |
Percentage of Population Aged 5 Years and Above Who Own/Control a Mobile Phone |
Percent |
60740 |
4,443 |
-0.179 |
0.717 |
-1,053 |
1.4 |
0.932 |
0.502 |
53660 |
66250 |
|
11 |
Total GHG Emission Reduction in Land and Peat Sector |
Tonnes of CO₂e/year |
4,349×106 |
16708.176 |
-0.375 |
0.794 |
-2,103 |
1,587 |
0.874 |
0.203 |
4,326×106 |
4,368×106 |
|
12 |
Air Quality Index |
Index |
96,515 |
1,341 |
0.5 |
0.752 |
-0.798 |
1,481 |
0.9 |
0.288 |
94.96 |
98.56 |
|
13 |
Percentage of the population living below the national poverty line, by sex and age group |
Percent |
12,812 |
0.206 |
0.042 |
0.845 |
-1,037 |
1,741 |
0.947 |
0.713 |
12.56 |
13.1 |
|
14 |
Percentage of People Who Have Health Insurance by Type of BPJS Insurance Recipients of Contribution Assistance |
Percent |
23,796 |
6,663 |
0.204 |
0.913 |
-1,701 |
2 |
0.965 |
0.845 |
15.9 |
32.26 |
|
15 |
Percentage of Young People 15-24 Years of Age, Not in School, Working, or Training |
Percent |
24,242 |
1,399 |
-0.178 |
0.752 |
-2,216 |
1,481 |
0.85 |
0.096 |
22.35 |
25.78 |
|
16 |
Travel and Tourism Sector GRDP Percentage |
Percent |
1.36 |
0.115 |
-0.049 |
0.752 |
-0.997 |
1,481 |
0.96 |
0.808 |
1.19 |
1.52 |
|
17 |
Number of national tourists to natural attractions |
Visitor |
4068×106 |
1110×106 |
1,045 |
0.717 |
0.494 |
1.4 |
0.91 |
0.316 |
2867×106 |
6244×106 |
|
18 |
Number of Indonesian Tourists to Cultural Tourism Attractions |
Visitor |
2757×106 |
1780×106 |
2,371 |
0.717 |
6,232 |
1.4 |
0.71 |
0.2 |
1353×106 |
7223×106 |
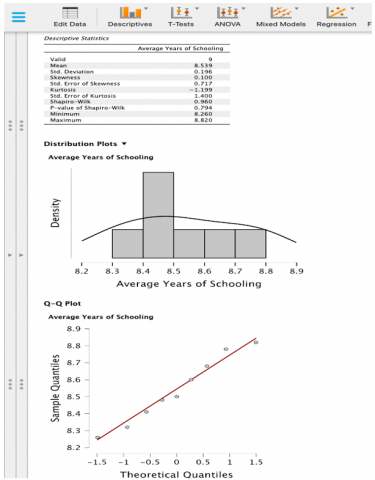
Residual normality testing is vital for valid statistical inference in linear regression. Combining both methods offered a clearer picture of residual behavior and improved model robustness. This improves the dependability of the forecasting model created by bolstering the validity of the regression's normalcy assumption. Skewness and kurtosis tests complemented the analysis. Data were considered normally distributed when Z-values for both measures ranged between –1.96 and +1.96 [26]. Figure 6 shows the output results of processing one of the indicators, "Average Years of Schooling," using the JASP application (Jeffrey's Amazing Statistical Program), one of the free (open-source) statistical analysis applications [27]. Table 4 displays the results of data normalization on 18 indicators.
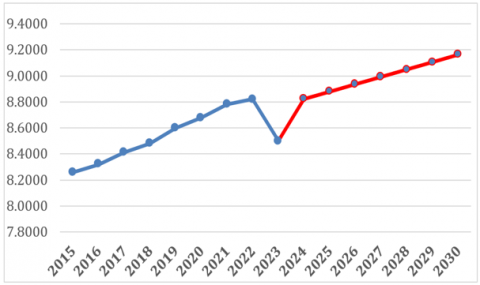
Forecasting for 2024-2030 was conducted using the Excel LINEST function. Unrealistic projections, such as values exceeding 100%, were flagged through visual review. Data forecasts for 2024-2030 are derived from the forecasting findings using linear regression and are presented graphically as supporting data. The average year of schooling indication, for instance, is shown in eighth figure, where the red line represents the projected outcome for 2024-2030 and the blue line represents the data that was available from 2015-2023.
As a visual aid for the data, the linear regression forecasting graph in Figure 7 is an extra choice in Table 3 with the column name "Achievement and Target Graph" to give policymakers alternatives and forecasts on the outcomes attained and goals to be attained for each indicator. For projecting the attainment of development indicators, basic linear regression techniques offer a helpful first overview [28]. Advanced techniques like multivariate regression, ARIMA models, or machine learning are advised for long-term planning. To generate more precise and real-time data, integration with the SPBE system must also be improved.
While the study employed simple linear regression for forecasting, the relatively short time series (2015-2023) limited the feasibility of conducting unit-root or autocorrelation diagnostics. Instead, residual normality was assessed using the Shapiro-Wilk and Kolmogorov–Smirnov tests, which supported the assumption of normal distribution. We acknowledge that the absence of formal unit-root and autocorrelation tests constrains the robustness of the forecasts, and this is addressed as a limitation in the discussion.
Through the RAD and DAD models, 67 tourism-related indicators were identified, 27 of which were directly aligned with SDG targets. They encompass education, internet connectivity, access to clean water and sanitation, and visitor numbers to natural and cultural destinations. Integration through the SPBE framework improved data harmonization and forecasting accuracy, yielding consistent and replicable indicators. The forecasts indicated upward trends in education, service accessibility, and tourism performance. The results highlight the practical value of SPBE as a tool for regional performance monitoring and policy development.
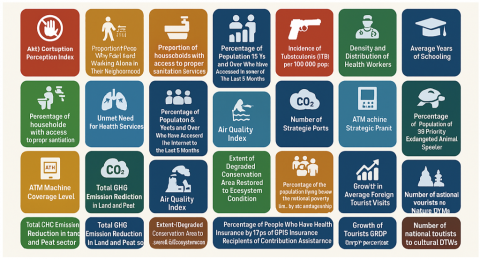
Figure 8. 27 Tourism indicators that support the achievement of SDGs
The IPKN framework incorporates indicators produced by multiple sectors tourism, infrastructure, security, health, and education reflecting the cross-sectoral nature of tourism development. These indicators are used to describe the growth of the tourism sector in the context of regional tourism development. SPBE regulations under the One Data Indonesia framework require each sector to align its data architecture and information systems with national standards. This will make the data easily accessible and establish a new standard.
The tourism profile developed here serves as a reference for national and provincial tourism offices, offering data structures that support SDG-oriented development, particularly in South Sumatra. This study compiled and organized 27 tourism indicators contributing to SDG achievement. The 27 SDG-linked indicators are summarized below in a concise, structured list for clarity and readability. Figure 8 presents the 27 tourism indicators supporting SDG achievement, visualized through the methodological framework developed in this study.
The SPBE-based RAD/DAD framework offers a replicable model for SDG-oriented governance in resource-constrained regions. Comparisons with Vietnam’s National E-Gov Portal and India’s Digital India indicate that the model could be scaled across ASEAN contexts. Despite its strengths, dependence on simple regression techniques limits analytical depth. Integration with real-time big data and advanced analytical methods is recommended. The resulting dataset serves as a strategic tool for decision-making. Agencies such as Bappeda can use this information to plan across sectors, enhance resource allocation, and prioritize SDG-relevant programs. Standardized indicators can also support Kemenparekraf in evaluating regional tourism potential, tracking project feasibility, and developing incentive mechanisms that promote sustainable social and environmental outcomes.
Adoption of RAD/DAD standards by Kemendagri would further institutionalize One Data Indonesia by unifying provincial data governance practices. Integrating SPBE-based data management into local government operations would institutionalize evidence-based policymaking and enable real-time monitoring of tourism’s developmental impact. Forecast projections to 2030 offer a policy planning horizon that allows national and local governments to identify performance gaps, revise targets, and establish collaborative partnerships. The model can be embedded within digital dashboards and national reporting systems to enhance inter-agency coordination and SDG monitoring. Although the findings are informative for evidence-based planning, their generalization should be approached with caution. Nine of the 27 SDG-aligned indicators were excluded due to inconsistent data availability, which may have introduced bias, particularly in areas such as corruption perception, connectivity, and biodiversity. Consequently, the policy implications should be interpreted as indicative rather than exhaustive. Local governments may apply the results for preliminary planning; however, comprehensive policy formulation should await the inclusion of missing indicators when data consistency is ensured. The harmonized tourism–SDG indicators can be formalized in RPJMD and Renstra through Perda or Peraturan Gubernur to secure long-term integration.
Given the limited time series, the absence of unit-root and autocorrelation tests constrains robustness. Thus, the linear regression forecasts should be viewed as indicative rather than conclusive. Future studies should employ more sophisticated forecasting methods ARIMA, VAR, or machine learning—when extended datasets are accessible. In summary, this framework aligns tourism data with SDG monitoring and offers policymakers a practical model for interoperable, data-driven planning and evaluation.
This study did not involve human participants or animal experimentation.
The authors gratefully acknowledge the Government of South Sumatra for data access and institutional collaboration.
All datasets generated or analyzed during this study are available in the Mendeley Data repository (https://doi.org/10.17632/ypn6yrzg2f.2).
[1] Gössling, S., Hall, C.M. (2019). Sharing versus collaborative economy: How to align ICT developments and the SDGs in tourism? Journal of Sustainable Tourism, 27(1): 74-96. https://doi.org/10.1080/09669582.2018.1560455
[2] United Nations World Tourism Organization (UNWTO). (2020). Tourism and the Sustainable Development Goals – Journey to 2030. https://www.untourism.int/global/publication/tourism-and-sustainable-development-goals-journey-2030.
[3] Hall, C.M. (2011). Policy learning and policy failure in sustainable tourism governance: From first-and second-order to third-order change? Journal of Sustainable Tourism, 19(4-5): 649-671. https://doi.org/10.1080/09669582.2011.555555
[4] Dredge, D., Jamal, T. (2015). Progress in tourism planning and policy: A post-structural perspective on knowledge production. Tourism Management, 51: 285-297. https://doi.org/10.1016/j.tourman.2015.06.002
[5] Janssen, M., Charalabidis, Y., Zuiderwijk, A. (2012). Benefits, adoption barriers and myths of open data and open government. Information Systems Management, 29(4): 258-268. https://doi.org/10.1080/10580530.2012.716740
[6] Gil-Garcia, J.R., Dawes, S.S., Pardo, T.A. (2018). Digital government and public management research: Finding the crossroads. Public Management Review, 20(5): 633-646. https://doi.org/10.1080/14719037.2017.1327181
[7] Dawes, S.S. (2009). Governance in the digital age: A research and action framework for an uncertain future. Government Information Quarterly, 26(2): 257-264. https://doi.org/10.1016/j.giq.2008.12.003
[8] Zuiderwijk, A., Janssen, M., Choenni, S., Meijer, R., Sheikh Alibaks, R. (2014). Socio-technical implications of open data. Electronic Journal of e-Government, 10(2): 156-172. https://pure.tudelft.nl/ws/portalfiles/portal/32002646/ejeg_volume10_issue2_article255.pdf.
[9] Lubis, S., Purnomo, E.P., Lado, J.A., Hung, C.F. (2024). Electronic governance in advancing sustainable development goals: A systematic literature review. Discover Global Society, 2: 77. https://doi.org/10.1007/s44282-024-00102-3
[10] Government of Indonesia. (2022). Presidential decree 132/2022: Architecture of the national electronic-based government system. https://jdih.maritim.go.id/en/perpres-1322022-arsitektur-sistem-pemerintahan-berbasis-elektronik-nasional.
[11] Supriadi, E., Zulkarnaen, A.H., Paminto, S.R., Mulyadi, D. (2024). Digital transformation of electronic-based government system (EBS) in Sukabumi District: Implementation of central government policy to realise good governance. Intellectual Law Review (ILRE), 2(2): 85-94. https://doi.org/10.59108/ilre.v2i2.70
[12] Haerofiatna, H., Chaidir, J. (2023). Regional regulations: Implementation of electronic-based government systems. European Journal of Business and Innovation Research, 11(3): 61-69. https://doi.org/10.37745/ejbir.2013/vol11n36169
[13] Suhendra, A., Santiko, A. (2022). Governance through electronic-based information system by Papua provincial government. International Journal of Regional Innovation, 2(4): 43-50. https://doi.org/10.52000/ijori.v2i3.65
[14] Nursafitri, S., Jayadi, R. (2023). Evaluation of electronic-based government system using the e-government maturity model: Case study of Bekasi city. Jurnal Minfo Polgan, 12(1): 549-561. https://doi.org/10.33395/jmp.v12i1.12455
[15] Saputra, K.E., Pratama, G.D., Chowanda, A. (2022). Emotion dataset from Indonesian public opinion. Data in Brief, 43: 108465. https://doi.org/10.1016/j.dib.2022.108465
[16] Ministry of Tourism and Creative Economy (Kemenparekraf). (2023). National tourism development index 2022. https://tasransel.kemenparekraf.go.id/indeks-pembangunan-kepariwisataan-nasional-2022/show.
[17] Guo, H., Liang, D., Sun, Z., Chen, F., Wang, X., Li, J., Zhu, L., Bian, J., Wei, Y., Huang, L., Chen, Y., Peng, D., Li, X., Lu, S., Liu, J., Shirazi, Z. (2022). Measuring and evaluating SDG indicators with big earth data. Science Bulletin, 67(17): 1792-1801. https://doi.org/10.1016/j.scib.2022.07.015
[18] Gubernur Sumatera Selatan. (2024). Architectural design of electronic-based government system 2024-2029. https://jdih.sumselprov.go.id/storage/userfiles/e26108b9f613224ba0173c36e5e88d76.pdf.
[19] Indonesia, R. (2009). Undang-undang nomor 10 tahun 2009 tentang Kepariwisataan. https://peraturan.bpk.go.id/Home/Download/27864/UU%20Nomor%2010%20Tahun%202009.pdf.
[20] Government of Indonesia. (2011). National Tourism Development Master Plan 2010 - 2025. https://peraturan.info/pp/2011/50/isi.
[21] Kelly, M.M., Martin-Peters, T., Strohm-Farber, J. (2024). Secondary data analysis: Using existing data to answer new questions. Journal of Pediatric Health Care, 38(4): 615-618. https://doi.org/10.1016/j.pedhc.2024.03.005
[22] Carter, N., Bryant-Lukosius, D., DiCenso, A., Blythe, J., Neville, A.J. (2014). The use of triangulation in qualitative research. Oncology Nursing Forum, 41(5): 545-547. https://doi.org/10.1188/14.ONF.545-547
[23] Brockwell, P.J., Davis, R.A. (2016). Introduction to Time Series and Forecasting. New York: Springer. https://link.springer.com/book/10.1007/978-3-319-29854-2.
[24] Ghozali, I. (2012). Multivariate Analysis Application with IBM SPSS 19 Program. https://www.semanticscholar.org/paper/Aplikasi-Analisis-Multivariate-dengan-Program-IBM-5-Ghozali/c4cf332ef7d77715b058476b41ba71e3ff050e92.
[25] Quraisy, A. (2020). Data normality using the Kolmogorov-smirnov and saphiro-wilk Tests. J-HEST: Journal of Health. Education, Economics, Science, and Technology. https://doi.org/10.36339/jhest.v3i1.42
[26] Blanca, M.J., Alarcón, R., Arnau, J., Bono, R., Bendayan, R. (2013). Skewness and kurtosis in real data samples. Methodology: European Journal of Research Methods for The Behavioral and Social Sciences, 9(2): 78-84. https://doi.org/10.1027/1614-2241/a000057
[27] JASP Team. (2024). JASP (Version 0.19.3). https://jasp-stats.org/previous-versions/.
[28] Chenary, K., Pirian Kalat, O., Sharifi, A. (2024). Forecasting sustainable development goals scores by 2030 using machine learning models. Sustainable Development, 32(6): 6520-6538. https://doi.org/10.1002/sd.3037