Yenni Carolina*![]() | Melania Lintang Kenisah
| Melania Lintang Kenisah![]() | Anthonius
| Anthonius![]() | Jerry
| Jerry![]()
© 2025 The authors. This article is published by IIETA and is licensed under the CC BY 4.0 license (http://creativecommons.org/licenses/by/4.0/).
OPEN ACCESS
This study examines the internal composition and sectoral patterns of Environmental, Social, and Governance (ESG) performance across emerging-market firms using Refinitiv (LSEG) ESG data for 2020–2024 organized under the Thomson Reuters Business Classification. The analysis proceeds in four stages—descriptive statistics, proportional subcategory mapping, correlation analysis, and sectoral profiling—covering overall ESG, the three pillars, and ten subcategories. A central methodological contribution is the application of distance correlation (dCor) alongside Spearman rank correlation. Because dCor captures general (including non-linear) dependence structures, it reveals relationships that linear and monotonic measures may understate, thereby providing a more comprehensive view of how pillar and subcategory scores relate to ESG Total. The results indicate that the social pillar exhibits the strongest association with ESG Total, followed by Governance and Environmental. At the subcategory level, Workforce, Emissions, and Management show the most consistent links to overall performance, whereas Innovation and Shareholders display weaker associations. Sectoral profiles highlight substantial heterogeneity: extractive industries are primarily shaped by Emissions and Resource Use, while in Retailers, Community is closely tied to ESG Total and Emissions shows a negative association—an observation that challenges materiality expectations and warrants further scrutiny. By integrating dCor, the study uncovers non-linear, sector-specific dependencies that are obscured by aggregate metrics or single-method correlations. The findings offer a diagnostic framework for more targeted corporate ESG strategies, sharper sectoral benchmarking, and evidence-informed policy design in emerging markets, while underscoring the interpretive limits of correlational analysis.
ESG performance, ESG pillars, ESG subcategories, sectoral ESG mapping, exploratory data analysis, emerging markets, sustainability reporting
The issue of sustainability has increasingly become a central pillar in corporate strategy, with the integration of Environmental, Social, and Governance (ESG) principles gaining momentum globally. ESG is now widely viewed not only as a corporate responsibility but also as a strategic response to market complexity, stakeholder expectations, and regulatory demands [1]. The framework itself consists of three core pillars: environmental (e.g., resource efficiency, emissions management), social (e.g., employee welfare, human rights), and governance (e.g., board independence, transparency) [2-4].
In emerging markets, the adoption of ESG principles is driven by a mix of regulatory mandates, capital market reforms, and investor pressure. Indonesia, for instance, has implemented Presidential Regulation No. 59/2017 to align national development goals with the UN Sustainable Development Goals (SDGs) [5], alongside Financial Services Authority Regulation (POJK) No. 51/2017 [6], which mandates sustainability reporting for listed entities. Complementary guidelines such as OJK Circular Letter No. 16/2021 and the Sustainable Finance Roadmap Phase II (2021–2025) further signal the government’s strong institutional support [7].
Similar developments are observed in other emerging economies. Malaysia enforces a sustainability statement requirement in corporate annual reports through its 2015 listing regulations, supported by the Malaysian Code for Institutional Investors [8]. India mandates the SEBI Business Responsibility Reports [9] and promotes non-financial disclosure through the National Voluntary Guidelines. Thailand, Vietnam, and the Philippines have also adopted ESG disclosure frameworks—such as the Principles of Corporate Governance for Listed Companies in Thailand [10], Circular No. 155/2015 in Vietnam [11], and the Philippine Sustainability Reporting Guidelines (2019)—which aim to improve corporate transparency [12]. In Brazil, regulations such as Policy No. 4.327/2014 require social responsibility disclosures from financial institutions [13], while initiatives like “Report or Explain for the SDGs” (2017) encourage alignment with sustainable development targets [14]. These regulatory efforts illustrate the growing recognition of ESG across emerging markets, though they also reveal substantial variation in institutional capacity, legal mandates, and enforcement levels [15].
Amid these efforts, capital markets have played a catalytic role in ESG diffusion [16, 17]. In Indonesia, the Indonesia Stock Exchange (IDX) has adopted the ASEAN Exchanges Common ESG Metrics and established collaborations with independent ESG rating agencies to assess issuers’ sustainability performance [18]. Bursa Malaysia and the Stock Exchange of Thailand have implemented similar measures [19]. Nevertheless, multiple challenges persist: limited managerial awareness, poor data quality, and the instrumental use of ESG as a reputational label rather than as a robust risk management and strategic performance tool [20, 21].
According to the Indonesia Business Council for Sustainable Development (IBCSD), about 40% of companies in the country lack a full understanding of ESG's strategic relevance. Indonesia's ESG Index ranking—36th out of 47 countries—underscores the implementation gap between policy formulation and corporate practice [22]. These challenges are echoed in other emerging economies where ESG maturity remains fragmented due to regulatory ambiguity, insufficient enforcement, and low private sector participation [15, 23].
While the growing ESG literature has examined various aspects of sustainability performance, research in emerging markets often relies on aggregate ESG scores [21], overlooking the internal structure and differentiated roles of each pillar and subcategory. For instance, studies in Indonesia by Lubis and Rokhim [24], Nareswari et al. [25], and Putri and Puspawati [26] focus on total ESG scores without exploring the contribution or weighting of specific elements. In reality, ESG ratings—such as those produced by LSEG Data & Analytics—are built upon a hierarchical structure, with each pillar composed of weighted subcategories that collectively shape the final ESG performance score [27].
Ignoring this granularity can obscure critical insights about how sustainability performance varies across business sectors [28]. For instance, two firms with identical ESG scores may differ significantly in their subcategory profiles—one excelling in emissions reduction and another in community engagement. Moreover, some subcategories may show higher relevance for sectoral risk exposure, particularly in industries like energy, manufacturing, or finance.
Accordingly, recent calls in the literature advocate for a shift toward micro-level ESG analysis that includes subcategory contributions and inter-pillar correlations [29, 30]. Such analysis can inform more precise policy interventions, enhance sector-level benchmarking, and guide investor decisions based on material ESG factors rather than generalized scores. This study responds to these gaps by mapping the structure, distribution, and correlation of ESG scores across business sectors in emerging markets, with a particular focus on the subcategory level. Using a quantitative, data-driven approach that integrates descriptive statistics, correlation analysis, and visualization techniques, the research aims to reveal patterns and sectoral differences often hidden in aggregate ESG data. The analytical framework is based on LSEG ESG metrics [31], which offer detailed subcategory-level indicators for Environmental, Social, and Governance dimensions.
The study contributes theoretically by advancing ESG scholarship in emerging market contexts through a multidimensional mapping of ESG components. This addresses a critical gap in the literature, which tends to concentrate on holistic ESG ratings while underexploring business structural nuances. Practically, the findings may support regulators and capital market authorities in designing sector-specific ESG guidelines, help companies benchmark their performance, and assist investors in identifying areas of potential ESG misalignment or greenwashing.
In summary, although ESG frameworks are expanding across emerging markets, challenges persist in bridging regulatory intent and corporate implementation [23]. This study argues that ESG assessment must move beyond aggregate scores toward a deeper analysis of subcategory structures and sectoral patterns, offering a data-driven basis for more targeted and effective sustainability strategies.
Table 1. Research gap, questions, objectives, and methodology
|
No. |
Research Gap |
Research Questions |
Research Objectives |
Research Methodology |
|
1 |
ESG research in emerging markets is mostly aggregate, lacking sector-specific ESG trend analysis. |
RQ1: What are the trends and distributions of ESG total scores across business sectors in emerging markets? |
To describe the distribution and trends of ESG total scores across sectors in emerging markets. |
-Descriptive analysis of ESG trends by sector -Visualization: line charts, boxplots |
|
2 |
Limited research maps ESG at pillar and subcategory levels for sector-specific performance insights. |
RQ2: What are the patterns of ESG pillar and subcategory scores across sectors in emerging markets? |
To analyze ESG performance at pillar and subcategory levels across sectors. |
-Descriptive analysis of ESG pillars and subcategories -Sectoral comparison -Visualization: stacked bar charts |
|
3 |
ESG dimensional relationships are underexplored in emerging market contexts. |
RQ3: How are ESG pillars and subcategories correlated within their respective dimensions? |
To assess the strength and nature of ESG pillar and subcategory dependencies. |
-Correlation analysis using: Spearman’s rank correlation (monotonic relationships) -Distance correlation (dCor) for non-linear dependencies -Visualization: correlation matrix, heatmap |
|
4 |
Sector-specific ESG excellence remains unclear in emerging markets. |
RQ4: Do specific sectors in emerging markets show strengths in particular ESG dimensions or subcategories? |
To identify leading and lagging sectors based on ESG dimension and subcategory contributions. |
-Comparative analysis of subcategory contributions and correlations Visualization: stacked bar -charts, sectoral heatmaps, bubble charts |
To provide a structured foundation for the study, this section outlines the theoretical and empirical gaps identified in the current ESG literature, particularly in the context of emerging markets. Despite increasing attention to ESG practices, many studies remain limited to aggregate-level analysis, overlooking sectoral nuances and internal ESG structures [21, 32-35]. To address these limitations, the study formulates specific research questions aligned with clear objectives and appropriate methodologies. The research framework is summarized in Table 1.
This study employs a quantitative research approach using exploratory statistical analysis and visualization techniques to investigate the structure and patterns of ESG scores across business sectors in emerging markets. The data are sourced from the Refinitiv database provided by LSEG Data & Analytics, covering the period from 2020 to 2024 from 46 companies in Indonesia. Total data analysed 230 datasets. The dataset includes total ESG scores, scores for each pillar—Environmental, Social, and Governance—as well as ten subcategory scores: resource use, emissions, innovation (Environmental); workforce, human rights, community, and product responsibility (Social); and management, shareholders, CSR strategy (Governance).
To ensure consistency and comparability, only firms with complete ESG scores for all pillars and subcategories over the five-year period were included. Each firm is classified by business based on the Thomson Reuters Business Classification (TRBC) [36] to allow for sectoral aggregation and inter-sector comparisons.
The sectors of the firms comprising the study sample are presented in Table 2.
Table 2. Descriptive statistics and correlation analysis
|
TRBC |
Company |
Count of TRBC |
|
Applied Resources |
Pabrik Kertas Tjiwi Kimia Tbk PT |
1 |
|
Indah Kiat Pulp & Paper Tbk PT |
1 |
|
|
Applied Resources Total |
2 |
|
|
Banking & Investment Services |
Bank Negara Indonesia (Persero) Tbk PT |
1 |
|
Bank Tabungan Negara (Persero) Tbk PT |
1 |
|
|
Bank Rakyat Indonesia (Persero) Tbk PT |
1 |
|
|
Bank Danamon Indonesia Tbk PT |
1 |
|
|
Bank Central Asia Tbk PT |
1 |
|
|
Bank Mandiri (Persero) Tbk PT |
1 |
|
|
Banking & Investment Services Total |
6 |
|
|
Chemicals |
Barito Pacific Tbk PT |
1 |
|
Chemicals Total |
1 |
|
|
Cyclical Consumer Services |
Global Mediacom Tbk PT |
1 |
|
Surya Citra Media Tbk PT |
1 |
|
|
Media Nusantara Citra Tbk PT |
1 |
|
|
Cyclical Consumer Services Total |
3 |
|
|
Energy - Fossil Fuels |
Bumi Resources Tbk PT |
1 |
|
United Tractors Tbk PT |
1 |
|
|
Indo Tambangraya Megah Tbk PT |
1 |
|
|
Alamtri Resources Indonesia Tbk PT |
1 |
|
|
AKR Corporindo Tbk PT |
1 |
|
|
Bukit Asam Tbk PT |
1 |
|
|
Energy - Fossil Fuels Total |
6 |
|
|
Food & Beverages |
Astra Agro Lestari Tbk PT |
1 |
|
Indofood CBP Sukses Makmur Tbk PT |
1 |
|
|
Hanjaya Mandala Sampoerna Tbk PT |
1 |
|
|
Astra International Tbk PT |
1 |
|
|
Indofood Sukses Makmur Tbk PT |
1 |
|
|
Charoen Pokphand Indonesia Tbk PT |
1 |
|
|
Gudang Garam Tbk PT |
1 |
|
|
Food & Beverages Total |
7 |
|
|
Industrial & Commercial Services |
Waskita Karya (Persero) Tbk PT |
1 |
|
Industrial & Commercial Services Total |
1 |
|
|
Mineral Resources |
Semen Indonesia (Persero) Tbk PT |
1 |
|
Aneka Tambang Tbk PT |
1 |
|
|
Vale Indonesia Tbk PT |
1 |
|
|
Indocement Tunggal Prakarsa Tbk PT |
1 |
|
|
Merdeka Copper Gold Tbk PT |
1 |
|
|
Mineral Resources Total |
5 |
|
|
Personal & Household Products & Services |
Unilever Indonesia Tbk PT |
1 |
|
Personal & Household Products & Services Total |
1 |
|
|
Pharmaceuticals & Medical Research |
Kalbe Farma Tbk PT |
1 |
|
Pharmaceuticals & Medical Research Total |
1 |
|
|
Real Estate |
Summarecon Agung Tbk PT |
1 |
|
Pakuwon Jati Tbk PT |
1 |
|
|
Bumi Serpong Damai Tbk PT |
1 |
|
|
Lippo Karawaci Tbk PT |
1 |
|
|
Real Estate Total |
4 |
|
|
Retailers |
Matahari Department Store Tbk PT |
1 |
|
Aspirasi Hidup Indonesia Tbk PT |
1 |
|
|
Retailers Total |
2 |
|
|
Telecommunications Services |
Tower Bersama Infrastructure Tbk PT |
1 |
|
Indosat Tbk PT |
1 |
|
|
XLSMART Telecom Sejahtera Tbk PT |
1 |
|
|
Sarana Menara Nusantara Tbk PT |
1 |
|
|
Telkom Indonesia (Persero) Tbk PT |
1 |
|
|
Telecommunications Services Total |
5 |
|
|
Transportation |
Jasa Marga (Persero) Tbk PT |
1 |
|
Transportation Total |
1 |
|
|
Utilities |
Perusahaan Gas Negara Tbk PT |
1 |
|
Utilities Total |
1 |
|
|
Grand Total |
46 |
|
Data processing was performed in Python 3.13. The pandas library was used for data cleaning, filtering, and reshaping, while numpy supported numerical computations. Visualizations were generated using matplotlib and seaborn. Correlation analysis employed Spearman’s rank correlation to detect monotonic relationships and distance correlation (dCor) to capture potential non-linear dependencies. This dual approach was chosen to avoid assumptions of normality and to provide a more comprehensive assessment of interdependencies among ESG dimensions. To address potential multiple-testing bias due to numerous pairwise correlations, the Benjamini–Hochberg correction was applied to control the False Discovery Rate (FDR) at the 5% significance level, ensuring robustness and reliability of the reported associations
The analysis proceeded through four stages: (1) descriptive statistics of ESG total and pillar scores across sectors and years using line plots and boxplots; (2) subcategory-level aggregation by sector and visualization via proportional stacked bar charts; (3) correlation assessment among pillars and subcategories using Spearman and dCor, with results visualized via heatmaps.; and (4) comparative sectoral profiling using subcategory dominance and correlation strength, illustrated through multi-dimensional bubble charts.
The contribution data used in this study is available upon request and can be obtained by contacting the corresponding author directly. The dataset is not openly published to ensure appropriate use within the proper research context and to verify that access is granted to individuals with relevant academic or analytical purposes, all of whom contributed to the research.
4.1 Overview of ESG scores across emerging markets
Over the past five years, the average total ESG score of companies in emerging markets reached 55.35, indicating that, in general, corporate sustainability performance is above average and relatively sound (Table 3). However, the relatively high standard deviation of 18.77 reflects substantial variation among companies, both in terms of ESG disclosure and implementation.
When examined by pillar, the Social pillar recorded the highest average score compared to the Environmental and Governance pillars. This is further supported by two key subcategories within the Social pillar—Community and Workforce—which both showed high average values and relatively stable data distributions. These findings suggest that companies in emerging markets demonstrate greater commitment to social issues, such as community engagement and workforce management.
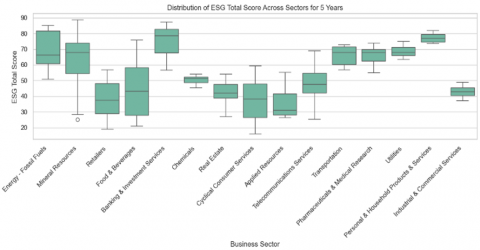
Figure 1. Distribution of EGS total score across sector for 5 years
Table 3. Descriptive statistics and correlation analysis
|
Pillar / Subcategory |
Mean |
Median |
Std. Dev |
Spearman Rho. |
p-value (Spearman) |
dCor Value |
p-value (dCor) |
|
ESG Total |
55.35 |
54.99 |
18.77 |
– |
– |
– |
– |
|
Environmental |
46.92 |
46.99 |
23.09 |
0.7739 |
0.0000 |
0.7585 |
0.002 |
|
Resource Use |
50.33 |
50.39 |
24.58 |
0.7597 |
0.0000 |
0.7327 |
0.002 |
|
Emissions |
53.93 |
54.39 |
25.13 |
0.7976 |
0.0000 |
0.7792 |
0.002 |
|
Innovation |
27.05 |
11.97 |
30.73 |
0.2725 |
0.0000 |
0.2912 |
0.002 |
|
Social |
59.99 |
59.92 |
20.51 |
0.8930 |
0.0000 |
0.8875 |
0.002 |
|
Workforce |
64.60 |
66.73 |
23.30 |
0.7740 |
0.0000 |
0.7495 |
0.002 |
|
Human Rights |
43.44 |
44.50 |
26.43 |
0.6495 |
0.0000 |
0.6357 |
0.002 |
|
Community |
67.39 |
69.97 |
24.72 |
0.6934 |
0.0000 |
0.6683 |
0.002 |
|
Product Responsibility |
63.22 |
69.93 |
31.25 |
0.7450 |
0.0000 |
0.7362 |
0.002 |
|
Governance |
53.99 |
54.65 |
23.04 |
0.8237 |
0.0000 |
0.7888 |
0.002 |
|
CSR Strategy |
55.38 |
61.29 |
29.56 |
0.6041 |
0.0000 |
0.6131 |
0.002 |
|
Management |
54.29 |
56.33 |
28.54 |
0.7526 |
0.0000 |
0.7194 |
0.002 |
|
Shareholders |
52.09 |
53.77 |
28.04 |
0.3791 |
0.0000 |
0.3562 |
0.002 |
Table 3(a). Partial spearman and distance correlation (dCor) controlling for sector fixed effects
|
Variable / Subcategory |
Partial Spearman (ρ) |
p-value |
Partial dCor |
Permutation p-value |
FDR (5%) |
|
Social |
0.831 |
< 0.001 |
0.827 |
0.0005 |
√ |
|
Environmental |
0.778 |
< 0.001 |
0.752 |
0.0005 |
√ |
|
Resource |
0.721 |
< 0.001 |
0.682 |
0.0005 |
√ |
|
Human Rights |
0.702 |
< 0.001 |
0.688 |
0.0005 |
√ |
|
Governance |
0.702 |
< 0.001 |
0.676 |
0.0005 |
√ |
|
Workforce |
0.650 |
< 0.001 |
0.636 |
0.0005 |
√ |
|
Management |
0.628 |
< 0.001 |
0.614 |
0.0005 |
√ |
|
Emissions |
0.601 |
< 0.001 |
0.584 |
0.0005 |
√ |
|
Community |
0.558 |
< 0.001 |
0.554 |
0.0005 |
√ |
|
Product Responsibility |
0.486 |
< 0.001 |
0.512 |
0.0005 |
√ |
|
CSR Strategy |
0.432 |
< 0.001 |
0.421 |
0.0005 |
√ |
|
Shareholders |
0.259 |
< 0.001 |
0.265 |
0.0005 |
√ |
|
Innovation |
0.154 |
< 0.001 |
0.276 |
0.0005 |
√ |
Note: Partial correlations control for sector-specific effects to remove inter-industry bias. √ denotes significance after Benjamini–Hochberg FDR correction (α = 0.05).
The distribution of total ESG scores across business sectors also reveals significant performance disparities (Figure 1). The Banking & Investment Services sector ranks highest, with a median ESG score exceeding 75, indicating high consistency and quality in reporting. In contrast, sectors such as Food & Beverages, Retailers, and Cyclical Consumer Services exhibit wide score distributions with low medians, potentially indicating inconsistent ESG practices and risks of greenwashing. Although the Mineral Resources and Energy – Fossil Fuels sectors display relatively good ESG performance, their broad score ranges indicate internal disparities in ESG implementation within the same sector.
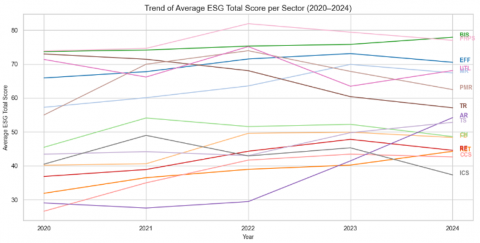
Furthermore, the average ESG score trends from 2020 to 2024 (Figure 2) show that most sectors experienced gradual improvement over time, reflecting progressive integration of ESG into corporate strategies. The Real Estate (RE) and Telecommunications Services (TS) sectors recorded consistently increasing trends, suggesting enhanced awareness and more substantive ESG adoption. On the other hand, sectors such as Food & Beverages, Cyclical Consumer Services, and Retailers show stagnant or declining trends, possibly indicating symbolic ESG adoption or structural challenges. Meanwhile, Banking & Investment Services (BIS) and Personal & Household Products & Services (PHPS) consistently demonstrate strong and stable ESG performance, indicating sectoral advantages in governance and sustainability compliance.
Table 3(a) reports the results of the robustness test using partial correlations controlling for sector fixed effects. The findings confirm that the relationships between the ESG pillars and the overall ESG score remain highly consistent after accounting for sectoral composition. The Social pillar continues to exhibit the strongest association with ESG Total (ρ = 0.83; dCor = 0.83; p < 0.001), followed by Environmental (ρ = 0.78; dCor = 0.75) and Governance (ρ = 0.70; dCor = 0.68). All subcategories remain statistically significant under the Benjamini–Hochberg correction, suggesting that ESG linkages are robust and firm-intrinsic rather than driven by sectoral bias. Particularly, the strong within-sector contributions of Resource Use and Human Rights underscore the salience of social and environmental efficiency as universal determinants of ESG performance across firms.
4.2 Pillar-level and subcategory analysis
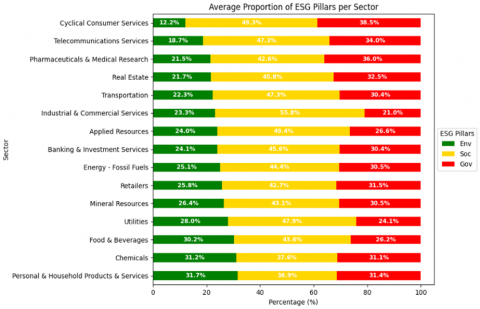
Most business sectors in emerging markets still position the Social (S) pillar as the dominant dimension within their ESG structure. As shown in Figure 3, the contribution of the social pillar across various sectors exceeds 30%, and in some cases even approaches or surpasses 40%–50%. Sectors such as Cyclical Consumer Services (49.3%), Applied Resources (49.4%), and Telecommunications Services (47.3%) exhibit particularly high proportions of the social pillar. This finding is consistent with the earlier descriptive results indicating that the highest average ESG scores derive from the social dimension, highlighting companies’ focus on issues such as labor relations, human rights, and product responsibility.
Conversely, the Environmental (E) pillar tends to receive lower proportions in many sectors, particularly in service-based sectors such as Cyclical Consumer Services (12.2%) and Telecommunications Services (18.7%). However, several sectors demonstrate relatively stronger attention to environmental concerns, such as Personal & Household Products & Services (31.7%), Chemicals (31.2%), and Food & Beverages (30.2%). This variation likely reflects differing industry characteristics and external pressures related to environmental impact management. Overall, these findings suggest that attention to environmental aspects remains uneven across business sectors.
Meanwhile, the Governance (G) pillar displays relatively stable distributions across most sectors, with proportions ranging from 21% to 38%. This indicates that governance structures and strategic policies—such as CSR Strategy and Shareholder Rights—remain essential elements in corporate ESG management, even if they are not the primary focus in every sector.
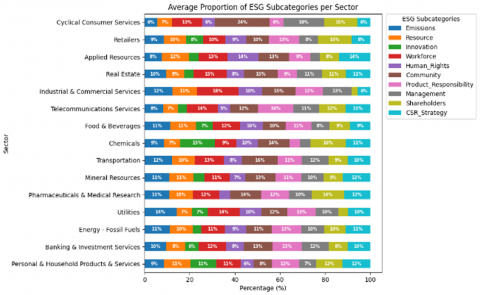
A deeper analysis at the subcategory level reveals more specific contribution patterns across sectors (Figure 4). Subcategories such as Workforce and Community emerge as dominant contributors in various sectors, reinforcing the earlier observation of the social dimension’s dominance. For instance, the Cyclical Consumer Services sector records a 24% share for the Community subcategory, while the Industrial & Commercial Services sector highlights Workforce as a key ESG component.
In contrast, environmental subcategories like Emissions and Resource Use show more varied distributions. The Utilities sector, for example, records a notable 14% proportion for Emissions, suggesting more measurable efforts in managing environmental impact in resource-intensive industries.
Figure 3. Average proportion of ESG pillars per sector
Figure 4. Average proportion of ESG subcategories per sector
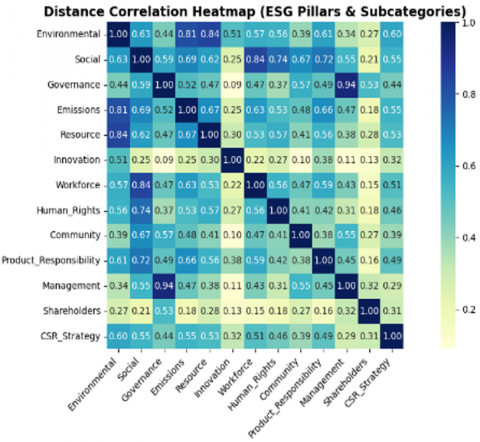
Figure 5. Distance corelation matrix (heatmap)
Other subcategories such as Innovation, Management, and CSR Strategy also show significant proportions in certain sectors. For example, the Chemicals and Personal & Household Products & Services sectors report Innovation proportions of 15% and 11%, respectively, reflecting their emphasis on developing sustainable solutions. Meanwhile, Cyclical Consumer Services stands out in the Management subcategory (18%), and Applied Resources demonstrates a high share in CSR Strategy (14%).
Taken together, these findings indicate that ESG sustainability patterns in emerging markets are sector-specific and layered. The primary ESG focus varies not only across pillars but also across subcategories. These nuanced patterns are crucial for regulators, investors, and companies to consider when designing more targeted and contextual ESG strategies aligned with the characteristics of each business sector.
4.3 Correlation patterns among ESG dimensions
Correlation analysis was conducted to understand the relationships between each ESG pillar and subcategory with the overall ESG Total score. To ensure robustness and account for potential non-linear relationships, Distance Correlation (dCor) was employed as the primary test, complemented by Spearman rank correlation to provide directionality of associations.
At the pillar level, all three ESG pillars show strong and positive associations with ESG Total (Table 3). The Social pillar demonstrates the highest distance correlation (dCor = 0.8875; ρ = 0.8930), followed by Governance (dCor = 0.7888; ρ = 0.8237) and Environmental (dCor = 0.7585; ρ = 0.7739). This ranking is consistent across both methods, confirming the social pillar’s dominant role in ESG structures for companies in emerging markets.
At the subcategory level, the variables Emissions (dCor = 0.7792; ρ = 0.7976), Workforce (dCor = 0.7495; ρ = 0.7740), and Management (dCor = 0.7194; ρ = 0.7526) show the highest correlations with ESG Total. This suggests that environmental emissions control, human capital development, and internal governance quality are critical drivers of ESG performance overall. Conversely, subcategories such as Innovation (dCor = 0.2912; ρ = 0.2725) and Shareholders (dCor = 0.3562; ρ = 0.3791) demonstrate much weaker correlations, indicating limited aggregate contribution.
The within-dimension analysis (Figure 5) reveals distinct internal correlation patterns. Within the Environmental dimension, Emissions and Resource Use exhibit a very high mutual association, reflecting their complementary contribution to environmental performance. In Governance, Management shows an exceptionally strong alignment with the overall governance construct, indicating that governance scores in the dataset are predominantly driven by management-related practices. Within the Social dimension, most subcategories demonstrate strong interconnections—particularly Workforce and Human Rights—whereas Innovation remains weakly linked to other subcategories, underscoring its marginal role and relative independence from the core social structure.
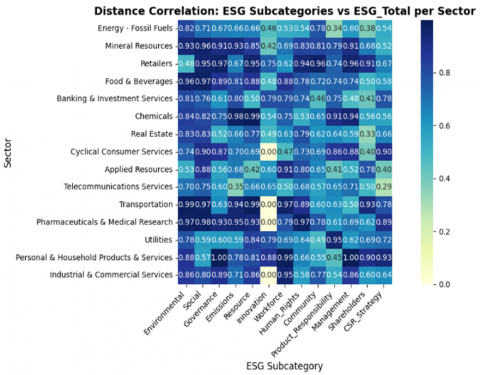
Figure 6. Heatmap correlation of ESG subcategories
The sector-level heatmap (Figure 6) reveals substantial variations across industries. In the Mineral Resources sector, Emissions (dCor = 0.93) and Resource Use (dCor = 0.85) dominate, reflecting the environmental intensity of extractive activities. A similar pattern is observed in the Pharmaceuticals & Medical Research sector. For Retailers, Community shows a very strong correlation with ESG Total (dCor = 0.96), whereas Innovation remains relatively marginal (dCor = 0.75). In the Energy – Fossil Fuels sector, Community (dCor = 0.78) stands out despite lower contributions from other social dimensions, indicating a sector-specific focus on community relations.
Overall, these findings highlight that while ESG pillars generally exhibit strong and consistent relationships with overall ESG performance, the influence of specific subcategories is highly sector dependent. The use of Distance Correlation provides additional insight by capturing both linear and non-linear associations, revealing patterns that conventional correlation tests might overlook. Consequently, ESG strategies should be tailored to industry-specific drivers, acknowledging that certain dimensions may be more influential—or even counterproductive—depending on sectoral context.
4.4 Sectoral ESG strengths and weaknesses
Following the descriptive and correlational analysis, the next step is to map the strengths and weaknesses of each sector in relation to the three ESG pillars. This identification is essential for understanding which sustainability dimensions are most and least prominent across sectors, uncovering potential greenwashing practices, and formulating more contextual and evidence-based ESG strategies.
The results indicate that ESG strength in each sector is not solely determined by average scores or structural proportions but also by the extent to which each subcategory contributes significantly to the total ESG score. Table 4 summarizes the main strengths and notable weaknesses for each sector, based on the most dominant subcategories and their correlation with the ESG Total score.
Table 4. Summary of sectoral ESG strengths and weaknesses
|
No |
Business Sector |
Main Strengths |
Notable Weaknesses |
|
1 |
Energy - Fossil Fuels |
Emissions, CSR Strategy, Community, Workforce |
Innovation and Product Responsibility contribute weakly |
|
2 |
Mineral Resources |
Emissions, Management, Product Responsibility |
Innovation shows no impact despite structural presence |
|
3 |
Retailers |
Resource, Human Rights, Community |
Emissions, Innovation, and Product Responsibility show negative correlation |
|
4 |
Food & Beverages |
Resource, Emissions, Workforce |
Innovation has low contribution |
|
5 |
Banking & Investment Services |
Nearly all subcategories are strong, especially Management & CSR |
Community is structurally high but less impactful |
|
6 |
Chemicals |
Emissions, Resource, Management, Product Responsibility |
Community and Shareholders contribute insignificantly |
|
7 |
Real Estate |
Resource, Human Rights, Product Responsibility |
Shareholders and Management are underperforming despite large proportions |
|
8 |
Cyclical Consumer Services |
Product Responsibility, Resource, Management |
Workforce and Shareholders show low correlation |
|
9 |
Telecommunications Services |
Product Responsibility, Innovation, Management |
CSR Strategy and Emissions are not significant contributors |
|
10 |
Transportation |
Workforce, Resource, Emissions |
Shareholders and CSR Strategy show no notable impact |
|
11 |
Pharmaceuticals & Medical Research |
Emissions, Resource, CSR Strategy |
Shareholders contribute weakly |
|
12 |
Utilities |
Product Responsibility, Workforce, Innovation |
Community and Shareholders are structurally high but not impactful |
|
13 |
Personal & Household Products & Services |
CSR Strategy, Innovation, Management |
Workforce and Product Responsibility have low contribution |
|
14 |
Industrial & Commercial Services |
Resource, Workforce, Management |
Product Responsibility and Shareholders show weak correlation with ESG |
|
15 |
Applied Resources |
Workforce, Human Rights, Community |
Product Responsibility, Shareholders, and CSR Strategy have no significant impact |
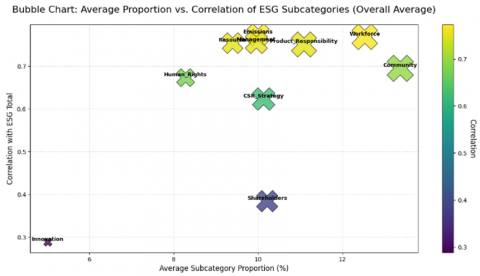
Figure 7. Bubble chart: Average proportion vs. Correlation of ESG subcategories
To gain deeper insights into sectoral ESG strengths and weaknesses, a combined analysis of the proportion and correlation of ESG subcategories across sectors was conducted. Figure 7 presents a bubble chart mapping the relationship between average subcategory proportions and their linear correlations with ESG Total. The visualization reveals an asymmetric relationship between structural dimensions (i.e., how prominently a subcategory is reported) and functional dimensions (i.e., its actual impact on sustainability performance).
Based on this analysis, ESG subcategories can be classified into four strategic groups according to their average proportion (reporting relevance) and correlation (impact relevance):
•High proportion – High impact
Subcategories that are dominant in reporting and significantly contribute to ESG performance, namely: Workforce, Emissions, Product Responsibility, Management, and Resource Use. These subcategories should be the primary focus of cross-sector ESG strategies due to their proven positive impact on ESG scores.
•High proportion – moderate impact
Subcategories frequently reported but with suboptimal contribution to ESG Total, such as: Community, CSR Strategy, and Shareholders. Notably, Community has the highest structural proportion among this group, yet only moderate correlation. This suggests that community-related disclosures are often symbolic or lack integration into core sustainability strategies. Enhancing implementation quality and impact measurement is necessary in sectors dominated by this subcategory.
•Moderate proportion – high impact
Subcategories that are less dominant in reporting but have significant influence on ESG Total, exemplified by Human Rights. This indicates a potential for quick strategic gains if strengthened, despite limited current attention.
•Low proportion – low impact
Subcategories with both low reporting prevalence and minimal impact, represented by Innovation. This finding signals a critical gap, suggesting that sustainable innovation has yet to be integrated into corporate ESG agendas in emerging markets. There is an urgent need for policy support and incentives to elevate innovation as a core pillar of sustainability.
Within the Retailers sector, the Emissions subcategory exhibits a negative association with ESG Total. This pattern contrasts with materiality expectations that emphasize emissions salience in retail supply chains. Several non-causal mechanisms can reconcile this result: (i) scope composition, whereby the subscore places greater weight on Scopes 1–2 while material exposure resides in Scope 3 upstream; (ii) a disclosure visibility effect, in which firms with broader reporting reveal higher intensity levels in the short run; (iii) business-model heterogeneity within retail (e-commerce, specialty, grocery) that can yield pooled sign reversals; and (iv) normalization effects when intensity uses volatile denominators (e.g., revenue). Consistent with our correlational design, we interpret this finding as descriptive co-variation rather than causal impact.
Innovation shows a comparatively weak association with ESG Total in 2020–2024. Across the full sample, Innovation exhibits the smallest correlations with ESG Total (rank-based and distance measures). When accounting for sectoral composition, the association remains modest. In this dataset and horizon, the Innovation indicators used by the rating provider appear less aligned with the composite ESG score than other subcategories. This finding should not be interpreted as evidence that Innovation is ineffective or unimportant for sustainability outcomes. Rather, several non-causal explanations are plausible: (i) measurement and construct alignment (Innovation is often captured as inputs, plans, or early-stage actions that may not register in composite scores); (ii) timing and lags (effects may materialize beyond the study window); (iii) sectoral heterogeneity (innovation salience and disclosure vary across industries); and (iv) weighting/variance (lower variance or weights can attenuate observable associations). Consistent with our correlational design, we refrain from prescriptive claims.
4.5 Implications for policy and practice
The sectoral mapping of ESG performance underscores that effective ESG strategies must move beyond disclosure quantity and instead emphasize the thematic relevance and impact of each subcomponent. The observed mismatch between subcategory disclosure levels and their actual correlation with ESG Total scores highlights the need to assess not only what is reported, but how much it contributes to sustainability performance.
This has several practical implications. First, both companies and regulators must adopt sector-specific ESG strategies. A uniform approach is insufficient given the diverse subcategory dominance and effectiveness across industries. By integrating the joint analysis of proportion and correlation, stakeholders can prioritize subcategories that both matter and perform—such as Workforce, Emissions, Product Responsibility, Management, and Resource Use.
Second, the findings point to the risk of greenwashing, especially in subcategories like Community or CSR Strategy, which often receive high disclosure yet have weak ties to overall ESG performance. This raises concerns about symbolic compliance. Regulators should therefore implement mechanisms to evaluate disclosure quality, not merely quantity, ensuring that reported efforts reflect real-world sustainability outcomes.
Third, the innovation subcategory remains underrepresented and low in impact across most sectors. Despite its potential to drive long-term ESG resilience, it is often overlooked. Incorporating Innovation more strategically into ESG frameworks is crucial, especially for industries facing rapid transformation or resource constraints. Ultimately, ESG in emerging markets should be grounded in impact-oriented and context-aware policies. The framework presented in this study offers practical guidance for evidence-based ESG planning, enabling tailored improvements in sustainability reporting, regulatory design, and investor decision-making.
4.6 Limitations and future work
While this study offers a comprehensive mapping of the structural composition of ESG and its sectoral dynamics, several limitations should be acknowledged. First, the research relies solely on secondary ESG score data from a single provider. Although the research methodology is sound, the use of secondary data entails potential biases in data collection, weighting schemes, and sectoral disclosure practices. This dependence also limits the exploration of qualitative ESG dimensions. Second, the study adopts a descriptive–correlational and cross-sectoral approach. While this is useful for identifying patterns, it cannot establish causal relationships between ESG subcategories and overall sustainability outcomes. Third, despite covering multiple sectors in an emerging market context, differences in regulatory maturity and institutional environments may influence ESG disclosure behavior, potentially constraining cross-sector comparability.
To address these limitations, future research could integrate primary data sources—such as stakeholder interviews, field observations, or sustainability audits—to complement quantitative findings with richer qualitative insights. Extending the temporal scope to include longer historical periods would help detect structural shifts in ESG priorities and assess sectoral resilience over time. In addition, advanced analytical techniques, including predictive modeling, network analysis, or machine learning–based ESG classification, could enhance the capacity to forecast sector-specific risks, identify early signs of greenwashing, and examine evolving interactions among ESG subcategories. Comparative studies between emerging and developed markets would further refine ESG theory and strengthen the applicability of sector-specific policy recommendations. Patterns consistent with misalignment between Innovation disclosures and composite scoring merit further investigation. Future studies should assess causal pathways and measurement design (e.g., alternative indicators, sector-specific weights, longer horizons) using identification strategies suited to causal inference (e.g., panel designs with exogenous shocks, instrumental variables, or matched natural experiments).
Building on these insights and acknowledging the limitations, this study contributes to the ESG literature in emerging market contexts by proposing a multidimensional diagnostic approach that dissects the structural makeup of ESG performance beyond aggregate ratings. By illuminating hidden patterns across Environmental, Social, and Governance subcategories, this approach enables a more theoretically robust understanding of ESG composition and its implications within sectoral boundaries.
From a practical standpoint, this framework provides the foundation for building more adaptive ESG monitoring tools. Policymakers may translate the findings into sector-adjusted disclosure metrics, companies can align internal strategies with performance-critical subcategories, and investors can use the indicators to detect potential ESG misrepresentation and enhance due diligence. Looking forward, extending this analytical approach across regions and embedding it into predictive sustainability models could strengthen the reliability of ESG component mapping as both a strategic corporate tool and a regulatory benchmark.
[1] Apergis, N., Poufinas, T., Antonopoulos, A. (2022). ESG scores and cost of debt. Energy Economics, 112: 106186. https://doi.org/10.1016/j.eneco.2022.106186
[2] Clementino, E., Perkins, R. (2021). How do companies respond to environmental, social and governance (ESG) ratings? Evidence from Italy. Journal of Business Ethics, 171(2): 379-397. https://doi.org/10.1007/s10551-020-04441-4
[3] Pambudi, J.A.A., Dayana, I., Alfirman, D.M., Susanto, D., Widianingrum, R. (2023). Accelerating Indonesia sustainable infrastructure development through ESG initiatives in PPP ecosystem. IOP Conference Series: Earth and Environmental Science, 1266(1): 012020. https://doi.org/10.1088/1755-1315/1266/1/012020
[4] Possebon, E.A.G., Cippiciani, F.A., Savoia, J.R.F., De Mariz, F. (2024). ESG scores and performance in Brazilian public companies. Sustainability, 16(13): 5650. https://doi.org/10.3390/su16135650
[5] Presiden Republik Indonesia. (2017). Presidential Regulation of the Republic of Indonesia Number 59 of 2017. https://setkab.go.id/wp-content/uploads/2017/07/Perpres-Nomor-59-Tahun-2017-.pdf.
[6] Otoritas Jasa Keuangan Republik Indonesia. (2017). Financial Services Authority Regulation Number 51/POJK.03/2017. https://www.ojk.go.id/sustainable-finance/id/peraturan/peraturan-ojk/Documents/SAL%20POJK%2051%20-%20keuangan%20berkelanjutan.pdf.
[7] Otoritas Jasa Keuangan. (2021). Circular Letter of the Financial Services Authority of the Republic of Indonesia. Number 16 /Seojk.04/2021. https://www.ojk.go.id/id/regulasi/Documents/Pages/Bentuk-dan-Isi-Laporan-Tahunan--Emiten-atau-Perusahaan-Publik/SEOJK%20-%2016%20-%202021.pdf.
[8] Malaysian Code for Intitutional Investors. Minority Shareholder Watchdog Group. https://www.sc.com.my/api/documentms/download.ashx?id=9f4e32d3-cb97-4ff5-852a-6cb168a9f936.
[9] KPMG. (2024). SEBI introduces certain key changes in BRSR reporting. https://kpmg.com/in/en/insights/2025/01/firstnotes-sebi-introduces-certain-key-changes-in-brsr-reporting.html.
[10] Corporate Governance Code for listed companies 2017. https://www.manifest.co.uk/wp-content/uploads/2020/06/Thailand-Corporate-Govenance-Code-EN-2017.pdf.
[11] Hieu, P.D., Thuy, L.T.T., Ngoc, H.T.B., Lam, N.T.H. (2019). Mandatory social and environmental disclosure of listed companies in Vietnam. Academy of Accounting and Financial Studies Journal, 23(5): 1-10.
[12] Securities and Exchange Commission. (2019). Sustainability reporting guidelines for publicly-listed companies. https://documents.pse.com.ph/wp-content/uploads/sites/15/2022/08/2019MCNo4.pdf.
[13] Banco Central Do Brasil. Social and environmental responsibility. https://www.bcb.gov.br/en/about/socialresponsibility.
[14] UN Global Compact. (2018). SDGs in Brazil: The role of the private sector. https://ceowatermandate.org/resources/sdgs-in-brazil-the-role-of-the-private-sector-2018/.
[15] Singhania, M., Saini, N., Shri, C., Bhatia, S. (2024). Cross-country comparative trend analysis in ESG regulatory framework across developed and developing nations. Management of Environmental Quality: An International Journal, 35(1): 61-100. https://doi.org/10.1108/MEQ-02-2023-0056
[16] Chen, W., Xie, Z., Huang, M. (2025). Corporate ESG performance and the capital market’s information environment: Evidence from analysts’ forecasts. Journal of Applied Economics, 28(1): 2433770. https://doi.org/10.1080/15140326.2024.2433770
[17] Vasiu, D.E., Bratu, R. (2022). An overview on environmental social and governance-ESG-topics from the financial markets' perspective. Management of Sustainable Development, 14(2): 76-82. https://doi.org/10.54989/msd-2022-0021
[18] IDX. (2025). Strengthening ESG data transparency, IDX launches ESG reporting for listed companies. https://www.idx.co.id/id/berita/siaran-pers/2307.
[19] IDX. (2024). Bursa Malaysia, IDX, SET, and SGX group collaborate to develop an Asean interconnected sustainability ecosystem (ASEAN-ISE). https://www.idx.co.id/en/news/press-release/2100.
[20] Miao, X. (2024). Challenges and responses to ESG risk management. International Conference on Finance and Economics, 6(1): 55-63. https://doi.org/10.22158/mmse.v6n1p55
[21] Rahat, B., Nguyen, P. (2024). The impact of ESG profile on firm's valuation in emerging markets. International Review of Financial Analysis, 95: 103361. https://doi.org/10.1016/j.irfa.2024.103361
[22] Rahmaniati, N.P.G., Ekawati, E. (2024). The role of Indonesian regulators on the effectiveness of ESG implementation in improving firms’ non-financial performance. Cogent Business & Management, 11(1): 2293302. https://doi.org/10.1080/23311975.2023.2293302
[23] Nandan, S.P.K.N., Sinku, S. (2024). The ESG evolution: Bridging the gap between global standards and local realities in emerging markets. Nanotechnology, 137-153. https://doi.org/10.62441/nano-ntp.vi.3623
[24] Lubis, M.F.F., Rokhim, R. (2021). The effect of environmental, social, and governance (ESG) disclosure and competitive advantage on companies performance as an implementation of sustainable economic growth in Indonesia for period of 2015-2019. IOP Conference Series: Earth and Environmental Science, 940(1): 012059. https://doi.org/10.1088/1755-1315/940/1/012059
[25] Nareswari, N., Tarczyńska-Łuniewska, M., Al Hashfi, R.U. (2023). Analysis of environmental, social, and governance performance in Indonesia: Role of ESG on corporate performance. Procedia Computer Science, 225: 1748-1756. https://doi.org/10.1016/j.procs.2023.10.164.
[26] Putri, C.M., Puspawati, D. (2023). The effect of ESG disclosure, company size, and leverage on company’s financial performance in Indonesia. The International Journal of Business Management and Technology, 7(2): 252-262.
[27] Benuzzi, M., Bax, K., Paterlini, S., Taufer, E. (2025). Chasing ESG performance: How methodologies shape outcomes. International Review of Financial Analysis, 104(A): 104239. https://doi.org/10.1016/j.irfa.2025.104239
[28] Hogenmuller, E., Tuvache, L., Schrapffer, A. (2024). Exploring the link between ESG ratings and financial performance: A sector-by-sector analysis. SSRN Electronic Journal.
[29] Setiawati, A., Hidayat, T. (2023). The influence of environmental, social, governance (ESG) disclosures on financial performance. Jurnal Ekonomi, Manajemen Dan Perbankan, 9(3): 225-240. https://doi.org/10.35384/jemp.v9i3.454
[30] Berg, F., Kölbel, J.F., Rigobon, R. (2022). Aggregate confusion: The divergence of ESG ratings. Review of Finance, 26(6): 1315-1344. https://doi.org/10.1093/rof/rfac033
[31] LSEG Data & Analytics. (2024). Environmental, social and governance scores from LSEG. https://www.lseg.com/content/dam/data-analytics/en_us/documents/methodology/lseg-esg-scores-methodology.pdf?ref=zoya-blog.
[32] Syarkani, Y., Subu, M.A., Waluyo, I. (2024). Impact of ESG performance on firm value: A comparison of emerging and developed markets. Commercium: Journal of Business and Management, 2(4): 240-255. https://doi.org/10.61978/commercium.v2i4.367
[33] Srivastava, A., Anand. (2023). ESG performance and firm value: The moderating role of ownership concentration. Corporate Ownership & Control, 20(3): 169-179. https://doi.org/10.22495/cocv20i3art11
[34] Yu, Z., Farooq, U., Alam, M.M., Dai, J. (2024). How does environmental, social, and governance (ESG) performance determine investment mix? New empirical evidence from BRICS. Borsa Istanbul Review, 24(3): 520-529. https://doi.org/10.1016/j.bir.2024.02.007
[35] Manjengwa, E., Dunga, S.H., Mncayi-Makhanya, P., Makhalima, J. (2025). ESG performance and economic growth in BRICS countries: A dynamic ARDL panel approach. Sustainability, 17(14): 6334. https://doi.org/10.3390/su17146334
[36] The Thomson Reuters Business Classification. https://classification.codes/classifications/industry/trbc.