Aslan Azimzadeh![]()
© 2025 The author. This article is published by IIETA and is licensed under the CC BY 4.0 license (http://creativecommons.org/licenses/by/4.0/).
OPEN ACCESS
The assessment of investment efficiency, as a vital determinant of sectoral economic growth, constitutes a fundamental basis for formulating long-term development strategies for the mining sector. The purpose of this exploratory study is to measure the efficiency of investments in fixed capital in the mining industry, which occupies an important place in the structure of Azerbaijan's exports, using a more progressive method. Cross-correlation and the lagged investment efficiency index proposed by the author were used as methods. As a result, it was determined that investments in fixed capital within Azerbaijan's mining industry begin to reflect in industry output after a six-year period. The lagged investment efficiency index was calculated on the basis of this information and was divided into three divisions. Investment efficiency was assessed differently in the divisions. Although inefficiency was observed in division 1, efficiency was seen in divisions 2 and 3. Since the lag-based investment efficiency index is a macroeconomic proportional analysis methodology, it can be concluded that the balance between the investment-output proportion in the Azerbaijani mining industry has been maintained.
macroeconomic proportions, lagged investment efficiency index, fixed capital investment, disproportionality, cross-correlation, incremental capital-output ratio, COVID-19
The main factors characterizing the economic development of countries have always been of interest to economists. Especially after force majeure events such as the Global Financial Crisis and the COVID-19 pandemic, the analysis of economic development has become somewhat more relevant. It should be noted that investments are being evaluated as one of the factors that play an important role in the development of the national economy [1-3]. However, in an economic reality where resources are limited and demands are endless, the efficiency of investments comes to the fore as an important factor. This is why studying the efficiency of investments is vital, especially for developing countries.
The efficiency of investments in different sectors has been studied by a number of researchers. Some researchers have studied the efficiency of investments in a specific sector, while others have made a comparative analysis of the efficiency of investments in different sectors. For example, Shmatkovska et al. [4] examined the efficiency of investments in the agricultural sector, and Kapsoli et al. [5] examined the efficiency of investments in infrastructure. On the other hand, Qazi and Ammad [6] examined the efficiency of investments in sectors such as energy, agriculture, wholesale and retail trade, services, manufacturing, infrastructure, finance and insurance, mining and quarrying, and construction, and Binh [7] examined the efficiency of investments in sectors such as agriculture, forestry and fisheries, industry and construction, and services.
The mining industry as a whole is of essential importance in the activities of various sectors of the economy and in providing society with essential raw materials [8, 9]. This industry mainly combines metal and energy raw materials [10]. However, the author might state a literature gap regarding the efficiency of investments across sectors in Azerbaijan. In general, studies have been conducted on the renewable energy sector [11], oil and gas sector [12], banking sector [13], as well as tourism sector [14] and agricultural sector [15] in Azerbaijan. Yet, there is a gap in measuring the efficiency of investments, especially in the mining industry.
The main objective of the study is to measure the efficiency of investments in the mining industry of Azerbaijan. Azerbaijan's rich oil and gas deposits have also characterized the development of the mining industry. For this reason, measuring the efficiency of investments in the sector in question is also significant.
The novelty of the exploratory study is mainly focused on the calculation of efficiency with a new method, such as the investment efficiency index, formulated through macroeconomic proportional analysis based on cross-correlation, proposed by the author.
The research aims to address the following questions:
RQ1: What is the lag time of fixed capital investments in the Azerbaijani mining industry?
RQ2: Are fixed capital investments in the Azerbaijani mining industry efficient?
These two research questions will determine the main directions of the work.
Investment lags characterize the number of years after which investments affect some other factor. Several studies have analyzed investment lags. For example, according to research by the Australian Bureau of Agricultural and Resource Economics (ABARE), in a study conducted within the Australian mining industry, investments in a new mining project affect mining output with an average lag of 3 years [16]. Campbell [17] studied the companies on the InformationWeek Top 500 list and found that IT investments affect companies' performance benefits with an average lag of 3-4 years. Provenzano and Bull [18] note in their research on the African continent that the start of new mines affects the development of urban areas located within 20 km of those mines by about 2 times after 15 years. It should be noted that the opening of new mines results in investment in this area. Therefore, here the delayed impact of investments directed to the opening of new mines on the development of cities around these mines is analyzed.
Table 1. Research on investment lags
|
Refs. |
Analyses |
Result |
|
[19] |
Aggregate Time-Series, Empirical, Intertemporal Model of Country-Investment (and the Current Account) to a Sectoral-Level |
Investment growth in Agriculture, Forestry and Fisheries, Wholesale Trade, Transport, Postal and Warehousing and Financial and Insurance services responded with a one-year lag. |
|
[20] |
Polynomial Distributed Lag Model |
Foreign investments affect the country's economy with a 2-year lag. |
|
[21] |
Non-Linear Poisson-Lag Structure Model |
Investments in tangible assets show their impact after approximately 8-9 years, investments in intangible assets after approximately 12 years, and investments in ICT after approximately 14 years. |
|
[22] |
Panel Regression Analysis |
R&D investments have a positive effect on the market value of firms over a certain lag. |
|
[23] |
Regression Analysis |
Lag periods of R&D investments to enterprise value in automobile manufacturing are equal to or greater than 5 years. The lag period of R&D investments in the Internet industry is 4 years. |
|
[24] |
Panel Vector Autoregressive Model (PVAR) |
Chinese investment directly affects the economic growth of Belt and Road developing countries with a 6-year lag |
|
[25] |
Dynamic Panel Approach of Generalized Method of Moments |
Investments in IT have an impact on a firm's performance after the first year. |
Since the first research question of the study was to determine the investment lag in fixed capital in the mining industry in Azerbaijan, some of the studies that include investment lags in accordance with the research question can be seen more clearly in Table 1.
As can be seen from Table 1, a number of researchers have analyzed how many years later investments in different sectors show themselves in some other variable or the lagged effect of investment.
Since the second research question is related to the efficiency of investments, it is also necessary to investigate the analysis in this direction. A number of researchers have conducted studies in this field [26-28]. For example, Zeng et al. [29] use DEA analysis in their study to find that the efficiency of investments in the new energy industry in China is somewhat low.
Campano et al. [30] analyzed the efficiency of investments in 27 European countries using the Incremental Capital-Output Ratio (ICOR). As a result, the efficiency of investments in each country can be clearly observed.
At the same time, Ma [31] used DEA analysis to find that there is some variability in the effectiveness of clean energy investments in China, which decreases in some years and increases in other years.
Faizza [32] uses ICOR in his study and notes that investment efficiency in East Java, Indonesia, is higher than in other regions.
Table 2. Research on investment efficiency
|
Refs. |
Analyses |
Result |
|
[33] |
Investment/GDP Ratio, Incremental Capital-Output Ratio (ICOR) |
Investment efficiency in China is showing better results than in the Newly Industrialized Countries of East Asia. |
|
[34] |
Incremental Capital-Output Ratio (ICOR), Malmquist index |
According to the Malmquist index, Sichuan Province has high investment efficiency in 9 industries (including mining) out of 14 industries. The ICOR analysis shows that investment efficiency in Sichuan province has been declining over the years. |
|
[35] |
Incremental Capital-Output Ratio (ICOR) |
Investments directed at the economy of some regions are more effective than those directed at other regions |
|
[36] |
Incremental Capital-Output Ratio (ICOR) |
The efficiency of investments directed at the economy is relatively weak. |
|
[37] |
Data envelopment analysis (DEA) |
Investment efficiency in the food sector is low |
|
[7] |
Incremental Capital-Output Ratio (ICOR) |
Investment efficiency has increased across various sectors over time. |
|
[38] |
Incremental Capital-Output Ratio (ICOR) |
There has been a slight decline in the efficiency of investments in agriculture in the post-pandemic period. However, efficiency is still observed in overall investments. This is because the agricultural sector in the region is more labor-intensive than capital-intensive. |
|
[39] |
Incremental Capital-Output Ratio (ICOR) |
Investments in the tourism sector have been effective |
|
[40] |
SBM-DEA Method, Spatial Autoregressive Models |
The efficiency of green investment is low in enterprises that pollute the environment a lot |
Studies by various scholars on investment efficiency analysis are reflected in the table (Table 2).
Although these studies measure the efficiency of investments, some of them almost do not take into account the lags of investments. This can lead to certain errors. That is why, in this study, it may be necessary to propose an efficiency index that takes into account the lags of investments in order to obtain better results.
The methodological basis will be the author's calculations based on official data of the State Statistical Committee of the Republic of Azerbaijan. The quantitative method will be used in the research work. Thus, cross-correlation will be used to calculate the lags of investments in fixed capital in the mining industry, and a slightly different version of ICOR, which is considered a macroeconomic proportional ratio, will be used to calculate the efficiency of these investments. The novelty of the research is the use of a more progressive method formed from the unity of these two methods.
First, as mentioned, cross-correlation will be used to clarify how many years later investments in fixed capital in the mining industry affect the output of the mining industry. Bourke [41] notes that cross-correlation shows the correlation between two variables. In this case, while keeping one variable constant, lags are added to the other variable. Ausloos et al. [42] analyze the relationship between foreign direct investment and GDP by holding one variable constant and adding lags to the other, which they call the adjusted Pearson correlation to allow for the introduction of time lags. However, the formula that the researchers specifically mention is the classic cross-correlation formula. Therefore, cross-correlation will be used to find the lag of the impact of fixed capital investment in the mining industry.
$r_k=\frac{\sum_{t=k+1}^T\left(x_t-\bar{x}\right)\left(y_{t-k}-\bar{y}\right)}{\sqrt{\sum_{t=k+1}^T\left(x_t-\bar{x}\right)^2} \cdot \sqrt{\sum_{t=k+1}^T\left(y_{t-k}-\bar{y}\right)^2}}$ (1)
In the framework of the study, here x is the output of the mining industry, y is the investment in fixed capital in the mining industry, and yt-k is the lagged indicator of investment in fixed capital in the mining industry. In some methods, when adding lag, it is usually observed that the maximum lag indicator is taken as one-fourth of the sample size [43]. This means that it is recommended that the added lag not exceed this limit. For this reason, the sample size in the research study will be divided by 4. In general, this method is used not only in the field of economics, but also in other fields, which characterizes the method's applicability in various fields of science [44-48]. Finding the appropriate lag during cross-correlation is characterized as the lag that gives the highest value [49]. In some literature, it is observed that the first significant lag is also taken as the basis [50]. This study will be based on the lag that yields the highest value. An analysis of the relevant literature characterizes a correlation coefficient greater than 0.6 as a strong relationship [51-53]. Therefore, the threshold for identifying strong correlations was set at 0.6. The Gretl program (version 2025 b) will be used in the visualization process, at the same time as calculating the cross-correlation and some relevant tests.
In the study, fixed capital investments in the mining industry were coded as Inv_FA, and output in the mining industry was coded as Min_Out. First, it is necessary to conduct a normality test of the variables, which is reflected in the table below (Table 3). It should be noted that conducting correlations with constant values makes the results more reliable. For this reason, normality tests were initially conducted on constant values of the variables. However, due to the violation of the normality hypotheses, nominal values were used.
Table 3. Test for normality of Inv_FA and Min_Out
|
|
Result |
P Value |
Result |
P Value |
|
|
Inv_FA |
Min_Out |
||
|
Doornik-Hansen |
0.2772 |
0.871 |
4.1433 |
0.126 |
|
Shapiro-Wilk W |
0.9726 |
0.731 |
0.9195 |
0.057 |
|
Lilliefors |
0.1200 |
~=0.49 |
0.1151 |
~=0.55 |
|
Jarque-Bera |
0.3723 |
0.830 |
3.8016 |
0.149 |
The calculations show that both variables are normal. The p-value of the normality tests for both variables is higher than 0.05 [54]. This means that the cross-correlation method can be used.
It should be noted that, in order to provide more reliable and interpretable results, several transformations of the investment and output series were tested, including first differences and log growth rates. However, these transformations produced strong deviations from normality (Shapiro-Wilk, p < 0.05), which made Pearson-type cross-correlation statistically inappropriate. For this reason, the analysis was conducted on level series that preserved both normality and the temporal structure necessary to identify the relationship between investment and output.
The next step is to find the investment efficiency using a slightly different method from ICOR. In a number of studies, it is possible to see that the indicator has changed while maintaining the basic principle of ICOR [55, 56]. ICOR measures the efficiency of investments as a whole, and the higher its value, the lower the investment efficiency [57]. Usually, the measurement of ICOR in the classical sense is as follows [28, 58]:
$I C O R=\frac{\Delta K}{\Delta Y}=\frac{I}{\Delta Y}$ (2)
Here, $\Delta K$ is the change of Gross Fixed Capital Formation, I is the gross investment, and $\Delta Y$ is the change in output, usually GDP. The study presents an alternative investment efficiency index using the inverse of the classical ICOR indicator, which is considered an important macroeconomic proportional indicator.
$I E I=\frac{\overline{g_Y}}{\overline{g_I}}$ (3)
Here, $\overline{g_Y}$ is the arithmetic mean annual growth rate of output in the sector and $\overline{g_I}$ is the arithmetic average annual growth rate of fixed capital investments in the sector, which in the context of the study is the mining industry. However, an important issue here is the lag factor. It is expected that this formula will be applied after finding the lag, in which case the formula takes the following form.
$I E I_{{lag }}=\frac{\overline{g_Y}}{\overline{g_{I_{t-L}}}}$ (4)
Here, $\overline{g_{I_{t-L}}}$ is the lag investment indicator. Higher values indicate greater output growth per unit of previous investment growth.
$I E I_{{lag }}$ = 1 indicates a proportional (neutral) response;
$I E I_{{lag }}$ > 1 indicates a super-proportional response (greater investment efficiency);
$I E I_{{lag }}$ < 1 indicates a sub-proportional response (lower investment efficiency).
However, an important aspect here is the interpretation of negative indicators.
Negative investment, positive output-this may indicate, first of all, a short-term increase in the efficiency of capital use due to the activation of underutilized opportunities. Although the occurrence of such a situation reflects not the efficiency of new investment flows, but the higher productivity of existing assets, it still represents a short-term and temporary efficient stage in the investment-output relationship.
Positive investment, negative output-The main reason for this is precisely the inefficiency of investments and the suboptimal allocation of resources. Therefore, the negative indicator that arises in such a case should be considered as inefficiency.
Negative investment, negative output-both variables decrease at the same time, usually reflecting broader economic downturns or external shocks. However, here, the concept of relative efficiency can be formed. Thus, the ratio of these two negative indicators, characterizing economic contraction, gives a positive number, which requires some additional interpretation. If both variables are negative, then the value $I E I_{{lag }}$ < 1 indicates relative efficiency, since output decreases by a more moderate amount than investment.
At the same time, if both variables are negative, then the value $I E I_{{lag }}$ > 1 indicates relative inefficiency, since investment decreases by a more moderate amount than output.
Within the framework of the first research question, it is necessary to find out the lag in fixed capital investments in the mining industry of Azerbaijan.
Provenzano and Bull [18] calculated the lag effect of investments in the mining industry on the development of cities around the mines and found that there was a nearly 2-fold development over 15 years.
However, in this study, the lag effect of investments in fixed capital in the mining industry of Azerbaijan on the output of the mining industry will be analyzed. For this, the period 2000-2023 was selected.
The main purpose of choosing this period is related to the continuation of the shock therapy factor in Azerbaijan until the 2000s and the completion of the economy's recovery after approximately 2000. This can be considered one of the main limitations of the study.
One more limitation should be noted. As it is clear from the methodology section, this study uses cross-correlation analysis as the main tool to identify the temporal relationship between investment and output.
This method was deliberately chosen because it allows us to reveal the structure and direction of the association without imposing strict model assumptions.
Although cross-correlation provides a clear and intuitive understanding of the time dynamics between investment and output, future studies could complement this approach with causality-based econometric models (e.g., Granger or ARDL tests) to further validate and deepen the results.
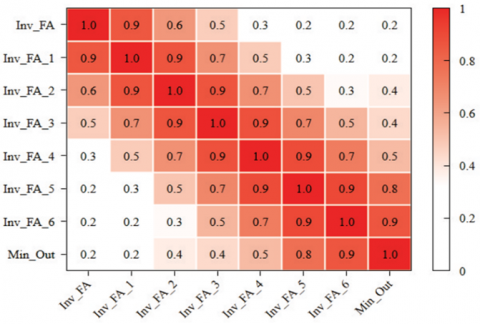
The table shows the cross-correlation results of 6 lags added to fixed capital investments in the mining industry (Table 4).
It can be seen from the table that the high lag value is determined at lag 6. Here, the rk result is determined as 0.8595. This correlation coefficient characterizes the presence of a strong relationship.
On the other hand, the heatmap shows the same result (Figure 1). The heatmap shows that the highest lag value appears exactly when lag is 6 (the darkest red colour).
Table 4. Cross-correlation coefficients, using the observations 2006-2023
|
Inv_FA |
Inv_FA_1 |
Inv_FA_2 |
Inv_FA_3 |
Inv_FA_4 |
Inv_FA_5 |
Inv_FA_6 |
Min_Out |
|
|
1.000 |
0.8544 |
0.6392 |
0.4694 |
0.2835 |
0.1784 |
0.2171 |
0.1931 |
Inv_FA |
|
|
1.0000 |
0.8651 |
0.6566 |
0.4788 |
0.3026 |
0.1991 |
0.2461 |
Inv_FA_1 |
|
|
|
1.0000 |
0.8651 |
0.6606 |
0.4952 |
0.3331 |
0.3761 |
Inv_FA_2 |
|
|
|
|
1.0000 |
0.8764 |
0.6921 |
0.5433 |
0.4341 |
Inv_FA_3 |
|
|
|
|
|
1.0000 |
0.8919 |
0.7276 |
0.5281 |
Inv_FA_4 |
|
|
|
|
|
|
1.0000 |
0.9045 |
0.7717 |
Inv_FA_5 |
|
|
|
|
|
|
|
1.0000 |
0.8595 |
Inv_FA_6 |
|
|
|
|
|
|
|
|
1.0000 |
Min_Out |
Figure 1. Heatmap of the cross-correlation coefficients
Table 5. Student t-critical test
|
rk |
T-Value |
T-Critical** |
T-Critical*** |
|
0.8595 |
6.72619756 |
2.11991 |
2.92078 |
However, it is also necessary to conduct a Student t-test to test the significance of the obtained coefficient (Table 5) [54].
As a result of the Student t-critical test, it can be noted that the obtained coefficient is significant. Because the t-value is greater than both the t-critical value at the 95 percent confidence level and the t-critical value at the 99 percent confidence level. Therefore, it can be noted that investments in fixed capital in the mining industry in Azerbaijan affect output after 6 years (lag=6).
For comparison, it should be noted that this lag is 3 years longer than the average investment lag in Australian mines, as according to ABARE research, the average investment lag in the Australian mining industry is 3 years [16].
At the same time, this lag is 5 years longer than the investment lag in various sectors of the economy in New Zealand. Thus, Razzak [19] in his study concluded that the investment lag in the agriculture, forestry and fishing, wholesale trade, transport, postal and warehousing, and financial and insurance services sectors of the economy in New Zealand is 1 year. However, the lag analysis for the mining industry was not conducted here.
On the other hand, the lag obtained for Azerbaijan is approximately 2-3 years shorter than the lag period of investments in tangible assets in European countries. As a result of a study conducted by Grebel and Nesta [21] for 12 European countries, it was determined that the lag period of investments in tangible assets in these countries is 8-9 years on average.
The result obtained is somewhat close to that of Xie et al. [23]. Thus, the researchers concluded that the lag period of R&D investments in automobile manufacturing in China can be equal to or higher than 5. Although automobile manufacturing is considered an industry, it has different specificities from the mining industry. On the other hand, the investments made here are R&D investments, unlike investments in fixed assets. In general, the method of calculating lags is different in each article and is not identical to the method in this study.
The next research question will measure the efficiency of fixed capital investments in the mining industry in Azerbaijan. The proposed method will be used for this. Taking into account the lag of 6, the efficiency is calculated in the following table (Table 6).
Table 6. Efficiency index of fixed capital investments in the mining industry in Azerbaijan
|
|
Inv_FA Years |
Min_Out Years |
Avg Inv_FA Growth |
Avg Min_Out Growth |
IEIlag |
|
1 |
2000-2006 |
2006-2012 |
45.17% |
19.47% |
0.43 |
|
2 |
2006-2012 |
2012-2018 |
4.72% |
7.71% |
1.63 |
|
3 |
2012-2018 |
2018-2023n |
9.16% |
14.12% |
1.54 |
Growth rates for investment were calculated from 2001 relative to 2000, while for output, calculations started from 2007 relative to 2006, reflecting a 6-year lag to capture the lagged impact of investment on output. The average annual growth rate was then obtained as the arithmetic mean of all year-to-year growth rates in each 7-year window. The IEIlag was finally obtained as the ratio of average output growth to average investment growth. Although inefficiency of investments was observed in division 1, efficiency of investments was observed in divisions 2 and 3. It should be noted that the third section is incomplete due to the lack of data for 2024 at the time of analysis. Therefore, the corresponding value should be interpreted with caution, reflecting a five-year period rather than a full six-year period. The mining industry also characterizes oil and gas production. These sectors contain the most foreign direct investments and modern technology transfers in Azerbaijan. Therefore, an increase in efficiency is observed over the years.
This brings to the fore a somewhat similar picture to other analyses. Thus, Li [34] found in his study that 9 sectors, including the mining industry in Sichuan Province, China, have high investment efficiency. According to the researcher’s result, the Malmquist index value of the investment efficiency of the mining industry in Sichuan Province, China, is 1.124, which makes the investment efficiency of the mining industry ranked 3rd among the investment efficiency of the 14 sectors studied. However, the researcher used the Malmquist index here, which is different from our method.
On the other hand, Ateljevic et al. [39] used ICOR, which is somewhat similar to the research method here, and found that investments in the tourism sector in Bosnia and Herzegovina were effective. The study showed that the ICOR calculated for the tourism sector in Bosnia and Herzegovina decreased from 0.17 in 2017 to 0.12 in 2022, which implies an increase in the efficiency of investments.
The results obtained are actually an important macroeconomic proportion. In fact, there is a ratio between the two indicators here, which corresponds to the specifics of the macroeconomic proportion. The important direction here is precisely the preservation of this balanced proportion. That is, the fact that the average growth rate of the sector's output is not higher than or at least equal to the average growth rate of investments in that sector is an indicator of disproportionality. In other words, this situation is a disruption of the balance between the investment-output proportion. From this, it can be characterized that proportionality is maintained between investments in fixed capital and the output of Azerbaijan's mining industry.
In the period of uncertainty in the international economy, the efficient use of investments is necessary. Investments are an indispensable factor for the sustainable development of the economy, including its various sectors. The mining industry can be considered a very important sector within the framework of being a supplier of raw materials to the main sectors of the economy and meeting the necessary needs of society. Since Azerbaijan is a country that exports oil and gas, finding the efficiency of investments in the mining industry here can act as an important indicator in the preparation of strategic plans that include the main vectors of economic development in the long term.
The lag of fixed capital investments in the mining industry in Azerbaijan has been determined as 6 years. In parallel, high investment efficiency was observed. In fact, the use of the ratio of two economic indicators when calculating efficiency characterizes the presence of macroeconomic proportionality here. A high lag investment efficiency index indicates that macroeconomic proportionality is maintained. Therefore, the results of this exploratory study will be important for studying the state of the investment-output ratio in other areas.
[1] Shabbir, M.S., Bashir, M., Abbasi, H.M., Yahya, G., Abbasi, B.A. (2021). Effect of domestic and foreign private investment on economic growth of Pakistan. Transnational Corporations Review, 13(4): 437-449. https://doi.org/10.1080/19186444.2020.1858676
[2] Banday, U.J., Murugan, S., Maryam, J. (2021). Foreign direct investment, trade openness and economic growth in BRICS countries: Evidences from panel data. Transnational Corporations Review, 13(2): 211-221. https://doi.org/10.1080/19186444.2020.1851162
[3] Kayani, F.N., Alzaid, O. (2024). Navigating the classical relationship between foreign direct investment and economic growth: A case of Saudi Arabia. International Journal of Sustainable Development and Planning, 19(11): 4315-4322. https://doi.org/10.18280/ijsdp.191120
[4] Shmatkovska, T., Kulinich, T., Dziamulych, M., Rogach, S., Bilochenko, A., Serdiukova, O. (2022). Analysis of investment efficiency in the agricultural sector of Ukraine on the basis of sustainable development. Scientific Papers Series Management, Economic Engineering in Agriculture & Rural Development, 22(3): 649-658.
[5] Kapsoli, J., Mogues, T., Verdier, G. (2023). Benchmarking infrastructure using public investment efficiency frontiers. International Monetary Fund, (No. 2023/101).
[6] Qazi, M.A., Ammad, S. (2021). Public investment efficiency and sectoral economic growth in Pakistan. Development Policy Review, 39(3): 450-470. https://doi.org/10.1111/dpr.12493
[7] Binh, M.N.T. (2022). Improving investment attraction for economic and social development in Bac Ninh province. Journal of Finance & Accounting Research, 4(17): 14-20.
[8] Igogo, T., Awuah-Offei, K., Newman, A., Lowder, T., Engel-Cox, J. (2021). Integrating renewable energy into mining operations: Opportunities, challenges, and enabling approaches. Applied Energy, 300: 117375. https://doi.org/10.1016/j.apenergy.2021.117375
[9] Worlanyo, A.S., Jiangfeng, L. (2021). Evaluating the environmental and economic impact of mining for post-mined land restoration and land-use: A review. Journal of Environmental Management, 279: 111623 https://doi.org/10.1016/j.jenvman.2020.111623
[10] Kalisz, S., Kibort, K., Mioduska, J., Lieder, M., Małachowska, A. (2022). Waste management in the mining industry of metals ores, coal, oil and natural gas-A review. Journal of Environmental Management, 304: 114239. https://doi.org/10.1016/j.jenvman.2021.114239
[11] Hasanov, F.J., Mukhtarov, S., Suleymanov, E. (2023). The role of renewable energy and total factor productivity in reducing CO2 emissions in Azerbaijan. Fresh insights from a new theoretical framework coupled with Autometrics. Energy Strategy Reviews, 47: 101079. https://doi.org/10.1016/j.esr.2023.101079
[12] Hajiyeva, G., Babayev, N., Babayev, T., Hasanov, A., Madatov, M. (2025). The role of oil and gas industry in Azerbaijan’s economic development: Investment trends and global context. Polityka Energetyczna, 28. https://doi.org/10.33223/epj/202559
[13] Mukhtarov, S., Humbatova, S., Seyfullayev, İ. (2019). The impact of bank credits on non-oil GDP: Evidence from Azerbaijan. Banks and Bank Systems, 14(2): 120-127. https://doi.org/10.21511/bbs.14(2).2019.10
[14] Ahmadov, F., Mirzayeva, G., Mammadov, I. (2021). Competitiveness analysis of the tourism sector in Azerbaijan and the clustering problem. Journal of Environmental Management & Tourism, 12(8): 2240-2250.
[15] Hasanov, R.I., Mammadova, R., Gozalova, S., Karimova, N., Vasa, L. (2025). Exploring the long-term relationship between freshwater withdrawals and agricultural output in Azerbaijan: Evidence from ARDL and cointegration analysis (2000-2021). International Journal of Design & Nature and Ecodynamics, 20(6): 1371-1377. https://doi.org/10.18280/ijdne.200617
[16] Topp, V., Soames, L., Parham, D., Bloch, H. (2008) Productivity in the mining industry: Measurement and interpretation. Productivity Commission Staff Working Paper.
[17] Campbell, M. (2012). What a difference a year makes: Time lag effect of information technology investment on firm performance. Journal of Organizational Computing and Electronic Commerce, 22(3): 237-255. https://doi.org/10.1080/10919392.2012.696944
[18] Provenzano, S., Bull, H. (2021). The local economic impact of mineral mining in Africa: Evidence from four decades of satellite imagery. arXiv Preprint arXiv: 2111.05783. https://doi.org/10.48550/arXiv.2111.05783
[19] Razzak, W. (2014). An empirical investigation of sectoral-level capital investments in New Zealand. New Zealand Treasury Working Paper, No. 14/04.
[20] Kuliaviene, A., Solnyskiniene, J. (2014). The evaluation of the impact of foreign direct investment on Lithuanian economy using LAG-analysis. Economics and Management, 19(1): 16-24. https://doi.org/10.5755/j01.em.19.1.5597
[21] Grebel, T., Nesta, L. (2019). The lag structure of investment and productivity growth. In Structural Reforms in France, 2013-2017. Europäische Kommission, pp. 49-67. https://doi.org/10.22032/dbt.39493
[22] Lee, J.W. (2020). Lagged effects of R&D investment on corporate market value: Evidence from manufacturing firms listed in Chinese stock markets. The Journal of Asian Finance, Economics and Business, 7(8): 69-76. https://doi.org/10.13106/jafeb.2020.vol7.no8.069
[23] Xie, H., Yang, J., Yu, W., Yang, Y., Wu, W. (2020). The time-lag effect of R&D investment on the value of listed companies in China: A cross-industry analysis. Journal of Creating Value, 6(2): 217-231. https://doi.org/10.1177/2394964320923543
[24] Zhang, Y., Cheng, Z., He, Q. (2020). Time lag analysis of FDI spillover effect: Evidence from the Belt and Road developing countries introducing China’s direct investment. International Journal of Emerging Markets, 15(4): 629-650. https://doi.org/10.1108/IJOEM-03-2019-0225
[25] Winarno, W.A., Tjahjadi, B., Irwanto, A. (2021). Time lag effects of IT investment on firm performance: Evidence form Indonesia. Jurnal Ekonomi Malaysia, 55(3): 89-101. http://dx.doi.org/10.17576/JEM-2021-5503-06
[26] Ali, S., Farooq, M., Xiaohong, Z., Hedvicakova, M., Murtaza, G. (2024). Board characteristics, institutional ownership, and investment efficiency: Evidence from an emerging market. PLoS ONE, 19(2): e0291309. https://doi.org/10.1371/journal.pone.0291309
[27] Godsell, D., Jung, B., Mescall, D. (2023). Investor relations and investment efficiency. Contemporary Accounting Research, 40(3): 1966-1998. https://doi.org/10.1111/1911-3846.12860
[28] Mazllami, J. (2023). The investments efficiency toward economic growth: ICOR of the republic of croatia and slovenia-comparative analysis. Journal of Economic & Social Studies (JECOSS), 8(1): 1-14.
[29] Zeng, S., Jiang, C., Ma, C., Su, B. (2018). Investment efficiency of the new energy industry in China. Energy Economics, 70: 536-544. https://doi.org/10.1016/j.eneco.2017.12.023
[30] Campano, F., Costantiello, A., Laureti, L., Salvatore, D. (2020). Why does Europe grow more slowly than the United States? Journal of Policy Modeling, 42(4): 903-912. https://doi.org/10.1016/j.jpolmod.2020.03.013
[31] Ma, C. (2021). DEA model construction and investment efficiency analysis of overseas electric power market in clean energy. E3S Web of Conferences, 267: 01008. https://doi.org/10.1051/e3sconf/202126701008
[32] Faizza, E. (2021). The existence of province branding to communicate the potency and positioning of East Java province, Indonesia. Jurnal Ilmu Sosial dan Ilmu Politik, 2(2): 388-401. https://doi.org/10.56552/jisipol.v2i2.38
[33] Jun, Z. (2003). Investment, investment efficiency, and economic growth in China. Journal of Asian Economics, 14(5): 713-734. https://doi.org/10.1016/j.asieco.2003.10.004
[34] Li, C.G. (2016). Use ICOR, DEA and Malmquist index to study on investment efficiency of urbanization of Sichuan Province, China. Journal of Discrete Mathematical Sciences and Cryptography, 19(3): 801-809. https://doi.org/10.1080/09720529.2016.1197568
[35] Yulianita, A., Marissa, F., Widyanata, F., Fitriyah, A., Marcheline, M. (2019). Analysis of investment efficiency by using ICOR approach to economic growth in all provinces of Sumatera Island. In Proceedings of the 4th Sriwijaya Economics, Accounting, and Business Conference (SEABC), pp. 708-704. https://doi.org/10.5220/0008444307080714
[36] Papaphilippou, A. (2021). On Moldova’s incremental capital-output ratio and the design of economic policy. Economy and Sociology, (1): 6-15. https://doi.org/10.36004/nier.es.2021.1-01
[37] Flegl, M., Jiménez-Bandala, C.A., Sánchez-Juárez, I., Matus, E. (2022). Analysis of production and investment efficiency in the Mexican food industry: Application of two-stage DEA. Czech Journal of Food Sciences, 40(2): 109-117. https://doi.org/10.17221/172/2021-CJFS
[38] Arman, A., Saefuddin, A., Pradina, F.A., Burhan, S.Y. (2023). Investment and resilience of the agricultural sector facing the COVID-19 crisis. Agrisocionomics: Jurnal Sosial Ekonomi Pertanian, 7(1): 27-38. https://doi.org/10.14710/agrisocionomics.v7i1.15126
[39] Ateljevic, A.M., Vujovic, S., Vukoicic, D., Raspor, A. (2024). Efficiency of investments in tourism in Bosnia and Herzegovina-A comparative analysis. In Proceedings of the 11th REDETE Conference on Sustainability in Western Balkans in an Era of Uncertainty, pp. 163-172.
[40] Dai, L., Zhang, R. (2025). Environmental regulation and green investment efficiency: Threshold and spatial spillover analysis for China. Sustainability, 17(7): 2934. https://doi.org/10.3390/su17072934
[41] Bourke, P. (1996). Cross correlation. In Cross Correlation, Auto Correlation-2D Pattern Identification.
[42] Ausloos, M., Eskandary, A., Kaur, P., Dhesi, G. (2019). Evidence for gross domestic product growth time delay dependence over foreign direct investment. A time-lag dependent correlation study. Physica A: Statistical Mechanics and Its Applications, 527: 121181. https://doi.org/10.1016/j.physa.2019.121181
[43] Wei, W.W.S. (2006). Time Series Analysis: Univariate and Multivariate Methods (2nd ed.). Pearson Education.
[44] Assoum, H.H., Hamdi, J., Abed-Meraïm, K., Al Kheir, M., Mrach, T., El Soufi, L., Sakout, A. (2019). Spatio-temporal changes in the turbulent kinetic energy of a rectangular jet impinging on a slotted plate analyzed with high speed 3D tomographic-particle image velocimetry. International Journal of Heat and Technology, 37(4): 1071-1079. https://doi.org/10.18280/ijht.370416
[45] Fathabadi, F.R., Molavi, A. (2019). Black-box identification and validation of an induction motor in an experimental application. European Journal of Electrical Engineering, 21(2): 255-263. https://doi.org/10.18280/ejee.210219
[46] Bhatt, T.D. (2020). Sequences with perfect periodic auto and cross correlation properties. Traitement du Signal, 37(3): 477-484. https://doi.org/10.18280/ts.370315
[47] Kato, H., Takizawa, A. (2022). Time series cross-correlation between home range and number of infected people during the COVID-19 pandemic in a suburban city. PLoS ONE, 17(9): e0267335. https://doi.org/10.1371/journal.pone.0267335
[48] Liau, B.Y., Lung, C.W., Hernandez, M.E., Mo, P.C., Li, Y., Guo, J., Jan, Y.K. (2023). Using cross-correlation analysis of multi-channel near infrared spectroscopy to assess the hemodynamic response to cupping therapy. Biomedical Optics Express, 14(9): 4455-4467. https://doi.org/10.1364/BOE.493897
[49] Rivieccio, B.A., Micheletti, A., Maffeo, M., Zignani, M., Comunian, A., Nicolussi, F., Salini, S., Manzi, G., Auxilia, F., Giudici, M., Naldi, G., Gaito, S., Castaldi, S., Biganzoli, E. (2021). COVID-19, learning from the past: A wavelet and cross-correlation analysis of the epidemic dynamics looking to emergency calls and twitter trends in Italian Lombardy region. PLoS ONE, 16(2): e0247854. https://doi.org/10.1371/journal.pone.0247854
[50] Plimmer, A. (2025). Constraining the relationship between mantle circulation and supercontinent cycles. Doctoral Dissertation, Cardiff University, Cardiff, Wales.
[51] Borowski, P.F., Patuk, I. (2021). Environmental, social and economic factors in sustainable development with food, energy and eco-space aspect security. Present Environment & Sustainable Development, 15(1). https://doi.org/10.15551/pesd2021151012
[52] Papageorgiou, S.N. (2022). On correlation coefficients and their interpretation. Journal of Orthodontics, 49(3): 359-361. https://doi.org/10.1177/14653125221076142
[53] Hair, J.F., Wolfinbarger, M.F., Ortinau, D.J., Bush, R.P. (2017). Essentials of Marketing Research, 4th edition. McGraw-Hill Education, New York.
[54] Field, A. (2013). Discovering Statistics Using IBM SPSS Statistics, 4th edition. Sage Publications Limited.
[55] Coutiño, A., Zandi, M. (2021). Global loss of production capacity caused by the COVID-19 pandemic. Journal of Policy Modeling, 43(3): 493-502. https://doi.org/10.1016/j.jpolmod.2020.07.003
[56] Afiatno, B.E., Joyoutomo, K.D. (2024). The economic impact of dry port investment in Indonesia: A case study of Bangil, Pasuruan District, East Java Province. Cleaner Logistics and Supply Chain, 13: 100179. https://doi.org/10.1016/j.clscn.2024.100179
[57] Amin, S.B., Taghizadeh-Hesary, F., Al Kabir, F., Khan, F. (2023). Nexus between energy intensity and capital-output ratio: A holistic approach. Energy & Environment, 34(7): 2721-2739. https://doi.org/10.1177/0958305X221115489
[58] Valach, J. (2009). Analysis of investment rate and efficiency in CR (1995-2006). Health, 67(5): 8.