Oleg Fedirets*![]() | Yevhen Terekhov
| Yevhen Terekhov![]() | Uliana Vytvytska
| Uliana Vytvytska![]() | Oleksii Zhuk
| Oleksii Zhuk![]() | Jiachang Zhang
| Jiachang Zhang![]()
© 2025 The authors. This article is published by IIETA and is licensed under the CC BY 4.0 license (http://creativecommons.org/licenses/by/4.0/).
OPEN ACCESS
The study assessed the influence of green technology adoption on the sustainability of natural resources (ESI and CO2 ), examining the effects of different categories, as well as the economic costs and benefits of implementing these technologies. This study employed panel regression approach using secondary panel data collected from online international databases from 2014 to 2023 across Europe and central Asia. To track the economic impacts of green technologies on natural resources, sustainability metrics (ESI and CO2 per capita) were modeled against green technology investment, renewable energy share, patent counts, with GDP per capita, population density, and educational level as control. To ensure data validation, address endogeneity, autocorrelation, multicollinearity, and model fit, Variance inflation factors, Durbin-Watson statistics, F-test were employed. Results showed that green technology significantly enhances environmental sustainability, explaining 67% of the variation in ESI (R2 = 0.67, F = 14.89, p < 0.05) and 71.3% of variation in CO2 emissions (R2 = 0.713, p < 0.05). Green technology investment had a positive and significant effect on ESI ($\beta$ = 0.012, p = 0.002) and a negative effect on CO2 emissions ($\beta$ = –0.009, p = 0.028). Innovation, measured by patent counts, and economic wealth (GDP per capita), also positively contributed to sustainability (p < 0.05). The study concluded that green technology adoption enhances natural resource sustainability and reduces environmental degradation. Policymakers should prioritize strategic green investments to achieve long-term environmental and economic sustainability.
CO2 emissions, econometric modeling, Environmental Sustainability Index, green technologies, panel regression, renewable energy
In a period characterized by unparalleled global difficulties due to changes in climatic conditions, exhaustion of natural resources, and depletion of the environment, it becomes crucial for nations to reassess strategies that promote sustainable development [1]. Environmental challenges like pollution, climate change, excessive deforestation, and loss of biodiversity have caused havoc to important natural resources, resulting in an effective modification towards sustainable practices. As stated, the concentration of the practices is to promote social obligation, preserve the economy, and guarantee long-term viability of environmental sustainability across the world [2]. Among the sustainable practices is the adoption of green technologies, which involves innovations that devise a path that minimizes damage to the environment, improves energy efficiency, and encourages resource sustainability [3]. In an attempt for nations to survive the challenges, it becomes important to ensure that developments, progress, prosperity, and uncontrolled consumption patterns are balanced to ensure environmental and natural resources stability [4].
When making solid materials, plastic instability often affects how the final product looks and works. As a result of this, studying these instabilities is very important for science and technology. For example, polymer materials like polyvinyl chloride (PVC) are commonly used in pipes, which need precise details. That is why it is crucial to understand the causes of plastic instability so that we can manage and control them effectively [5].
The role that green technologies play cannot be overemphasized, providing effective use of natural resources, preventing ecological destruction and biodiversity loss [6]. Also, green technologies are essential to guaranteeing a system of zero wastage but regeneration of nature [7], the reduction of greenhouse gas emissions, and more efficient energy sources [8]. Additionally, eco-friendly agricultural practices, waste recycling, and enhanced utilization of renewable energy sources without CO2 emission are part of the methods used to preserve economic expansion and sustainability [9]. Green technology promotes sustainable resource management, balancing environmental preservation with economic growth, and reducing adverse ecosystem impacts, attracting nations to adopt environmentally friendly solutions [10]. Contemporary entrepreneurship is increasingly confronted with the imperative to integrate environmentally sustainable practices to ensure a balance between economic development and environmental responsibility [11]. To achieve long-term sustainability and fulfill international commitments such as the UN Sustainable Development Goals, green technology can reduce environmental impacts such as pollution, resource depletion, and climate change [12]. Also, current state analysis of management of industrial waste and rational subsoil use is mandatory for adequate planning [13].
Econometric modeling is a powerful tool for evaluating economic and environmental impacts of green technologies [14], especially as nations work to meet global sustainable goals. Using statistical data, econometric modeling aids in quantifying relationships between variables, enabling systematic and rigorous assessments of theory and empirical evidence. This modeling entails several processes that use statistical techniques to bridge theory and data, thereby shedding light on the viability of the proposed theoretical model [15]. Econometric modeling is a reliable and robust analytical technique for evaluating how green technologies contribute to the sustainability of natural resources in the context of this study. This investigation aims to explore the connections between the utilization of various technologies and their sustainability measures, like pollution levels (CO2) and the Environmental Sustainability Index (ESI), by employing econometric modeling. This methodology simplifies the understanding of the complex economic considerations involved in the implementation of different green technologies, enabling the identification of causal factors and quantifiable outcomes. Moreover, econometric modeling aids in recognizing the wider economic benefits.
Among countries of interest, Ukraine provides a compelling case for inclusion due to its vast natural resource base, ongoing green transition, and alignment with EU sustainability goals. Following the disruption of its centralized energy infrastructure due to conflict, Ukraine has actively incorporated green technologies into reconstruction efforts. In war-affected oblasts such as Kharkiv, Mykolaiv, and Zaporizhzhia, decentralized solar microgrids are replacing damaged fossil fuel systems. These microgrids offer both short-term reliability and long-term environmental benefits.
According to the Ministry of Environmental Protection and Natural Resources of Ukraine, pilot projects demonstrate a 30–40% reduction in CO2 emissions compared to traditional diesel generators under similar loads. Additionally, these systems provide energy resilience in regions where the centralized grid remains vulnerable to attack or damage. These developments underscore the dual utility of green technologies in fragile contexts, supporting immediate recovery and contributing to long-term climate goals outlined in Ukraine’s National Energy and Climate Plan (NECP). It becomes highly imperative to optimize operational methods of cost reduction in operations relating to open-cast mining, thus adding value to sustainable development of resources such as mineral deposits [16].
Kazakhstan and Ukraine share common ground in advancing green technology through the sustainable management of their natural resource endowments, despite differences in economic structures and geopolitical contexts. The decentralization of renewable energy infrastructure imposes an obligation to align with the objectives of the European Union in presenting a model for climate-smart reconstruction, particularly through the deployment of microgrids for solar power in war-affected regions. Furthermore, the development of a green economy framework, driven by both domestic sustainability goals and international climate commitments, underscores the potential to utilize vast mineral and energy resources in sustainable ways. This provides an empirical foundation for analyzing how green infrastructure contributes to sustainability in resource-rich yet environmentally challenged regions such as Ukraine and Kazakhstan, serving as a critical link between recovery and long-term resilience. In terms of strategic positioning across Asia and Europe, Kazakhstan is significant as a country gifted with immense natural resources, which presents both challenges and opportunities [17]. The study focuses on Ukraine's significant natural resource endowment, green transition, and EU sustainability compliance, highlighting its strong argument for green technology in sustainable resource management, forest cover, and renewable energy potential. Also, the advancement of the international community towards practices that are sustainable places Kazakhstan at a critical point in ascertaining its economic path [18]. The economic adventure of Kazakhstan is mingled with natural resources, mining, and export, more especially in the area of minerals, and oil, and gas [19]. This is a boost to the growth of the economy and rightly positions the country as an important stakeholder in the market of global energy. The idea of the green economy is at the center of the readjustment of a model that seeks to unite the sustainability of ecology with the development of a country’s economy [20]. The ability of Kazakhstan to channel strategic investments into infrastructure which are sustainable will, without doubt, impact the capacity of a nation to be eco-friendly and resilient. Also, efficient natural resources management is a condition precedent to achieving a sustainable development plan narrative [21, 22]. To achieve viability in the long term, proper and detailed responsibility for assets under the possession of countries rich in energy, agricultural, and mineral resources, the need for Kazakhstan to walk through the process is established in what is acceptable globally, and is extremely interconnected with socio-economic architecture. Therefore, it is essential to investigate how Kazakhstan's natural resource sustainability is affected by the use of green technologies.
The use of bio-diesel is an accepted approach to ensuring diesel engines are efficient and environmentally friendly. This contributes to reducing the accumulation of harmful gases released into the environment and efficiency of engine. This is achieved by blending bio-diesel chemical and physical details so as to align with engine [23].
Despite the growing body of global literature and expanding research in Central Asia on environmental and economic sustainability [24-26], existing studies tend to focus predominantly on the environmental implications of green technologies. However, limited attention has been given to their economic impacts, particularly within resource-abundant and environmentally sensitive contexts such as Kazakhstan. In addition, there remains a lack of empirical evidence on the performance of different categories of green technologies in relation to both pollution metrics (e.g., CO2 emissions) and the ESI. Furthermore, data on the cost-efficiency and economic returns of implementing various green technologies in the country remain sparse.
To address these gaps, this study employs an econometric approach to systematically assess both the environmental and economic effects of green technology adoption in Kazakhstan. Specifically, it examines how different types of green technologies influence sustainability indicators, such as CO₂ emissions and ESI, while also considering associated economic variables such as GDP, patent activity, and investment levels. This investigation is guided by the following research questions:
i. What is the quantitative impact of green technology adoption on the sustainability of natural resources, as measured by specific indicators such as the ESI or pollution levels (CO2)?
ii. How do different categories of green technologies (e.g., renewable energy sources, energy-efficient systems, waste recycling technologies) affect the sustainability of natural resources, and are there significant differences in their impacts?
iii. What are the economic costs and benefits associated with the implementation of green technologies, and how do they influence the overall sustainability of natural resources?
This research aimed to use an effective approach of econometric modeling to assess the impact of green technology adoption on the sustainability of natural resources. Through this model, both the direct and indirect relationships among variables (dependent and independent variables) will be estimated to understand how various green technologies contribute to sustainable development using environmental and economic factors. This study aims to provide an empirical data-set on the environmental and economic impacts on natural resources, thereby contributing to the dearth of knowledge in environmental and natural resource management and sustainability. It is expected that the results of the study will help policymakers, based on the experience of similar countries, direct investments to specific “green” technologies, create regulations that stimulate environmental innovations, and develop sustainable development plans.
2.1 Theoretical groundwork of study
The theory of Diffusion of innovation creates an established basis for well-grounded foundation and good comprehension of activities of innovation in sustainable technology and its resulting diffusion within government set-up. With respect to this theory, technologies which are sustainable such as innovation diffuse through social structuring which influence behaviours and practices in organizations [27]. The observable relationship between innovation in technology which are sustainable and practices on sustainability resulting to aligning development of green economics with core canons of diffusion of innovation theory [28]. The role of government in embracing sustainable technology can be considered as subset of the bigger social system where practices of innovation is diffused to be integrated into daily operational activities [29].
This framework resonates with Ukraine's national strategy, like the WINWIN Green-Tech Strategy 2024, so that damaged infrastructure can be rebuilt with green innovation, especially in smart grids, renewable energy and digital climate solutions, which aligns with EU accession and climatic goals. Another is the National Renewable Energy Action Plan (2024-2030) where the share of renewable national energy is aimed to be raised by 27% by 2030 reflecting the adoption of green innovations and their integration through these policies [30, 31].
The theory also takes a delve into ephemeral aspects of adopting innovation. Additionally, the Theory of Resource-Based View is a complement to theory of diffusion of innovation which emphasizes strategic resource allocation, especially economic and financial investment in infrastructure which is sustainable [32]. Relationship between investments in infrastructures which are sustainable, resulting into development of green economics is in agreement with the principle of RBV that there is a contribution to achieving competitive edge through strategic resources [33]. Depreciated capital stock, especially in energy and agriculture, is seen as a necessity and opportunity for green investment due to war damage or outdated status. Thus, attracting domestic and foreign capital into green infrastructure becomes a strategic imperative [34].
2.2 Green technologies and environmental sustainability
Through reduced energy intensity, increased manufacturing process efficiency, and an increase in environmentally friendly and sustainable products and services, green technology innovation (GTI) has been recognized as a critical component in enhancing environmental quality [35]. Green technology is crucial for sustainable development, addressing the climate crisis and promoting a more sustainable future [6]. Environmental harm are reduced while improving economic efficiency, and sustainable development. These technologies are not limited to trash recycling technologies, energy-efficient production techniques, and renewable energy sources like solar, wind, and hydro power.
The acceptance of green technologies as reinforced by national framing such as Ukraine’s Green Energy Transition adopted in 2020 as a strategy in the long-run as a substitute to fossil fuels shift towards sustainable economy [27]. This acceptance is in agreement with European green objectives which encourages ecological resilience and energy independence. Also, agencies of state on energy efficiency in Ukraine provide support financially in regulatory support, grants, and technical assistance to achieve acceptance of clean technologies and improve practices which are sustainable in every of sectors [28].
The merits of green technology adoption on environment are affirmed various empirical studies. There is negative correlation between green technology carbon emissions and decrease in emissions of carbon, while environmental sustainability is positively improved [11]. Similar to this, green technology reduces pollution and conserves resources [5]. However, its challenges include insufficient cost-effectiveness or economic ramifications that affect its implementation.
2.3 Green technological innovation and carbon emissions
The factors influencing the reduction of carbon emissions have been the subject of an expanding corpus of study in recent decades. The perspective based on natural resources implies that GTI can be advantageous for the environment and a useful corporate resource for creating a competitive advantage [36]. Recent research on the function of green innovation in promoting the connection between superior economic growth and environmental sustainability in various nations and regions attests to this [37, 38]. According to Ganda, R&D spending has a negative impact on CO2 emissions, whereas patent counts have a positive correlation with carbon emissions in the OECD nations [39]. GTI and renewable energy can reduce CO2 emissions in N-11 countries over the long term as opposed to the short term. However, evidence on the impact of green technological innovation and carbon emissions is mixed and even contradictory [40]. As suggested, the market itself may not be able to effectively promote GTI. Firms may need sufficient incentives or penalties to increase their willingness to engage in green innovation [41]. This reiterates the important role played by government regulations. Further, find that there is an indirect ‘rebound effect’ of green technological innovation: as the green innovation improves, both the output and energy consumption levels increase [42]. As previously indicated, GTI might affect carbon emissions in an indirect and unpredictable way [43]. These environmental regulations help to address the adverse externalities of environmental deterioration, which might support the efficacy of technological innovation and serve as justification for regulatory action.
2.4 Cost-benefit considerations in green technology adoption
Economic wise, concerning green technologies upfront investment poses challenges to nations with limited resources where lower pollution, energy savings, and job creation usually outweigh the drawbacks. Socioeconomic and environmental circumstances often improve in countries that prioritize green investments [44]. More solar energy being produced is good for the state, even though the state gets a low return on it investment in building solar power plants. Using economic and math models, they created a simple relationship that helps predict how much tax money will come in from building solar plants and how electricity prices might change. This supports the idea that investing in solar power is a good economic choice [45].
This is not the case in Central Asia, where context-specific economic evaluations are still scarce, and this study uses econometric analysis to try to close that gap. Former researchers use B/C, breakeven period, and net present value to assess green plant projects. After analyzing 33 LEED-certified green buildings, Kats finds that the overall financial benefits outweigh the initial investment by a factor of 10. Green buildings are economical and make financial sense because energy savings outweigh additional expenses [46]. Through case research, Li and Tian develop an incremental cost-benefit model for green buildings that reveals comprehensive benefits and economic viability.
Based on the review from the literature, which shows that there is a significant and positive reduction of ESI and greenhouse gas released into the environment by renewable energy in line with goals of change in climate [37-39]. In the same vein, evidence on econometrics is in agreement that investment in green technology (GTI), share of renewable energy (RES) and patent activity are highly related to minimized CO2 release and improved sustainability results. On another note, some research identifies the existence of association between sustainability and renewable energy as not always positive. Previous research work identifies effects of rebound effects, partially setting off environmental gain [11, 16]. In economy like Kazakhstan which are dependent on resources, adoption of renewable energy exists side by side with continuing dependence on fossil fuels, resulting to constant CO2 emissions even with green initiatives [12-14]. The findings show that differences in region, inconsistencies in policy and economic structures can affect renewable technologies effectiveness.
Given these mixed findings, it is necessary to evaluate the impact of renewable energy adoption and green technology using a systematic econometric framework from multiple indicators such as green technology investment, patent generation, renewable energy share, and environmental outcomes (ESI and CO2 emissions), this study seeks to clarify whether the observed positive effects are consistent across diverse economic contexts such as Ukraine, Kazakhstan, and Austria as they provide balanced representation at different stages of the green transition.
From the literature, the study observed that much of previous research is either on environmental benefits of green technologies or on economic feasibility and intends to fill this gap by employing the econometric modelling that takes into consideration both environmental and economic factors to improve sustainable development. Moreover, the panel data econometrics employed by the study provides robust cause effect relationship between the variables of interest, unlike the cross-sectional and time-series data observed in extant literatures.
3.1 Research design
This study adopts a quantitative approach of research by employing econometric modeling. The focus is to analyze the relationship between green technology adoption and sustainable natural resources. This modeling approach aids in observing the relationship between dependent and independent variables in the structural framework.
3.2 Data collection procedure
Secondary data was collected from reputable international databases, like World Development Indicators, Yale ESI database, OECD Green Investment Reports. The data scope includes panel data from 2014 to 2023 from several nations, with Kazakhstan as the primary case study. This data will help to assess both the short-term and long-term consequences of green technology. Finally, the dataset was transformed to meet econometric assumptions, and variables were standardized to ensure comparability across countries and years before analyzing the data.
3.3 Econometric modeling description
The model employed for the study includes the dependent variables, the independent variables, and the control variables. These variables are explained as follows:
Dependent Variables: Natural resources sustainability is measured by indicators like ESI, pollution levels (CO2 emissions per capita) [34].
Independent Variables: Green technology adoption is measured by metrics such as renewable energy share [11], green technology investment (in USD), or patent counts.
Control Variables: Gross Domestic Product (GDP per capita), population density, and education levels.
Green Technology Metrics
Green technologies are environmentally friendly inventions that encourage resource sustainability. These include innovations in pollution control, waste recycling, energy-efficient systems, and renewable energy sources (such as solar and wind). Indicators like Green Tech Investment (GTI), Patent Count (PC), and Renewable Energy Share (RES) are used in this study to gauge the adoption of green technologies.
Sustainability Metrics:
The study measured sustainability using two key indicators: the ESI and CO2 emissions per capita.
ESI refers to a nation's environmental stewardship, including ecosystem vitality and environmental health. This is assessed using the ESI, a composite score ranging from 0 to 100.
CO2 emissions per capita, measured in metric tons, serve as an indicator for pollution and environmental deterioration, with lower numbers signifying improved sustainability performance.
3.3.1 Econometric model
Two panel regression models were developed to track the economic impacts of green technologies on natural resources using the panel data from multiple countries within specific years [35]. These models were robust and can take into consideration unnoticed variation in cross-sectional and time series data [36]. To answer the research questions, the panel regression models were structured as;
$\begin{aligned} E S I_{i t}=\beta_0+\beta_1( & \left.G T I_{i t}\right)+\beta_2\left(P C_{i t}\right)+\beta_3\left(R E S_{i t}\right)+\beta_4\left(G D P_{i t}\right)+\beta_5\left(P D_{i t}\right)+\beta_6\left(E L_{i t}\right)+\alpha_i+\gamma_t +\varepsilon_{i t}\end{aligned}$ (1)
$\begin{aligned} C O_{2 i t}=\beta_0+\beta_1( & \left.G T I_{i t}\right)+\beta_2\left(P C_{i t}\right)+\beta_3\left(R E S_{i t}\right)+\beta_4\left(G D P_{i t}\right)+\beta_5\left(P D_{i t}\right)+\beta_6\left(E L_{i t}\right)+\alpha_i+\gamma_t +\varepsilon_{i t}\end{aligned}$ (2)
where,
i = Country
t = year
$\alpha_i$ = Country-specific fixed effect, controlling for time
$\gamma_t$ = Time-specific fixed effect, controlling for year
$\varepsilon_{i t}$ = Error term
The model structure directly answers the research question by showing the direct effect of using green technologies (independent variable) on sustainability results (dependent variable). The coefficient $\beta_{1}$ shows the amount that sustainability changes for every unit change in the uptake of green technology, as calculated using Eq. (1). Furthermore, using Eq. (2) shows the effects of each different green technology (independent variables) on CO2 Emissions per capita (dependent variable). The estimated coefficients $\beta_{1,2}$ measure the marginal effect of each green technology category (renewable energy share, green technology investment) on CO2 emissions per capita. The significance level comparison of coefficients $\beta_{1,2}$ through the model will show the technology category with the strongest or weakest influence.
Furthermore, fixed effects model was employed by the study to control for unobserved heterogeneities that are constant over time but vary across countries. Additionally, the Hausman test was used to assess the suitability of the panel regression model, which supported the Fixed Effects Model (FEM), suggesting that individual country effects are related to the independent variables ($\chi^2$ = 18.42, p < 0.05).
3.4 Data validity and reliability
To make sure the results were reliable and valid, tests for endogeneity, autocorrelation, heteroskedasticity, and multicollinearity were performed. The study used a robust standard error in cases of heteroskedasticity and a Variance Inflation Factor (VIF) analysis to look for multicollinearity among the variables. The panel data's serial correlation was examined using the Durbin-Watson test. The linearity assumption was used by the model between the independent variable and dependent variable; however, data transformation was applied when the linear assumption was violated.
4.1 Dataset description
This study employs panel data from 10 selected countries: High-income EU nations (Austria, Germany, and France), transitional and resource-dependent nations (Ukraine, Kazakhstan, and Poland), and emerging economies within the BRICS group (China, India, Brazil, and South Africa) are all represented in the list. The time frame of 2014–2023 selected for the study is to ensure that data is available across the selected indicators and ensured that the analysis captures the most recent pre-pandemic and post-pandemic transitions in energy use and environmental sustainability. The geographical scope, time frame, sample, data type, variables, and data source of the dataset are detailed in Table 1. Furthermore, the variables, abbreviations, and their measurement are described in Table 2.
Table 1. Dataset overview
|
Component |
Description |
|
Geographical Scope |
10 countries (including Kazakhstan, other Central Asian nations, BRICS, and selected OECD countries) |
|
Time Frame |
2014–2023 (10 years of annual data) |
|
Number of Observations |
100 (10 countries × 10 years) |
|
Data Type |
Panel data (cross-sectional and time-series) |
|
Dependent Variables |
Environmental Sustainability Index (ESI), CO2 emissions per capita |
|
Independent Variables |
Green technology investment, renewable energy share, patent count |
|
Control Variables |
GDP per capita, population density, education level |
|
Data Sources |
World Development Indicators, Yale ESI database, OECD Green Investment Reports |
Source: Author’s development
Table 2. Variables, metrics, and data source
|
Variables |
Abb. |
Metrics |
Data Source |
|
Environmental Sustainability Index |
ESI |
Composite score (0–100) |
Yale, ESI database |
|
CO2 Emissions per capita |
CO2/capita |
Measured in tons |
WDI |
|
Renewable Energy Share |
RES |
% of total energy consumption |
WDI |
|
Green Tech Investment |
GTI |
Annual investment in (million USD) |
OECD Green Investment Reports |
|
Patent Count |
PC |
Number of patents |
WDI |
|
GDP per Capita |
GDP |
Current (USD) |
WDI |
|
Population Density |
PD |
People per km2 |
WDI |
|
Educational Level |
EL |
(0–1 scale) |
WDI |
Note: WDI = World Development Indicators, Education level used ranges from 0 to 1, consistent with the WDI and UNDP Human Development Index framework. The education variable was normalized on a scale from 0 to 1 using the UNDP Human Development Index method, leveraging data from the World Development Indicators. Mean years of schooling and expected years of schooling were adjusted to ensure comparability across countries, with 0 indicating the lowest educational attainment and 1 the highest.
The characteristics of the data set is detailed in Table 1 including the geographical scope, time frame, sample, data type, variables, and data source.
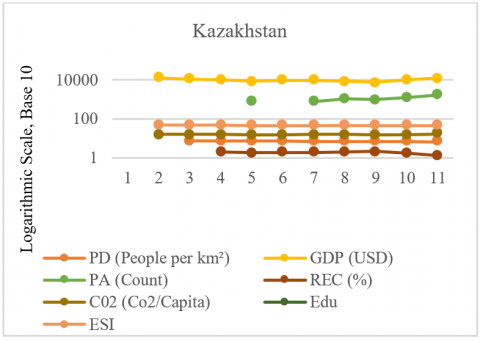
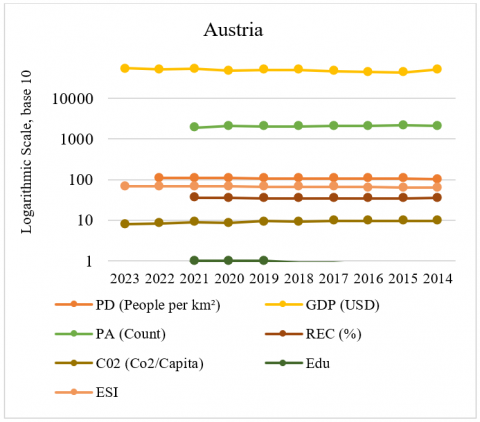
Variable names, their metrics, and data sources used for this study are shown and detailed in Table 2. Furthermore, the time variation of ESI, CO2 Emissions (CO2), renewable energy share (RES), green tech investment (GTI), gross domestic product (GDP), Patent Count (PC), Population Density (PD), and education index (EI) for Kazakhstan and Austria during the 2014–2023 period is shown in Figures 1 and 2, respectively.
Figure 1. Green technology innovation and sustainability indices for Kazakhstan
Note: The y-axis is presented on a logarithmic scale to facilitate comparison among variables with different magnitudes.
Source: Author’s development
Figure 2. Green technology innovation and sustainability indices for Austria
Note: The y-axis is presented on a logarithmic scale to facilitate comparison among variables with different magnitudes.
Source: Author’s development
Kazakhstan's environmental sustainability indices indicate steady GDP, rising patent count, changing renewable energy share, stable CO2 emissions per capita, consistent population density, and minor upward trend in ESI (see Figure 1). However, inconsistency in renewable energy usage and CO2 emissions which may hinder growth. Future advancements in data quality and renewable energy policy may expedite sustainability outcomes.
Austria's environmental sustainability indices show strong and stable GDP, consistent investment in innovation, and increased renewable energy use, all of which contribute to gradually improving environmental sustainability (ESI) (see Figure 2). Austria continues to decline in CO2 emissions, demonstrating its commitment to the green transition targets. The results support Austria's position as a model of balanced growth and sustainability.
4.1.1 Ukraine case insight
Ukraine’s green transformation occurs in the context of varying sustainability profiles in other countries like Kazakhstan and Austria. Ukraine outperforms Kazakhstan in both ESI and CO2 efficiency, reflecting stronger environmental policy engagement and the effects of EU-aligned reforms. However, it lags behind Austria, a mature EU member with deep integration of renewables and long-standing sustainability frameworks. Ukraine’s RES share has potential for growth, especially under the “Green Energy Transition until 2050” strategy.
4.2 Econometric results
Econometric modelling was employed in this study. All results are a generalization of the model developed in Eqs. (1)-(3).
4.2.1 Impact of green technology adoption on Environmental Sustainability Index (ESI)
The impact of green technology adoption on the sustainability of natural resources indicator of the ESI was estimated using the panel regression model structured (see Eq. (1)). Where, i indicates country (i = 1,..., N), and t indicates year (t = 2014,..., 2023). The regression results are hereby presented in Tables 3 and 4.
Table 3. Regression results of the impact of green technology on ESI
|
Variable |
Coefficient ($\beta$) |
Std. Error |
P-Value |
Significance |
|
GTI |
0.012 |
0.004 |
0.002 |
** (significant) |
|
PC |
0.085 |
0.029 |
0.005 |
** (significant) |
|
RES |
0.174 |
0.062 |
0.007 |
** (significant) |
|
GDP |
0.000 |
0.000 |
0.019 |
* (significant) |
|
PD |
-0.013 |
0.007 |
0.065 |
(marginal) |
|
EL |
5.248 |
1.365 |
0.000 |
*** (highly significant) |
|
Constant |
33.570 |
4.829 |
0.000 |
*** |
Source: Author’s development
The regression results in Table 3 show green technology's influence on the ESI while controlling for other factors like population density, GDP per Capita, and education level. Results show that green tech investment ($\beta=$ 0.012), patent count ($\beta=$ 0.085), and renewable energy share ($\beta=$ 0.174) all show positive relationships with ESI. The results implies that a \$1 million increase in green technologies, additional green technology patent filed, and 1 percentage point increase in the share of renewable energy in a country’s total energy consumption, leads to a 0.085, 0.012, and 0.174 unit increase in the ESI respectively, provided all other variable remain constant. Also, the relationship between green tech investment, patent count, renewable energy share, and ESI is statistically significant (p > 0.05). GDP per capita positively impacts sustainability. However, education level as a control variable shows a higher statistically significant relationship with ESI.
Table 4. Regression model fit
|
N |
R2 Adjusted |
R2 |
F-Value |
P- Value |
Durbin-Watson |
VIF |
|
100 |
0.72 |
0.67 |
14.89 |
0.00 |
1.92 |
3.1 |
Source: Author’s development
The regression model fit in Table 4 shows that green technology accounted for 0.67, representing a 67% variation observed in the ESI, the remaining 33% will be accounted for by other factors outside the model. The result also shows that the regression model is statistically significant (F (8, 100) = 14.89, p < 0.05), indicating that green technology significantly affects the ESI. Furthermore, to assess multicollinearity, the Variance Inflation Factor (VIF) was calculated, revealing an average of 3.1, which is acceptable as it is below the threshold of 5. For autocorrelation, The Durbin–Watson (DW) statistic ranges from 0 to 4, with values close to 2 indicating no first-order autocorrelation, values below 2 suggesting positive autocorrelation, and values above 2 suggesting negative autocorrelation. Therefore, DW had a value of 1.92, which is close to 2, indicating no significant auto-correlation issues in the models.
4.2.2 Impact of green technology adoption on CO2 emission
The impact of green technology adoption on the pollution levels using CO2 emission is estimated using the panel regression model structured (see Eq. (2)). Where, i indicates country (i = 1,..., N), and t indicates year (t = 2014,..., 2023). The regression results are hereby presented in Tables 5 and 6.
The regression results in Table 5 show green technology's influence on the ESI while controlling for other factors like population density, GDP per Capita, and education level. Results show that green tech investment ($\beta=$ 0.009), patent count ($\beta=$ 0.064), and renewable energy share ($\beta=$ -0.217), all show negative relationships with CO2 emission per capita. This result implies that a \$1 million increase in green tech investment, increased patent count, and 1 percentage point increase in the share of renewable energy in a country, will leads to a 0.009, 0.064, and 0.217 unit decrease in the CO2 emission per capital, provided all variables remain constant. Consequently, a contry's investment in green infrastrcuture, eco-frriendly innovations, and renewable source of energy will significantly lower carbon emissions which meaningfully reduce environmental pollution. Results also indicates that there is a negative influence of green technology adoption on CO2, but statistically significant (p > 0.05), indicating that increased funding and innovation in green technologies are essential strategies for low-carbon solutions. More so, GDP per capita and population density are positively associated with CO2 emissions, though the GDP impact is small, implying that unless the use of fossil fuels is separated from economic growth, nations may use more energy as their wealth increases. Educational level shows a significant association with ESI, indicating that higher educational attainment will lead to decreased CO2 emissions.
Table 5. Regression results of the impact of green technology on CO2
|
Variable |
Coefficient ($\beta$) |
Std. Error |
P-Value |
Significance |
|
GTI |
-0.009 |
0.004 |
0.028 |
* (significant) |
|
PC |
-0.064 |
0.021 |
0.004 |
** (significant) |
|
RES |
-0.217 |
0.066 |
0.001 |
*** (highly significant) |
|
GDP |
0.000 |
0.000 |
0.016 |
* (significant) |
|
PD |
0.011 |
0.005 |
0.041 |
* (significant) |
|
EL |
-3.284 |
1.213 |
0.008 |
** (significant) |
|
Constant |
18.376 |
3.022 |
0.000 |
*** (highly significant) |
Source: Author’s development
Table 6. Regression model fit
|
N |
R2 Adjusted |
R2 |
P-Value |
Durbin-Watson |
VIF |
|
100 |
0.74 |
0.71 |
0.00 |
2.01 |
2.85 |
Source: Author’s development
The regression model fit in Table 6 shows that green technology accounted for 0.713, representing a 71% variation observed in the CO2 emissions per capita, the remaining 21% will be accounted for by other factors outside the model. This indicate that the model is robust enough to capture factors influencing CO2 emissions. The result also shows that the regression model is statistically significant (p < 0.05), indicating that green technology significantly affects CO2 emissions. Furthermore, the Durbin-Watson test has a value of 2.01, indicating no autocorrelation among variables, and a variance inflation factor (VIF) value of 2.85, indicating no multicollinearity among variables. The Durbin value implies that the model's estimates are not biased, while multicollinearity value indicates no auto correlation of the factors.
4.2.3 Impacts of RES, GTI, and PCs on ESI and CO2 emission
The influence of categories of green technologies (renewable energy share, green technology investment, and patent counts) on the sustainability of natural resources (ESI and CO2 emission) was estimated using the panel regression model structured in Eq. (1) and Eq. (2), respectively. Their impacts are therefore presented in Table 7.
Table 7. Regression analysis of green technology innovations on sustainable natural resources
|
Variable |
CO2 per Capita ($\beta$) |
P-Value |
ESI ($\beta$) |
P-Value |
|
GTI |
-0.009 |
0.028 |
0.012 |
0.002 |
|
PC |
-0.064 |
0.004 |
0.085 |
0.005 |
|
RES |
-0.217 |
0.001 |
0.174 |
0.007 |
|
GDP |
0.000 |
0.016 |
0.000 |
0.019 |
|
PD |
0.011 |
0.041 |
-0.013 |
0.065 |
|
EL |
-3.284 |
0.008 |
5.248 |
0.000 |
|
Constant |
18.376 |
0.000 |
33.57 |
0.000 |
Source: Author’s development
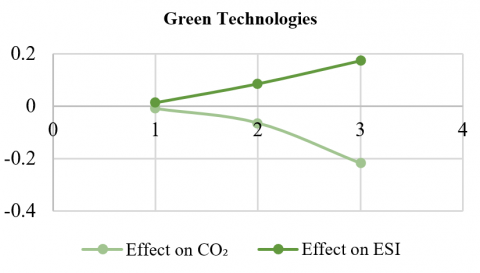
Regression results in Table 7 show the impacts of each category of green technology on the ESI and pollution level (CO2) while controlling for other factors like population density, GDP per Capita, and education level. Results show that green tech investment ($\beta=$ 0.009), patent count ($\beta=$ 0.064), and renewable energy share ($\beta=$ -0.217), all have negative effect on CO2 per capita, indicating that each additional USD 1 million investment reduces 0.009 tons of CO2 emissions per capita, each additional patent in green technology corresponds to a decrease of 0.064 tons of CO2 emissions per capita, and each 1% increase in renewables’ share of total energy consumption causes reduction of 0.217 tons of CO2 emissions per capita. Also, the effect of green tech investment (p = 0.028), patent count (p = 0.004), and renewable energy share (p = 0.004) on CO2 is statistically significant (p > 0.05), indicating that greater adoption and innovation in green technologies are effective mechanisms for reducing carbon emissions. On the other hand, green tech investment ($\beta=$ 0.012), patent count ($\beta=$ 0.085), and renewable energy share ($\beta=$ 0.174) all have positive effects on ESI with other factors kept constant, indicating GTI, PC, and RES positively improve sustainability and that the effect is not due to other factors. It also suggests that investment in green infrastructure reduces environmental harm and enhance the ecological performance of a country or region. Also, the impacts of green tech investment (p = 0.002), patent count (p = 0.005), renewable energy share (p = 0.007), on ESI is statistically significant (p > 0.05). Furthermore, a scattered plot was used to compare the impacts on various green technologies on sustainable natural resource measured by ESI and CO2 as shown in Figure 3.
Positive ESI coefficients indicate an increase in sustainability index while negative CO2 coefficients indicate a reduction in CO2 emissions (Figure 3).
Figure 3. Scatter plot of the impacts of GTI, RES, and PC on ESI and CO2
4.2.4 Economic costs, benefits and impacts on sustainability
To assess the economic cost, benefits of implementing green technologies and how they influence overall sustainability, the ESI model only was used to measure sustainability, GTI was used as metric for the economic cost, while PC and GDP are used as metrics for economic benefits. Therefore, the panel regression model is structured is given as Eq. (3), and the results is presented in Table 8.
$\begin{aligned} \text { Sustainability }_{i t} & =\beta_0+\beta_1\left(G T I_{i t}\right)+\beta_2\left(P C_{i t}+\right)+\beta_3\left(G D P_{i t}\right)+\beta_4\left(P D_{i t}\right)+\beta_5\left(E L_{i t}\right)+\alpha_i+\gamma_t+\varepsilon_{i t}\end{aligned}$ (3)
For the model,
Sustainabilityit = Environmental Sustainability Index (ESI)
GTIit = Green technology investment as economic cost
PCit = Patent count as economic benefits
GDPit = gross domestic product as economic benefits
Controlit = Population density, and education levels
$\alpha_i$ = Country-effect
$\gamma_t$= Time-effect, controlling for year
$\varepsilon_{i t}$ = Error term
Table 8. Regression analysis of the green technology economic cost and benefits
|
Variable |
ESI Model Coefficient ($\beta$) |
Std. Error |
P-Value |
Interpretation |
|
GTI (cost) |
0.012 |
0.004 |
0.002 |
Significant |
|
PC (benefit) |
0.085 |
0.029 |
0.005 |
Significant |
|
GDP (benefit) |
0.000 |
0.000 |
0.019 |
Significant |
|
R-Squared |
0.723 |
|
|
|
GTI has shown to be positively associated with environmental sustainability. When used in the model as economic cost it enhances sustainability outcomes. It also shows a positive and statistically significant coefficient (p < 0.05) revealing that an increased investment in green technology improve sustainability that is it generates a return in the form of improved environmental outcomes when used as an economic cost. Also, PC, when used as economic benefit, shows a positive and statistically significant influence on sustainability (p < 0.05) indicating that greater innovation as observed by the number of patents contributes to sustainability. In other words, more patents lead to stronger innovation ecosystems that foster more effective and green technology when PC is used as economic benefits. Furthermore, GDP per capital was used inform of economic benefits, it shows a positive and statistically significant influence on sustainability (p < 0.05) indicating that income per person is positively associated with better sustainable outcomes. This also confirms hat wealthier nations or regions often have more resources or capacity to invest in sustainable infrastructure.
This study assesses the influence of green technologies on natural resources across selected countries with ESI and CO2 emissions per capita as metrics for sustainability. The outcome of the study depicts green technology investment (GTI), patent count (PC), and renewable energy share (RES) are positively and significantly associated with ESI, while exhibiting negative and significant relationships with CO2 emissions. This implies that scaling up eco-friendly infrastructure, clean energy adoption, and innovation ecosystems enhances environmental performance and reduces pollution [5, 6, 26].
The positive associations with ESI highlight how increased investment, innovation, and renewable energy adoption contribute to improved ecological resilience. Conversely, the negative coefficients with CO2 confirm that these measures are effective levers for decarbonization and pollution reduction. This finding is consistent with global literature emphasizing the role of green innovation in climate mitigation strategies [26, 37]. In contrast, GDP per capita and population density are positively related to CO2 emissions, reflecting the environmental pressures of higher output and urbanization [11]. This underscores the need to replace fossil fuels with cleaner alternatives to decouple economic growth from ecological degradation.
Country-level evidence reinforces these results. For instance, Ukraine’s “Green Energy Transition until 2050,” waste management reforms, and SAEE incentives illustrate how targeted policies in GTI and RES can reduce emissions while supporting resilient reconstruction. Similarly, Austria demonstrates how a mature green economy, characterized by high GDP, innovation output, renewable share, and stable CO2 reductions, outperforms transitional economies like Kazakhstan. Despite progress in patents and renewables, Kazakhstan continues to face high emissions due to its fossil fuel dependency [47]. This suggests that sustained investment in green R&D, renewable integration, and innovation incentives is crucial for middle-income economies.
The positive relationship between GTI (as an economic cost) and ESI suggests that environmental spending yields long-term ecological and economic returns. Likewise, the influence of PC reflects the importance of innovation capacity, supported by intellectual property policies and research funding. Although GDP per capita shows only a small positive effect on ESI, it indicates that higher income levels may facilitate access to clean technologies and sustainability awareness [48, 49].
Broader analysis confirms that, even after controlling for population, income, and education, green technology variables (GTI, PC, RES) significantly reduce pollution and improve sustainability. Education’s positive correlation with ESI further suggests that capacity building and sustainability-focused curricula amplify these benefits. For Kazakhstan, achieving its “Green Economy Concept” and carbon neutrality by 2060 requires innovation hubs, decentralized energy planning, and stronger public–private partnerships.
Finally, the study’s reliance on secondary data and panel modeling introduces limitations. Institutional quality, policy frameworks, and potential reverse causality between GDP and sustainability were not fully captured. Future research should employ primary data and advanced methods such as structural equation modeling (SEM) to address these gaps.
This study shows that green technology investment (GTI), patent count (PC), and renewable energy share (RES) significantly improve environmental outcomes by increasing the ESI and reducing CO2 emissions. The findings confirm that green technology adoption not only supports ecological resilience but also delivers economic benefits. Policy measures should therefore prioritize funding and incentives for renewable energy and green R&D, enforce emission controls in high-demand regions, and encourage businesses to adopt clean technologies. Ukraine’s ongoing green transformation illustrates how decentralized energy systems and innovation-driven strategies can guide sustainable development.
[1] Sadiq, M., Ngo, T.Q., Pantamee, A.A., Khudoykulov, K., Thi Ngan, T., Tan, L.P. (2022). The role of environmental social and governance in achieving sustainable development goals: Evidence from ASEAN countries. Economic Research-Ekonomska Istraživanja, 36(1): 170-190. https://doi.org/10.1080/1331677x.2022.2072357
[2] Pavlovskyi, M. (2023). The improvement of fuel efficiency and environmental characteristics of diesel engine by using biodiesel fuels. In Studies in Systems, Decision and Control. Springer Nature Switzerland, pp. 35-69. https://doi.org/10.1007/978-3-031-44351-0_4
[3] Ferraz, R. (2023). Testing the sustainability of fiscal policy during the Portuguese First Republic using stationary and cointegration tests. Economies, 11(11): 267. https://doi.org/10.3390/economies11110267
[4] Veretennikova, A.Y., Selezneva, D.A. (2023). Development of regulatory strategies in the sharing economy: The application of game theory. Economies, 11(12): 298. https://doi.org/10.3390/economies11120298
[5] Atynian, A., Bukhanova, K., Tkachenko, R., Manuilenko, V., Borodin, D. (2019). Energy efficient building materials with vermiculite filler. International Journal of Engineering Research in Africa, 43: 20-24. https://www.scientific.net/JERA.43.20.
[6] Gagan Deep. (2023). Exploring the role and impact of green technology in building a sustainable future. International Journal of Science and Technology Research Archive, 5(2): 128-133. https://doi.org/10.53771/ijstra.2023.5.2.0098
[7] Bernykov, V., Bilousko, T., Bilousko, R., Pitel, N., Starovoyit, V. (2025). Green technologies and their contribution to a sustainable global economy in 2020-2025: A literature review. Futurity Economics & Law, 5(1): 161-178. https://doi.org/10.57125/fel.2025.03.25.09
[8] Makki, M.R., Kadhim, R.N. (2023). Analysis of the effects of green technology on economic growth in the environment of the Iraqi economy. Studies of Applied Economics, 41(3). https://doi.org/10.25115/sae.v41i3.6990
[9] Mhlanga, D. (2021). Artificial intelligence in the Industry 4.0, and its impact on poverty, innovation, infrastructure development, and the sustainable development goals: Lessons from emerging economies? Sustainability, 13(11): 5788. https://doi.org/10.3390/su13115788
[10] United Nations Development Program. (2020). Sustainable Development Goals. https://www.undp.org/content/undp/en/home/sustainable-development-goals.html.
[11] Tazhibekova, K., Shametova, A. (2024). Ecological initiatives and their influence on the competitiveness and sustainability of companies: "Green" strategies of SMEs. Journal of the Knowledge Economy, 16(1): 1623-1645. https://doi.org/10.1007/s13132-024-02062-0
[12] Lutsenko, S., Hryhoriev, Y., Kuttybayev, A., Imashev, A., Kuttybayeva, A. (2023). Determination of mining system parameters at a concentration of mining operations. Series of Geology and Technical Sciences, 1(457): 130-140. https://doi.org/10.32014/2023.2518-170x.264
[13] Hryhoriev, Y., Lutsenko, S., Shvets, Y., Kuttybayev, A., Mukhamedyarova, N. (2024). Predictive calculation of blasting quality as a tool for estimation of production cost and investment attractiveness of a mineral deposit development. IOP Conference Series: Earth and Environmental Science, 1415(1): 012027. https://doi.org/10.1088/1755-1315/1415/1/012027
[14] da Silva, B.A., Constantino, M., de Moraes, P.M., Herrera, G.P., de Oliveira, O.S., dos Santos, S.A.L., Kulevicz, R.A., Porfírio, G., da Costa, R.B. (2021). Econometric analysis of IPAT-e: A new tool for the environmental impact assessment of publicly traded companies. Environmental Impact Assessment Review, 89: 106586. https://doi.org/10.1016/j.eiar.2021.106586
[15] Chen, K., Shao, Y.J., Liu, Z.F., Zhang, J.K., Li, Y.S., Zhang, Y.C., Zhan, Y.D. (2024). Origin and evolution of a porphyry-skarn-stratabound system: Constraints from geology, magmatic-hydrothermal zircon U-Pb and molybdenite Re-Os geochronology, and in situ S isotopes of the Dongguashan Cu(-Au) deposit, eastern China. Gondwana Research, 132: 32-52. https://doi.org/10.1016/j.gr.2024.04.005
[16] Ksonzhyk, I., Lavrushchenko, Y., Marcin, O., Saienko, V., Zoriana, B. (2021). Influence of renewable "green" energy on the economic development of the EU states. Environment and Ecology Research, 9(5): 271-281. https://doi.org/10.13189/eer.2021.090507
[17] Radelyuk, I., Klemeš, J.J., Tussupova, K. (2023). Sustainable water use in industry—Reasons, challenges, response of Kazakhstan. Circular Economy and Sustainability, 3(4): 2267-2283. https://doi.org/10.1007/s43615-023-00269-y
[18] Halog, A., Anieke, S. (2021). A review of circular economy studies in developed countries and its potential adoption in developing countries. Circular Economy and Sustainability, 1(1): 209-230. https://doi.org/10.1007/s43615-021-00017-0
[19] Yurko, I., Riabtsev, D. (2024). The role of investment, innovation and efficient use of resources in ensuring long-term economic sustainability. Law, Business and Sustainability Herald, 4(1): 4-20. https://lbsherald.org/index.php/journal/article/view/62.
[20] Alreahi, M., Bujdosó, Z., Kabil, M., Akaak, A., Benkó, K.F., Setioningtyas, W.P., Dávid, L.D. (2022). Green human resources management in the hotel industry: A systematic review. Sustainability, 15(1): 99. https://doi.org/10.3390/su15010099
[21] Du, X., Zhang, H., Han, Y. (2022). How does new infrastructure investment affect economic growth quality? Empirical evidence from China. Sustainability, 14(6): 3511. https://doi.org/10.3390/su14063511
[22] Yacob, P., Peter, D. (2022). Perceived benefits of sustainable digital technologies adoption in manufacturing SMEs. International Journal of Innovation and Technology Management, 19(4). https://doi.org/10.1142/s0219877022500122
[23] Yuen, K.F., Cai, L., Qi, G., Wang, X. (2020). Factors influencing autonomous vehicle adoption: An application of the technology acceptance model and innovation diffusion theory. Technology Analysis & Strategic Management, 33(5): 505-519. https://doi.org/10.1080/09537325.2020.1826423
[24] He, M., Lee, J. (2020). Social culture and innovation diffusion: A theoretically founded agent-based model. Journal of Evolutionary Economics, 30(4): 1109-1149. https://doi.org/10.1007/s00191-020-00665-9
[25] Mansoor, M. (2021). Citizens' trust in government as a function of good governance and government agency's provision of quality information on social media during COVID-19. Government Information Quarterly, 38(4): 101597. https://doi.org/10.1016/j.giq.2021.101597
[26] DLF Attorneys-at-Law. (2024). National Renewable Energy Action Plan for Ukraine 2024-2030. DLF.UA. https://dlf.ua.
[27] Ministry of Digital Transformation of Ukraine. (2024). WINWIN GreenTech: Technologies for Energy Independence and Green Development. https://digitalstate.gov.ua.
[28] Kruesi, M.A., Bazelmans, L. (2022). Resources, capabilities and competencies: A review of empirical hospitality and tourism research founded on the resource-based view of the firm. Journal of Hospitality and Tourism Insights, 6(2): 549-574. https://doi.org/10.1108/jhti-10-2021-0270
[29] Collins, C.J. (2020). Expanding the resource based view model of strategic human resource management. The International Journal of Human Resource Management, 32(2): 331-358. https://doi.org/10.1080/09585192.2019.1711442
[30] Khanra, S., Kaur, P., Joseph, R.P., Malik, A., Dhir, A. (2021). A resourcebased view of green innovation as a strategic firm resource: Present status and future directions. Business Strategy and the Environment, 31(4): 1395-1413. https://doi.org/10.1002/bse.2961
[31] Cheng, C., Ren, X., Dong, K., Dong, X., Wang, Z. (2021). How does technological innovation mitigate CO2 emissions in OECD countries? Heterogeneous analysis using panel quantile regression. Journal of Environmental Management, 280: 111818. https://doi.org/10.1016/j.jenvman.2020.111818
[32] Tryboi, O. (2025). Transition of Ukraine towards sustainable energy. Renewable Energy Agency, NGO (Ukraine). https://rea.org.ua/en/news/504/.
[33] Ukrainian Climate Office. (2025). State Agency for Energy Efficiency (SAEE). https://saee.gov.ua/en.
[34] Hart, S.L., Dowell, G. (2010). Invited editorial: A natural-resource-based view of the firm. Journal of Management, 37(5): 1464-1479. https://doi.org/10.1177/0149206310390219
[35] Ganda, F. (2019). The impact of innovation and technology investments on carbon emissions in selected organisation for economic Co-operation and development countries. Journal of Cleaner Production, 217: 469-483. https://doi.org/10.1016/j.jclepro.2019.01.235
[36] Shao, X., Zhong, Y., Liu, W., Li, R.Y.M. (2021). Modeling the effect of green technology innovation and renewable energy on carbon neutrality in N-11 countries? Evidence from advance panel estimations. Journal of Environmental Management, 296: 113189. https://doi.org/10.1016/j.jenvman.2021.113189
[37] Shahbaz, M., Raghutla, C., Song, M., Zameer, H., Jiao, Z. (2020). Public-private partnerships investment in energy as new determinant of CO2 emissions: The role of technological innovations in China. Energy Economics, 86: 104664. https://doi.org/10.1016/j.eneco.2020.104664
[38] Rennings, K., Rammer, C. (2011). The impact of regulation-driven environmental innovation on innovation success and firm performance. Industry and Innovation, 18(3): 255-283. https://doi.org/10.1080/13662716.2011.561027
[39] Mongo, M., Belaïd, F., Ramdani, B. (2021). The effects of environmental innovations on CO2 emissions: Empirical evidence from Europe. Environmental Science & Policy, 118: 1-9. https://doi.org/10.1016/j.envsci.2020.12.004
[40] Lin, B., Ma, R. (2022). Green technology innovations, urban innovation environment and CO2 emission reduction in China: Fresh evidence from a partially linear functional-coefficient panel model. Technological Forecasting and Social Change, 176: 121434. https://doi.org/10.1016/j.techfore.2021.121434
[41] Zakari, A., Khan, I., Alvarado, R., Missaoui, I. (2024). The impact of renewable energy rebates on environmental sustainability in Australia. Australasian Journal of Environmental Management, 31(1): 108-125. https://doi.org/10.1080/14486563.2024.2326090
[42] Arabov, N., Nasimov, D., Abduramanov, X., Utemuratova, G., Lutfullo, I. (2024). Addressing the economic impacts of climate change in Uzbekistan: Challenges and strategies. E3S Web of Conferences, 542: 04006. https://doi.org/10.1051/e3sconf/202454204006
[43] Dubey, R., Gunasekaran, A., Childe, S.J., Blome, C., Papadopoulos, T. (2019). Big data and predictive analytics and manufacturing performance: Integrating institutional theory, resourcebased view and big data culture. British Journal of Management, 30(2): 341-361. https://doi.org/10.1111/1467-8551.12355
[44] Block, S., Emerson, J.W., Esty, D.C., de Sherbinin, A., et al. (2024). 2024 Environmental Performance Index. Yale Center for Environmental Law & Policy. https://epi.yale.edu.
[45] Susetyoko, R., Satriyanto, E., Fadliana, A., Humaira, F.M. (2023). Panel data regression model for predicting economic growth before and during the COVID-19 pandemic in East Java Province. Barekeng: Jurnal Ilmu Matematika dan Terapan, 17(4): 2121-2134. https://doi.org/10.30598/barekengvol17iss4pp2121-2134
[46] Akram Naseem, M., Xiaoming, S., Riaz, S., Ur Rehman, R. (2017). Board attributes and financial performance: The evidence from an emerging economy. The Journal of Developing Areas, 51(3): 281-297. https://doi.org/10.1353/jda.2017.0073
[47] Omri, A. (2020). Technological innovation and sustainable development: Does the stage of development matter? Environmental Impact Assessment Review, 83: 106398. https://doi.org/10.1016/j.eiar.2020.106398
[48] Human capital, marketization, and innovation: Evidence from China. (2020). Journal of Administrative and Business Studies, 6(6). https://doi.org/10.20474/jabs-6.6.4
[49] Renwick, D.W., Jabbour, C.J.C., Muller-Camen, M., Redman, T., Wilkinson, A. (2016). Contemporary developments in green (environmental) HRM scholarship. The International Journal of Human Resource Management, 27: 114-128. https://shura.shu.ac.uk/12905/1/Renwick%20%20Contemporary%20developments%20in%20Green%20%28Accepted%29.pdf.