Mimi Arifin*![]() | Ihsan
| Ihsan![]() | Isfa Sastrawati
| Isfa Sastrawati![]() | Sri Wahyuni
| Sri Wahyuni![]() | Andi Bukti Djufrie
| Andi Bukti Djufrie![]() | Haidil Adha
| Haidil Adha![]() | Muhammad Amri
| Muhammad Amri![]()
© 2025 The authors. This article is published by IIETA and is licensed under the CC BY 4.0 license (http://creativecommons.org/licenses/by/4.0/).
OPEN ACCESS
Tuberculosis (TB) remains a persistent global health challenge and is currently the 13th leading cause of death worldwide. Indonesia ranks third globally in TB burden, with Makassar City being one of the urban centers experiencing a concerning rise in TB incidence. This study aims to investigate the influence of socioeconomic factors on the spread of TB in Makassar City using 2022 data. A mixed-methods approach was employed, combining qualitative insights and quantitative analysis through descriptive statistics and multinomial logistic regression. Data were gathered through observations, structured interviews, questionnaires, document reviews, and literature analysis. The findings reveal that several socioeconomic factors are significantly associated with the increase in TB cases. Six key indicators—education level, family history of TB, residential density, home improvement assistance, employment sector, and household income—were found to have a statistically significant relationship with TB transmission. Other factors, such as age, gender, and access to health services, showed some association but lacked statistical significance. These results suggest that socioeconomic vulnerability continues to be a major driver of TB in urban Indonesia. Addressing these underlying factors through integrated health, housing, and social policies is essential to reducing TB incidence. This study offers practical insights for strengthening TB control programs in rapidly urbanizing environments like Makassar.
tuberculosis, socio-economic, health, regression, Makassar City
Tuberculosis, or TB, is a disease that has a very high transmission rate. This disease is caused by bacteria that attack the lungs, bones, joints, brain membranes (TB meningitis), lymph nodes (glandular TB), and heart membranes [1]. Due to the high level of transmission and risk of this disease, TB is the 13th leading cause of death and the 2nd most infectious disease after COVID-19 worldwide. Based on the Global TB Report in 2022, the number of TB cases is highest in the productive age group, especially at the age of 25 to 34 years. TB disease is a serious threat and requires special attention from all parties because it can be a threat to human resource development and will increase mortality rates if not handled properly [2]. In addition, TB disease is one of the main causes of morbidity and mortality in the world [3]. Recent findings also confirm that TB remains a top infectious killer globally, especially in Southeast Asia, where 44% of global TB cases are located [4].
Tuberculosis has a direct impact on economic growth in ASEAN, including Indonesia, with each increase in cases reducing GDP growth significantly. Panel data analysis further reveals that for every increase in TB incidence, GDP can drop by 6.69%, especially in countries like Indonesia [5].
Poverty, low education, and unemployment significantly contribute to the loss of patients from TB treatment in Southeast Asia [6]. These findings are consistent across Southeast Asia, where low socioeconomic status, migration, and substance abuse are major barriers to treatment adherence [6].
In the case of Indonesia itself, economic disparities between provinces, especially poverty, were strong predictors of high TB cases in Indonesia between 2010 to 2013 [7]. The spatial burden of TB is consistently higher in low-income areas, as seen in Magelang City and Papua [8, 9].
Some examples of urban cases in Indonesia, such as Bandar Lampung, show that low socioeconomic position affects the spread of TB through dense housing factors and low education [10]. Another case, namely TB transmission in urban communities in Yogyakarta, is strongly influenced by family history, smoking behavior, and house ventilation conditions [11]. Similar risk factors, especially poor ventilation, humidity, and high occupant density, have also been found to drive TB transmission in the South Sulawesi islands [12].
The case in Southeast Sulawesi showed that environmental factors such as ventilation, humidity, and occupancy density significantly increased the risk of TB in communities in Southeast Sulawesi [13]. Climatic variables like temperature, humidity, and rainfall also show a statistical influence on TB spread in the same region [14].
In South Sulawesi, environmental and household risk factors, such as poor ventilation and overcrowding, were found to be major contributors to TB incidence on a small island in South Sulawesi [12].
TB is an epidemic disease in the world, including Indonesia. Indonesia is the 3rd country with the highest TB cases in the world, after India and China. The genetic distribution of Mycobacterium tuberculosis Lineage 4 (L4) shows a dominant regionally specific distribution in Southeast Asia, including Indonesia [9]. These strains are also linked to regional spread routes and host population adaptations in Asia [15].
Similar to other cases around the world, the highest number of TB cases in Indonesia occurs in the productive age group, especially at the age of 45 to 54 years. Based on data from 2020, 67% of TB cases occurred in the productive age and 9% occurred in children [16]. Data on the discovery of new cases in 2023 showed a rate of 74 percent from the previous year. At least 86 percent of drug-sensitive TB and drug-resistant TB cases were successfully treated [17]. Predictive mathematical models (SVIR) suggest that relapse and treatment non-adherence may worsen the spread of TB in Indonesia, with a projected trend that is still slowly declining [18].
One of the major cities in Indonesia that has a high rate of TB disease transmission is Makassar City. Based on data collected from the Makassar City Health Office, TB patients in 2019 reached 5,412 people, with a cure rate of 83%. Then in 2020, the case had decreased to 3,250 people with a cure rate of 85%, and in 2021 it jumped again to 3,911 people [19].
Many factors cause the high rate of TB transmission in Makassar City. In this case, the factors that cause transmission are not only from the physical environment, but social, cultural, and economic conditions are also believed to have an effect on TB transmission. There is a relationship between the incidence of pulmonary TB and age, income level, home environmental conditions, behavior, and history of contact with people with pulmonary TB [20]. Ecological studies also confirm that income inequality, sanitation, and access to health resources are strong determinants of TB in urban Indonesia [21].
This study aims to identify the relationship between the socioeconomic characteristics of urban communities and the development of TB cases in Makassar City.
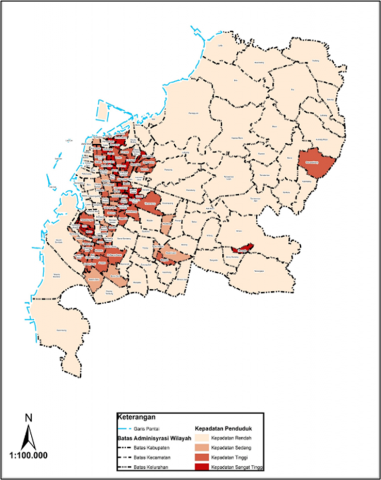
This study is located in Makassar City, which covers 15 sub-districts. Administratively, Makassar City is bordered by Maros Regency to the north, Maros Regency to the east and north, Gowa Regency to the south and southeast, and the Makassar Strait to the west (Figure 1).
Figure 1. Research location
This research includes descriptive and prescriptive research with qualitative and quantitative approaches. The data collection techniques used were observation, interviews, questionnaires, documentation, and literature study. The analysis used was descriptive statistical analysis and multinomial logistic regression. The processed data were then presented in the form of descriptions, figures, tables and maps.
In addition, both qualitative and quantitative analyses were conducted using RStudio. For qualitative data, RStudio was employed to manage and organize textual information obtained from interviews and observations.
The quantitative analysis applied Chi-square tests, multinomial logistic regression (nnet in RStudio), VIF for multicollinearity, LRT and pseudo R² for model fit, providing a comprehensive framework to explain factors influencing the outcome variable.
2.1 Population and sample
This study focuses on the research object of TB cases. The socio-economic-cultural characteristics of TB patients are identified by taking a sample that represents the entire population. The population is the total number of TB patients in 2022 who reside in the Makassar City area and are recorded as having system coordinates in the tabular data. Sampling was conducted using a stratified random sampling technique. The research sample was determined based on the number of TB cases in each sub-district of Makassar City.
Sub-district with a high number of cases, i.e., more than 60 cases, were represented by samples from Paccerakkang, Parang Tambung, and Sudiang Raya urban villages. Sub-District samples with a medium number of TB cases, between 20 and 60 cases, are represented in Pa Baeng-baeng, Bunga Eja Beru, and Jongaya. Biring Romang, Tamarunang, and Bitowa Sub-District represent villages with a low number of TB cases, less than 20 cases.
Makassar City is the provincial capital of South Sulawesi with an area of 175.77 km2 or 17,577 ha. Administratively, Makassar City consists of 15 sub-districts, namely Mariso, Mamajang, Tamalate, Rappocini, Makassar, Ujung Pandang, Wajo, Bontoala, Ujung Tanah, Sangkarrang Islands, Tallo, Panakukkang, Manggala, Biringkanaya, and Tamalanrea. The following is an administrative map of Makassar City, which can be seen in Figure 2.
Figure 2. Makassar City administration map
3.1 Population
The population in Makassar in 2022 was recorded at 1,432,189 people, consisting of 713,362 men and 718,827 women. Meanwhile, the population of Makassar City in the previous year, namely in 2021, was recorded at 1427,619 people and in 2020 at 1,423,877 people.
The distribution of Makassar's population, detailed by sub-district, shows that the population is concentrated in the Biringkanaya Sub-district area, which is 211,288 people or around 14.75 percent of the total population, followed by Tamalate Sub-district with 182.238 people (12.7%), Manggala Sub-district with 148,462 people (10.37%), and Tallo Sub-district.
145,908 people (10.19%), Rappocini Sub-district 144,733 people (10.11%), and the lowest is Ujung Pandang Sub-district 24,541 people (1.71%). The detailed population and population density in Makassar City in 2022 are described in Table 1 below.
Table 1. Area, population, percentage, and population density of Makassar City in 2022
|
District |
Area (km2) |
Total Population |
Percentage of Population (%) |
Population Density (people/km2) |
|
Mariso |
1.82 |
57,795 |
4.04 |
31,755 |
|
Mamajang |
2.25 |
56,094 |
3.92 |
24,931 |
|
Tamalate |
20.21 |
182,384 |
12.73 |
9,023 |
|
Rappocini |
9.23 |
144,733 |
10.11 |
15,681 |
|
Makassar |
2.52 |
82,265 |
5.74 |
32,645 |
|
Ujung Pandang |
2.63 |
24,541 |
1.71 |
9,331 |
|
Wajo |
1.99 |
30,110 |
2.10 |
15,131 |
|
Bontoala |
2.1 |
55,239 |
3.86 |
26,304 |
|
Ujung Tanah |
4.4 |
36,127 |
2.52 |
8,211 |
|
Tallo |
5.83 |
145,908 |
10.19 |
25,027 |
|
Panakkukang |
17.05 |
139,759 |
9.76 |
8,197 |
|
Manggala |
24.14 |
148,462 |
10.37 |
6,150 |
|
Biringkanaya |
48.22 |
211,228 |
14.75 |
4,381 |
|
Tamalanrea |
31.84 |
103,322 |
7.21 |
3,245 |
|
Kepulauan Sangkarrang |
1.54 |
14,258 |
1.00 |
9,258 |
|
Total |
175.77 |
1,432,189 |
100.00 |
8,184 |
Figure 3. Population density map of Makassar City
The population in Makassar City in 2022 is dominated by people aged 15-19, who amount to 66,660 people or 9.34% of the total population. People aged 20-24 are the next largest group, at 66,656 people or 9.34%. People over 75 are the smallest group, at 8,173 people or 1.14% of the total population. The following is a population density map of Makassar City in 2022, which can be seen in Figure 3.
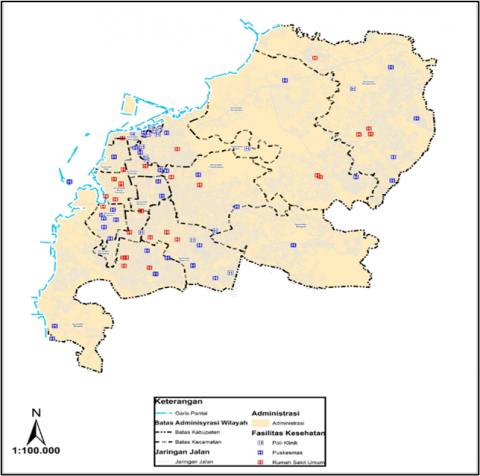
3.2 Makassar City health infrastructure
Overall, Makassar City has 80 units of health infrastructure, consisting of 3 types. There are 19 units of polyclinics, 34 units of community health centers, and 27 units of public hospitals. Table 2 below describes the number of health infrastructure units based on sub-districts in Makassar City in 2022.
Table 2. Distribution of health infrastructure in Makassar City in 2022
|
District |
Health Infrastructure |
Grand Total |
||
|
Clinic |
Public Health Center |
Hospital |
||
|
Biringkanaya |
1 |
4 |
5 |
10 |
|
Bontoala |
1 |
2 |
1 |
4 |
|
Makassar |
0 |
3 |
1 |
4 |
|
Mamajang |
1 |
1 |
5 |
7 |
|
Manggala |
0 |
5 |
0 |
5 |
|
Mariso |
0 |
4 |
3 |
7 |
|
Panakkukang |
1 |
3 |
6 |
10 |
|
Rappocini |
2 |
4 |
8 |
14 |
|
Tallo |
6 |
3 |
0 |
9 |
|
Tamalanrea |
0 |
6 |
3 |
9 |
|
Tamalate |
0 |
4 |
3 |
7 |
|
Ujung Pandang |
0 |
1 |
9 |
10 |
|
Ujung Tanah |
7 |
2 |
2 |
11 |
|
Wajo |
0 |
2 |
3 |
5 |
|
Total |
19 |
44 |
49 |
112 |
Based on the table above, the sub-district with the most health infrastructure is the Rappocini Sub-district. The sub-district with the least health infrastructure is Manggala Sub-district. Figure 4 below provides more details about the location of the distribution of health infrastructure in Makassar City.
Figure 4. Distribution map of health facilities in Makassar City
4.1 Characteristics of socioeconomic factors of respondents with TB
Social
Five indicators on social variables measure the relationship with the number of TB cases in Mkassar City: education, length of stay, age, gender, and ethnicity. Figures 5 and 6 provide more details.
Figure 5. Percentage of social categories (Education and length of stay)
Based on the figure above, we can see the percentage of each category from the indicators of education level and length of stay. The education indicator is filled by TB patients with the last level of education from the most filled, namely Senior High School (38%), Primary School (28%), Associate Degree and Bachelor’s Degree (18%), and Masters’ and Doctoral Degree (4%). For the length of stay, from the largest to the smallest, filled by those whose duration of stay was more than 20 years at 52%, 10-20 years at 25%, less than 5 years at 13% and 5-10 years at 10%.
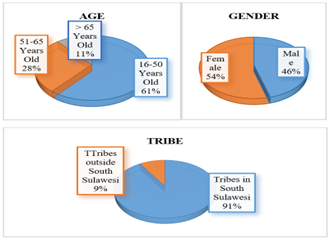
Figure 6. Percentage of social categories (Age, gender, and ethnicity)
Based on the figure above, we can see the percentage of each category from the age and gender indicators. As for the age indicator, it is dominated by the productive age 16-50 years with a percentage of 61%, age 51-65 years by 28%, and the other 11% is filled by age 65 years and over. For gender, it can be seen that of all respondents distributed to people with TB, 54% are female and 46% are male. The above figure also shows the percentage of each category of ethnic indicators, where the research questionnaire was filled in by people with TB who came from tribes in South Sulawesi by 91%, and outside South Sulawesi by 9%.
Culture
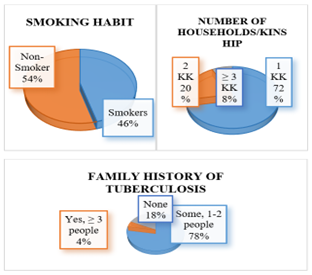
The cultural variable has 3 indicators to measure the relationship with the number of TB cases in Makassar City: smoking habits, the number of households/companions, and family history of TB. Figure 7 provides more details.
Figure 7. Percentage of cultural categories (Smoking habits, number of households, and family history of TB)
Based on the figure above, we can see the percentage of each category from the indicators of smoking habits and the number of households/kinship. As for the smoking habit indicator, it is dominated by respondents who are non-smokers (54%) and those who smoke (46%). The number of households or the level of kinship was filled by households with only 1 household (72%), 2 households (20%), and more than 2 households (8%). In addition, it can also be seen that the percentage of each category of the indicator of family history of TB, which is successively from the largest to the smallest, said that there are families who also suffer from TB as many as 1-2 people (78%), there are no families who suffer from TB (18%), and there are families who also suffer from TB more than 2 (4%).
Physical
The physical variables have 4 indicators to measure the relationship with the number of TB cases in Makassar City: housing density, land status, type of housing, and home improvement assistance. Figure 8 provides more details.
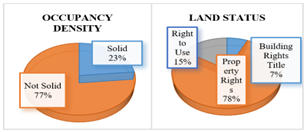
Figure 8. Percentage of physical categories (Residential density and land status)
Based on the figure above, we can see the percentage of each category from the indicators of residential density and land status. There are 2 categories of occupancy density indicators, namely densely occupied housing at 23% and not densely occupied at 77%. As for the land status indicator, it can be seen that the percentage of respondents who have property rights on their houses is 78%, the right to use is 15%, and the right to build is 7%. For more details, see Figure 9.
Figure 9. Percentage of physical categories (Type of housing and home repair assistance)
Based on the figure above, we can see the percentage of each category from the indicators of housing type and home improvement assistance. Where, the type of occupancy in a row from largest to smallest is filled by respondents who have permanent houses (73%), semi-permanent (25%), and non-permanent (2%). For home improvement assistance, it was stated by 63% of respondents that they had never received assistance, and 37% of other respondents claimed to have received assistance for their houses from the government.
Economy
The economic variable has 2 indicators to measure its relationship with the number of TB cases in Makassar City, namely the employment sector and income. Figure 10 provides more details.
Figure 10. Percentage of economic categories (Employment and income sectors)
Based on the figure above, we can see the percentage of each category from the indicators of the employment sector and income. For the employment sector, TB patients who filled out this research questionnaire were predominantly working in the non-formal sector (60%), formal (22%), and not working (18%). As for the amount of monthly income, from the largest to the smallest, namely none (33%), less than 2 million (29%), 2-3.5 million (22%), 5-10 million (8%), 3.5-5 million (7%), and more than 10 million (1%).
Access to health services
There is 1 indicator in the access to health services variable to measure its relationship with the number of TB cases in Makassar City, namely the ease of obtaining health service fees. For more details, see Figure 11.
Figure 11. Percentage of health service access category (Ease of obtaining health service fees)
Based on the figure above, it can be seen that the percentage of each category of ease of obtaining health service fees, from largest to smallest, is filled by respondents whose medical fees are completely free through BPJS (84%), paid (9%), and partially free (7%).
4.2 The relationship and significance of socioeconomic factors on the increase of tuberculosis
Chi-square test of independence
The chi-square test was performed to examine the bivariate association between each indicator and the dependent variable (Y). The results show that most variables did not exhibit statistically significant associations, except for Ethnicity, which displayed a significant relationship with the outcome.
Among all indicators, only Ethnicity from the Social category demonstrated a significant association (χ² = 27.499, p = 0.006). All other indicators, including cultural, physical, and economic variables, were not significantly related to Y in the bivariate test.
Model goodness of fit
The overall model fit was assessed by comparing the specified model against a baseline (intercept-only) model (Tables 3-7).
Table 3. Chi-Square test results per indicator
|
Variable |
Indicator |
χ² |
df |
P-Value |
Interpretation |
|
Social |
Education |
16.751 |
12 |
0.159 |
No relationship |
|
Length of residence |
12.075 |
12 |
0.440 |
No relationship |
|
|
Age |
4.834 |
8 |
0.775 |
No relationship |
|
|
Ethnicity |
27.499 |
12 |
0.006 |
Significant relationship |
|
|
Culture |
Smoking habit |
6.502 |
12 |
0.889 |
No relationship |
|
Number of household heads in one household/ family |
12.875 |
16 |
0.682 |
No relationship |
|
|
Family of a TBC patient |
8.899 |
8 |
0.351 |
No relationship |
|
|
Physical |
Residential Density |
6.935 |
8 |
0.544 |
No relationship |
|
Land Status |
8.420 |
8 |
0.394 |
No relationship |
|
|
Residential Tipe |
2.609 |
4 |
0.625 |
No relationship |
|
|
Economy |
Home Repair Assistance |
19.450 |
16 |
0.246 |
No relationship |
|
Employment Sector |
10.574 |
16 |
0.835 |
No relationship |
|
|
Revenue |
13.553 |
12 |
0.330 |
No relationship |
Table 4. Goodness of fit tests
|
Test/Index |
Value |
Interpretation |
|
Likelihood Ratio χ² |
85.268 (df = 60, p= 0.018) |
The full model is significantly better than the null |
|
Nagelkerke R² |
0.733 |
Model explains 73.3% of the variance in Y |
|
McFadden R² |
0.502 |
Indicates strong model fit for multinomial regression |
|
Pearson χ² |
31.211 (df = 12, p = 0.0018) |
Some mild deviations detected, but model is acceptable |
Table 5. Partial test results (Coefficient significance)
|
Variable |
Z-Value (Range) |
P-Value (Range) |
Significance |
|
Education |
-6.47 to-1.36 |
< 0.001-0.173 |
Significant (protective effect in most categories) |
|
Length of residence |
2.65-3.91 |
< 0.001-0.008 |
Significant |
|
Age |
1.94-7.18 |
< 0.001-0.052 |
Significant in most categories |
|
Ethnicity |
7.49-23.66 |
< 0.001 |
Highly significant (strongest effect) |
|
Smoking habit |
6.88-7.63 |
< 0.001 |
Significant |
|
Number of household heads in one household/family |
20.26-43.75 |
< 0.001 |
Significant (extreme effect) |
|
Land status |
5.89-14.91 |
< 0.001 |
Significant |
|
Residential type |
3.54-12.57 |
< 0.001 |
Significant |
|
Family of a TBC patient, Residential density |
-0.95 to 1.41 |
0.34-0.55 |
Not significant |
|
Home Repair Assistance, Employment Sector, Revenue |
-15.65 to 2.13 |
0.20-0.57 |
Not significant |
Table 6. Odds ratio summary
|
Variable |
OR Range |
Interpretation |
|
Education |
0.03-0.15 |
Protective factor |
|
Length of residence |
3.60-13.00 |
Risk factor |
|
Age |
24.07-143.90 |
Risk factor |
|
Ethnicity |
67,000-1,895,000 |
Extreme risk factor |
|
Smoking habit |
109-158 |
Risk factor |
|
Number of household heads in one household/family |
1.8e8-3.3e8 |
Extreme risk factor |
|
Land Status |
1.1e5-5.5e5 |
Risk factor |
|
Residential Type |
1,392-28,079 |
Risk factor |
|
Family of a TBC patient, Residential Density |
0.51-4.10 |
Not significant |
|
Home Repair Assistance, Employment Sector, Revenue |
0.0009-2.20 |
Not significant |
Table 7. Multicollinearity diagnostic (GVIF)
|
Variable |
GVIF |
GVIF^(1/2*Df) |
Interpretation |
|
Education |
1.23 |
1.11 |
No multicollinearity |
|
Length of residence |
1.35 |
1.16 |
No multicollinearity |
|
Age |
1.42 |
1.19 |
No multicollinearity |
|
Ethnicity |
1.67 |
1.29 |
No multicollinearity |
|
Smoking habit |
1.54 |
1.24 |
No multicollinearity |
|
Number of household heads in one household/family |
1.61 |
1.27 |
No multicollinearity |
|
Family of a TBC patient |
1.47 |
1.21 |
No multicollinearity |
|
Residential density |
1.39 |
1.18 |
No multicollinearity |
|
Land status |
1.72 |
1.31 |
No multicollinearity |
|
Residential Type |
1.58 |
1.26 |
No multicollinearity |
|
Home repair assistance |
1.45 |
1.20 |
No multicollinearity |
|
Employment sector |
1.51 |
1.23 |
No multicollinearity |
|
Revenue |
1.49 |
1.22 |
No multicollinearity |
The multinomial model demonstrated good overall fit, explaining more than 70% of the variation in Y. While Pearson’s Chi-Square suggested some deviation, the likelihood ratio and pseudo-R2 values confirmed that the model is robust and interpretable.
Multinomial Logistic Regression and Partial Test
The multinomial logistic regression results were examined in terms of coefficient significance and odds ratios.
The partial test shows that Education, Length of residence, Age, Ethnicity, Smoking habit, Number of household heads in one household/family, Land status, and Residential type are statistically significant in influencing Y. Conversely, Family of a TBC patient, Residential density, Home Repair Assistance, Employment Sector, and Revenue are not significant.
Odds Ratio Analysis
The odds ratio interpretation highlights several key findings:
1. Education (protective factor): With OR values between 0.03-0.15, higher Education reduces the likelihood of Y, indicating a protective role.
2. Length of residence and Age: With ORs up to 13.0 and 143.9, they function as strong risk factors.
3. Ethnicity: Exhibits extremely high OR values (> 1.8 million), underscoring its dominant role as the strongest risk factor in the model.
4. Smoking habit, Number of household heads in one household/family, Land Status, and Residential Type: Also display very high ORs, confirming their significant contribution to increased risk.
5. Family of a TBC patient, Residential Density, Home Repair Assistance, Employment Sector, and Revenue: Odds ratios close to or below 1 indicate weak or non-significant effects.
Multicollinearity Test
Multicollinearity was assessed using Generalized Variance Inflation Factor (GVIF).
All GVIF values were below the threshold of 5, confirming that multicollinearity is not an issue in the final model. The coefficient estimates and odds ratios are therefore considered stable.
4.3 Discussion
The chi-square tests indicated that only Ethnicity was significantly associated with Y in bivariate analysis. However, the multinomial regression revealed broader effects, with Education, Length of residence, Age, Ethnicity, Smoking habit, Number of household heads in one household/family, Land status, and Residential Type emerging as significant predictors.
The odds ratio interpretation suggests that Education functions as a protective factor, while Length of residence, Age, Ethnicity, Smoking habit, Number of household heads in one household/family, Land status, and Residential Type act as risk factors, with Ethnicity showing the strongest effect. In contrast, economic variables (Home repair assistance, Employment sector, Revenue) were not statistically significant.
Multicollinearity diagnostics confirmed that the predictors were independent, strengthening the reliability of the estimates. Overall, these findings emphasize the importance of social and physical dimensions in shaping Y, whereas economic factors played a limited role in this dataset.
Based on the results of the analysis that has been carried out, the following conclusions are obtained:
1. The analysis revealed that while most variables showed no independent association in the chi-square test, the multinomial logistic regression model identified several significant predictors—particularly social and physical factors—once inter-variable relationships were considered.
2. The final model explained 73.3% of the variance in TB outcomes and indicated that certain variables act as risk factors while others serve as protective factors. These findings highlight that TB development in Makassar is strongly shaped by specific social and housing-related characteristics, underscoring the need for targeted urban and health policies to reduce vulnerability and transmission.
The suggestions that the authors convey for further researchers, namely:
1. Suggest that future researchers explore factors that do not show significance in increasing TB cases to gain a deeper understanding of the insignificance.
2. Suggest expanding the scope of the study to other regions in Indonesia to gain insight into geographic and demographic variations in the spread of TB and its associated factors.
3. Propose the implementation of intervention and education programs based on the research findings, particularly to improve education levels, healthy housing conditions, and income, as key strategies to reduce TB cases.
[1] Agustin, S. (2024). 9 Common Infectious Diseases in Indonesia. https://www.alodokter.com/penyakit-menular-yang-umum-di-indonesia.
[2] Nurjannah, A., Rahmalia, F.Y., Paramesti, H.R., Laily, L.A. (2022). Determinan sosial tuberculosis di Indonesia. Jurnal Penelitian Dan Pengembangan Kesehatan Masyarakat Indonesia, 3(1): 65-76.
[3] Nazhofah, Q., Hadi, E.N. (2022). Dukungan keluarga terhadap kepatuhan pengobatan pada pasien tuberculosis: Literature review. Media Publikasi Promosi Kesehatan Indonesia (MPPKI), 5(6): 628-632. https://doi.org/10.56338/mppki.v5i6.2338
[4] Pramono, J.S. (2021). A literature review: Risk factors of increasing tuberculosis incidence. Jurnal Ilmiah PANNMED (Pharmacist, Analyst, Nurse, Nutrition, Midwivery, Environment, Dentist), 16(1): 106-113. https://doi.org/10.36911/pannmed.v16i1.1006
[5] Fitriangga, A., Alex, A. (2024). Assessing the impact of tuberculosis on economic growth in ASEAN countries: A conceptual framework and panel data analysis. Jurnal Ekonomi Kesehatan Indonesia, 9(1): 7. https://doi.org/10.7454/eki.v9i1.1122
[6] Abd Rani, A.Y., Ismail, N., Zakaria, Y., Isa, M.R. (2024). A scoping review on socioeconomic factors affecting tuberculosis loss to follow-up in Southeast Asia. The Medical Journal of Malaysia, 79(4): 470-476.
[7] Wanahari, T.A., Bakhriansyah, M., Haryati, H., Rudiansyah, M., Isa, M., Djallalluddin, D., Prenggono, M.D. (2022). Socioeconomic determinants of tuberculosis cases in Indonesia, 2010-2013: An ecological study. Open Access Macedonian Journal of Medical Sciences, 10(E): 1489-1495. https://doi.org/10.3889/oamjms.2022.7694
[8] Fatikha, A.N., Martini, M., Hestiningsih, R., Kusariana, N. (2022). Spatial analysis of a tuberculosis incidence in Magelang city in 2021. Disease Prevention and Public Health Journal, 16(1): 37-46. https://doi.org/10.12928/dpphj.v16i1.4677
[9] Djunaedy, H.A., Febinia, C.A., Hamers, R.L., Baird, K., Elyazar, I., Thuong, N.T.T., Trimarsanto, H., Malik, S.G., Thwaites, G., van Crevel, R., Alisjahbana, B., Chaidir, L., Ashton, P.M. (2024). A description of lineage 1 Mycobacterium tuberculosis from Papua, Indonesia. Tuberculosis, 149: 102568. https://doi.org/10.1016/j.tube.2024.102568
[10] Wardani, D.W.S.R., Wahono, E.P. (2018). Prediction model of tuberculosis transmission based on its risk factors and socioeconomic position in Indonesia. Indian Journal of Community Medicine, 43(3): 204-208. https://doi.org/10.4103/ijcm.IJCM_60_18
[11] Sulistyawati, S., Ramadhan, A.W. (2021). Risk factors for tuberculosis in an urban setting in Indonesia: A case-control study in Umbulharjo I, Yogyakarta. Journal of UOEH, 43(2): 165-171. https://doi.org/10.7888/juoeh.43.165
[12] Susilawaty, A., Basri, S., Haerana, B.T., La Ane, R., Mappau, Z., Ikhtiar, M. (2024). The risk factors contributing to the occurrence of pulmonary tuberculosis in the small island of South Sulawesi, Indonesia. Public Health of Indonesia, 10(4): 104-116. https://doi.org/10.36685/phi.v10i4.876
[13] Mahendra, E., Effendy, D.S. (2022). Analysis of AFB+ pulmonary TB prevalence at the wuna community health service center, West Muna District, Southeast Sulawesi Province, Indonesia. KnE Life Sciences, 92-97. https://doi.org/10.18502/kls.v0i0.11783
[14] Tosepu, R., Sani, A., Effendy, D.S., Ahmad, L.O.A.I. (2024). The association between climate variables and tuberculosis in Kolaka District, Southeast Sulawesi Province, Indonesia, 2013-2020: A Bayesian autoregressive model. F1000Research, 12: 1507. https://doi.org/10.12688/f1000research.138859.2
[15] Ashton, P.M., Cha, J., Anscombe, C., Thuong, N.T., Thwaites, G.E., Walker, T.M. (2023). Distribution and origins of Mycobacterium tuberculosis L4 in Southeast Asia. Microbial Genomics, 9(2): 000955. https://doi.org/10.1099/mgen.0.000955
[16] Pratiwi, A.I.R.D., Sudiadnyana, I.W. (2021). Hubungan Perilaku dan kualitas fisik Rumah dengan kejadian Tbc Paru di wilayah kerja puskesmas Kediri 1 Tahun 2020. Jurnal Kesehatan Lingkungan (JKL), 11(1): 13-17. https://doi.org/10.33992/jkl.v11i1.1403
[17] Imibri, M. (2023). Hari Tuberkolosis (TBC) Sedunia di Tahun 2023. https://www.biomedispapua.litbcang.kemkes.go.id/berita/baca/hari-tuberkolosis-TBC-sedunia-di-tahun-2023.
[18] Widyaningsih, P., Nugroho, A.A., Saputro, D.R.S. (2019). Tuberculosis transmission with relapse in Indonesia: Susceptible vaccinated infected recovered model. Journal of Physics: Conference Series, 1217(1): 012071. https://doi.org/10.1088/1742-6596/1217/1/012071
[19] Fadhila, S.N. (2022). Tuberculosis transmission in Makassar city remains high. https://daerah.sindonews.com/read/716641/710/penularan-penyakit-tuberkulosis-di-kota-makassar-masih-tinggi-1647590617.
[20] Irawati, I., Oktarizal, H., Haryanto, A. (2020). Hubungan Kepadatan Hunian dan Sosial Ekonomi dengan Kejadian Penyakit Tuberculosis Paru Studi Kasus di Wilayah Kerja Puskesmas Belakang Padang, Kelurahan Pecung Kecamatan Belakang Padang Kota Batam. Dinamika Lingkungan Indonesia, 7(1): 8-12.
[21] Kustanto, A., Ul-Haq, J. (2025). Ecological factors influencing tuberculosis in Indonesia: Exploring the interplay of health resources, socioeconomic status, climatic factors, and consumption patterns. Journal of Population and Social Studies, 33: 822-843. https://doi.org/10.25133/JPSSv332025.044