Susi Susilawati*![]() | Maria Suryaningsih
| Maria Suryaningsih![]() | Ridwan Saleh
| Ridwan Saleh![]() | Rizki Risdianto
| Rizki Risdianto![]()
© 2025 The authors. This article is published by IIETA and is licensed under the CC BY 4.0 license (http://creativecommons.org/licenses/by/4.0/).
OPEN ACCESS
Companies today face the challenge of balancing financial and sustainability targets. Tax strategies, as a means of achieving financial targets, can enhance a company's reputation and stakeholder trust. However, aggressive implementation can also create problems for the organization. Furthermore, companies cannot avoid sustainability issues, one of which is the demand for green innovation. Green innovation not only demonstrates a commitment to supporting the SDGs and complying with environmental regulations but also generates efficiency for the company. However, a debate remains over whether the positive impact of these expenditures will be directly visible in the short term. The purpose of this study is to investigate whether tax avoidance and green innovation contribute to enhanced company performance. Furthermore, we examine whether sustainability transparency plays a moderating role. The research sample consisted of non-financial companies that were consistently listed on the IDX-IC for the period from 2021 to 2024. The sample selection method used was purposive sampling. Balanced panel data was used with moderated regression analysis (MRA). The results show that tax avoidance does not affect company performance, and green innovation can improve company performance. Furthermore, sustainability transparency only moderates the impact of green innovation on company performance. This occurs due to the alignment of goals between the two. However, sustainability transparency does not moderate tax avoidance. This occurs because there can be a value conflict between tax avoidance practices and sustainability transparency. Tax avoidance is often perceived as something that conflicts with transparency and ethics.
tax avoidance, green innovation, sustainability transparency, ESG and prosperity, company performance
In recent years, sustainability and corporate social responsibility issues have become a major concern for global stakeholders [1, 2]. Companies worldwide face increasing pressure to improve their transparency and accountability in sustainable practices [3, 4], particularly in the areas of taxation and green innovation, which are increasingly becoming key benchmarks for assessing corporate performance. Tax planning and tax avoidance are critical issues for both companies and governments. Tax avoidance is also rapidly becoming a crucial tool for demonstrating the quality of a business's financial information [5]. Tax avoidance can be defined as any action that explicitly reduces a company's tax burden [6]. If implemented successfully, this strategy will transfer funds from the state or government to shareholders [7]. Consequently, regulators can impose strict oversight and potentially impose administrative and legal sanctions on companies that engage in tax avoidance. Several researchers have shown that, although it can be beneficial by improving a company's financial performance [8], aggressive tax avoidance strategies can damage a company's reputation among stakeholders [6, 9, 10] and increase uncertainty, especially among investors [6]. While it can be beneficial internally for companies, on a macro level, it has a detrimental impact on the country. The OECD (Organization for Economic Co-operation and Development) revealed that tax base reduction activities such as base erosion and profit shifting (BEPS) can cost countries an estimated 4-10% of global corporate revenue, or USD 100-240 billion in lost revenue annually [11]. Indonesia faces a similar challenge. Based on data from the Ministry of Finance (2024), the target tax ratio for 2024 is 10.12% of GDP. This figure is far below other ASEAN countries such as Thailand (17.18%), Vietnam (16.21%), and Singapore (12.96%) [12].
Other business strategies, such as green innovation, are also necessary. This green innovation involves the development of more environmentally friendly products, services, and processes [13]. Research on its impact remains controversial. Some researchers have suggested that green innovation can reduce company performance and increase costs [14]. Green innovation can improve corporate performance [15-17]. Academics and environmental strategists acknowledge that green innovation practices provide a crucial tool for developing sustainable practices. Adopting the concept of green innovation is a key element in today's business activities. Stakeholders are putting pressure on companies to adopt innovation practices as a mechanism capable of fostering a well-aligned approach to economic growth and environmental sustainability [18, 19].
In this context, sustainability transparency is a crucial factor that can moderate the relationship between tax avoidance and green innovation and corporate performance. Sustainability transparency is demonstrated by a company's commitment to the four pillars of sustainability (environmental, social, governance, and prosperity). Commitments by countries, such as those under the Paris Agreement, require companies to implement sustainability practices actively. However, few companies are committed to sustainability programs such as ESG initiatives. Listyawati et al. [20] stated that in ASEAN countries, only around 46% of non-financial companies consistently report ESG activities. This is particularly true in Indonesia, where the figure is still 44%. This indicates that many challenges remain, requiring improvements and corporate participation in implementation.
Although numerous studies have separately addressed the relationship between tax avoidance, green innovation, and financial performance, researchers believe there is still a gap in the literature regarding how sustainability transparency moderates this relationship. Several studies suggest that sustainability practices reflect managerial responsibility for ethical behavior and generally avoid irresponsible behavior. However, how stakeholders perceive the relationship between tax avoidance and sustainability performance remains an open question [21]. Furthermore, ESG proxy measurements and potential disclosure consider several aspects of previous studies, such as Kim et al. [22], Bania et al. [23], Kao et al. [24], and Albitar et al. [25]. This study employs four pillars, as adopted from Susilawati et al. [26] and utilizes weighted content analysis on a scale of 0-8.
Tax avoidance strategies can improve corporate performance because legal tax avoidance strategies allow companies to reduce their tax burden and improve their financial performance [27]. In other words, if successfully implemented, this strategy will transfer state or government wealth to shareholders [7]. Tax avoidance is not simply about adjusting one's behavior but actively seeking opportunities to reduce one's tax liabilities within the legal framework [28].
The implementation of tax avoidance behavior in an organization is influenced by agency problems [29]. From an agency theory perspective, conflicts of interest often arise in the relationship between agents and principals. As managers of company operations, managers usually make decisions and actions that are more profitable for themselves, even though this may not align with stakeholder objectives [30]. However, management can use tax avoidance strategies as a way to demonstrate its commitment to improving business efficiency and profitability, which ultimately benefits owners. This also reflects managers' ability to strategically manage tax liabilities strategically, thereby reducing agency costs arising from inefficient use of funds. Handayani's [31] study found that shareholders sometimes discourage management from engaging in tax avoidance practices due to the costs involved. Consequently, management must be accountable to shareholders for all its efforts. To achieve this goal, companies strive to achieve financial and other business performance by applying the principle of fairness. It can be concluded that a positive relationship between tax avoidance and company performance and value can occur if the interests of managers are aligned with those of shareholders, as long as it is carried out transparently and does not pose a high risk to reputation [8, 32] or the law. This means that managers do not appropriate the company's cash flow to pursue their profits [8].
H1: Tax avoidance can improve company performance.
Strict regulatory pressure and intense consumer concern for corporate environmental behavior are driving top management to integrate environmental innovation into corporate business strategies. Therefore, green innovation is an appropriate strategy for achieving sustainable development [33-35]. Green innovation is also a crucial tool for companies to win the competition in an era of environmental awareness. Many factors have been recognized as drivers of green innovation.
From a stakeholder theory perspective, companies have responsibilities not only to their owners but also to other stakeholders, such as consumers, government, society, and the environment [16, 36]. This theory explains that a company's long-term success depends on its ability to meet stakeholder expectations. To respond to these pressures, companies must have strategies that comprehensively consider the supply and demand of various stakeholder groups [36]. One strategy that companies can implement is green innovation. Green innovation demonstrates a company's efforts to reduce the negative impact of its operations on the environment, increase public trust, improve cost efficiency, and enhance productivity, while also opening up new market opportunities [37]. Thus, companies can improve not only financial performance but also non-financial performance (social legitimacy, competitive advantage, etc.). The impact of green innovation on company performance is not yet conclusive. However, research by Vasileiou et al. [16], Asni and Agustia [33], and Zhang et al. [17] has found that green innovation can improve company performance.
H2: Green innovation can improve company performance.
In the modern business era, companies are increasingly paying attention to sustainability aspects. These actions are not only for long-term profit but also as part of sustainability transparency. Sustainability transparency, characterized by ESG initiatives, can demonstrate a company's commitment not only to social aspects but also to environmental, governance, and even prosperity [26]. In this context, disclosure of ESG and prosperity information is considered a form of accountability that can increase profitability [38, 39], build trust and reputation [40, 41], and social legitimacy. During ESG transformation, companies can gain a sustainable competitive advantage and generate value for shareholders and other stakeholders through environmental and social initiatives [41].
Sustainability transparency reduces information asymmetry between management and external parties [42, 43]. When companies publicly report their sustainability efforts, this can create positive perceptions about the company's long-term risk, increase investor confidence [44-47], and strengthen relationships with consumers and regulators [48]. In the long term, these effects will contribute to improved financial performance, including profitability, innovation efficiency [49], and investment efficiency [42].
H3: Sustainability transparency can improve company performance.
Tax avoidance practices can have multiple meanings. On the one hand, it can increase net profit [8] and fiscal efficiency [27]. On the other hand, tax avoidance is an ethical issue because it affects tax revenues used by the government to improve welfare. Therefore, companies engage in tax avoidance when they voluntarily prepare sustainability reports, which are expected to reduce unfavorable views of their tax avoidance behavior [21]. However, stakeholders may be more accepting of tax avoidance practices as a managerial strategy that remains aligned with the principles of social responsibility if the company transparently discloses its commitments through ESG and prosperity initiatives. Research by Rustandi et al. [50] states that corporate taxes can be linked to social responsibility if the tax payments have implications for the wider community. Research by Abdelfattah and Aboud [51] found that the likelihood of tax avoidance is positively correlated with the level of CSR disclosure by companies. Furthermore, according to Ariff et al. [52], greater involvement in tax avoidance will mean that a company has a greater ability to engage in ESG.
In other words, a high level of sustainability transparency can mitigate the negative effects of perceived tax avoidance. Higher levels of social activity and responsibility can mitigate potential public concerns by demonstrating that they meet societal expectations [51], as well as strengthen the perception that management is acting ethically and strategically. According to Rustandi et al. [50], to mitigate the negative impact of tax avoidance, companies can increase their social responsibility activities to build their reputation. In this context, ESG transparency and prosperity act as moderating factors that influence the strength and direction of the relationship between tax avoidance and corporate financial performance.
H4: Sustainability transparency strengthens the influence of tax avoidance on company performance.
Green innovation is an essential part of a company's sustainability strategy, encompassing the development of products, processes, and business models [33, 53] focused on efficiency [49], such as reducing energy use, reducing emissions, utilizing renewable resources [54, 55], and environmentally friendly waste management [56, 57]. In the context of increasingly fierce global competition and growing environmental awareness among consumers [35] and investors [58], green innovation can be a source of competitive advantage and long-term economic value for companies [37, 59]. However, although green innovation has significant potential to improve corporate performance, these benefits are not always visible or effectively communicated to stakeholders. In many cases, innovative efforts undertaken by companies do not receive the appropriate recognition due to a lack of information or transparency.
Companies may use ESG initiatives as a form of sustainability transparency simply to project an environmentally friendly image (a legitimacy tool), rather than to truly increase green innovation. This can even divert focus from productive innovation. However, several researchers agree that communication or transparency with external parties will gain trust and demonstrate commitment to achieving sustainability [60, 61]. This is where sustainability transparency comes into play, with sustainability reports disclosing all environmental, social, governance, and prosperity initiatives. When a company consistently and thoroughly discloses information related to its sustainability policies, vision, mission, and actions, it can build trust with all stakeholders [46]. This particularly benefits consumers who feel secure and receive good quality from the company's products or services, which impacts performance improvement [35]. Similarly, companies that demonstrate energy efficiency or the use of renewable technologies can demonstrate this through adequate disclosure in their sustainability transparency reports. In other words, transparent disclosure of green innovation activities transforms the potential benefits of green innovation into realized improvements in corporate performance.
H5: Sustainability transparency strengthens the influence of green innovation on company performance.
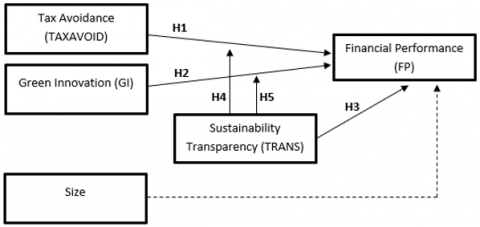
The relationships between the variables in this study are illustrated in Figure 1. These relationships are based on the hypotheses previously outlined.
Figure 1. Conceptual framework
The research design in this study is causal. The sample population is non-financial companies, and a purposive sampling method was used to select the sample.
Criteria Used:
1) The sample focuses on the energy, basic materials, non-cyclical consumer, and industrial sectors:
a) Energy – particularly relevant because it is related to "renewable energy and carbon emission reduction." Tax avoidance can often occur due to the large tax burden and high-value projects. Green innovation is crucial in this sector due to the clean energy transition.
b) Basic materials – related to the potential for tax planning due to its large cost structure, extensive business activities (exports), and this sector is starting to actively implement ESG disclosures because its financial performance is highly exposed to environmental issues.
c) on-cyclical consumer – the push for sustainability transparency disclosure is high because companies are increasingly concerned about their public image, and the potential for green innovation is quite high.
d) Industrials – the production process in this sector generates waste, necessitating green innovation initiatives. The potential for tax avoidance is high due to the large value and complexity of the projects involved. ESG disclosure is a key concern for the company's image, particularly in attracting foreign investors.
2) Companies (in the energy, basic materials, consumer non-cyclicals, and industrials sectors) consistently listed on the IDX-IC for the 2021-2024 period.
3) Companies consistently submit annual reports (AR) and sustainability reports (SR). This consistency is required to meet the ESG and prosperity disclosure requirements as proxies for sustainability transparency and green innovation.
4) Companies present financial reports in rupiah. This criterion maintains consistency and avoids distortions from foreign exchange rates. It ensures valid data comparisons. Converting foreign currencies to rupiah can introduce value bias through exchange rate fluctuations. Excluding non-rupiah reporters reduces the generalizability of results, especially for multinationals using USD. However, this step is necessary for consistent, comparable data.
5) Companies possessing complete and necessary data, particularly information related to green innovation items.
6) The sample selection table is presented in Table 1.
Table 1. Selected sample data
|
No. |
Criteria |
Total |
|
1 |
Number of companies in the energy, basic materials, consumer non-cyclicals, and industrials sectors in 2021-2024 |
395 |
|
2 |
Number of companies inconsistently listed on the IDX-IC during the 2021-2024 period |
(119) |
|
3 |
Number of companies inconsistently reporting AR and SR during the study period |
(77) |
|
4 |
Number of companies experiencing losses during the study period |
(60) |
|
5 |
Number of companies not reporting in rupiah currency |
(48) |
|
6 |
Number of companies with incomplete data required |
(14) |
|
|
Number of selected companies sampled |
77 |
|
|
Number of observation data (77 $\times$ 4 years) |
308 |
Based on Table 1, the sample size used was 77 companies, representing 308 observational data (annual company data).
The sustainability transparency variable is measured using an index obtained through content analysis. For each disclosure item, the following scoring is applied: 0 = notdisclosed; 1 = qualitative information only; 2 = qualitative and financial information; 3 = qualitative and non-financial information; 4 = qualitative and diagrams (such as tables or charts); 5 = qualitative, financial information, and non-financial information; 6 = qualitative, financial information, and diagrams; 7 = qualitative, non-financial information, and diagrams; 8 = qualitative, financial information, non-financial information, and diagrams. All item scores are summed, then divided by the product of the number of items and the maximum score, resulting in the proportional ESGP index value.
The regression model for this study used panel data regression with a moderation approach (Panel Moderated Regression Analysis). Therefore, the model regression equation can be formulated as follows:
FPi,t = β0 +β1TAXAVOIDi,t + β2GIi,t + β3TRANSi,t + β4TAXAVOID*TRANSi,t + β5GI*TRANSi,t + β6SIZEi,t + εi,t (1)
where, FP is Company Performance, TAXAVOID is Tax Avoidance, GI is Green Innovation, TRANS is Sustainability Transparency, SIZE is Company Size.
Table 2 presents the operational definitions of the study variables. Each variable is explained in terms of relevant indicators to clarify its scope and measurement.
Table 2. Operational definitions of variables
|
Variables |
Definition |
Measurement |
Sources |
|
Firm performance |
Profit to total assets ratio |
Earning/Total assets |
[5, 14, 15] |
|
Tax avoidance |
The ratio of total tax expense to pre-tax income for a company in a given year |
Tax expense/pre-tax income |
[33, 51] |
|
Green innovation |
analysis in the company’s annual report using indicators |
Analysis content: 1) The production process uses new technologies to reduce energy, water, and waste. 2) Products use more environmentally friendly materials that do not cause pollution or are hazardous. 3) Use environmentally friendly products. 4) Components or materials in the production process can be recycled or reconditioned. |
[38, 57, 62] |
|
Sustainability transparency |
Analysis of sustainability reports using 39 indicators |
ESGPIi,t = ∑Xi,t /(n x maximum score) i,t Where: ESGPIi,t is Environmental, Social, Governance, and Prosperity Index of company I in year t. ∑Xi,t is Total number or score obtained by each company in year t, using content analysis. ni,t x maximum score is Number of ESGPI items for company I in year t multiplied by the maximum score, which is 8. |
[26, 63, 64] |
|
Size |
Describes the size of a company based on the assets it owns |
Natural logarithm of total assets |
[6, 21, 52] |
The sustainability transparency variable used content analysis with weights ranging from 0 to 8. The results of this weighted content analysis were then subjected to a validity test to determine whether the instrument accurately measured what was intended. Next, a reliability test was conducted to assess data consistency. The validation test results are presented in Table 3.
Based on Table 3, of all 39 items, four were invalid and had to be dropped. These items are: 1) The company discloses its attention to return on investment (VAR00005); 2) The company discloses its biodiversity (VAR00018); 3) The company discloses its safety protection for product/service use (VAR00031); and the company discloses its involvement in political contributions (political parties) (VAR00018). Based on the validity test results, 35 items were used. The reliability test results indicated high reliability, as all items had Cronbach’s Alpha values > 0.7.
Furthermore, after all transparency variables were declared valid and reliable, descriptive statistical tests were conducted to describe the characteristics of each variable.
Table 3. Validity test results
|
Item |
Pearson Correlation |
Sign. |
Result |
|
VAR00001 |
0.190 |
0.001 |
Valid |
|
VAR00002 |
0.296 |
0.000 |
Valid |
|
VAR00003 |
0.545 |
0.000 |
Valid |
|
VAR00004 |
0.276 |
0.000 |
Valid |
|
VAR00005 |
0.077 |
0.180 |
Invalid |
|
VAR00006 |
0.309 |
0.000 |
Valid |
|
VAR00007 |
0.228 |
0.000 |
Valid |
|
VAR00008 |
0.467 |
0.000 |
Valid |
|
VAR00009 |
0.308 |
0.000 |
Valid |
|
VAR00010 |
0.562 |
0.000 |
Valid |
|
VAR00011 |
0.22 |
0.000 |
Valid |
|
VAR00012 |
0.567 |
0.000 |
Valid |
|
VAR00013 |
0.636 |
0.000 |
Valid |
|
VAR00014 |
0.577 |
0.000 |
Valid |
|
VAR00015 |
0.67 |
0.000 |
Valid |
|
VAR00016 |
0.278 |
0.000 |
Valid |
|
VAR00017 |
0.44 |
0.000 |
Valid |
|
VAR00018 |
0.08 |
0.163 |
Invalid |
|
VAR00019 |
0.638 |
0.000 |
Valid |
|
VAR00020 |
0.234 |
0.000 |
Valid |
|
VAR00021 |
0.442 |
0.000 |
Valid |
|
VAR00022 |
0.253 |
0.000 |
Valid |
|
VAR00023 |
0.589 |
0.000 |
Valid |
|
VAR00024 |
0.563 |
0.000 |
Valid |
|
VAR00025 |
0.787 |
0.000 |
Valid |
|
VAR00026 |
0.705 |
0.000 |
Valid |
|
VAR00027 |
0.734 |
0.000 |
Valid |
|
VAR00028 |
0.712 |
0.000 |
Valid |
|
VAR00029 |
0.275 |
0.000 |
Valid |
|
VAR00030 |
0.193 |
0.001 |
Valid |
|
VAR00031 |
0.034 |
0.552 |
Invalid |
|
VAR00032 |
0.38 |
0.000 |
Valid |
|
VAR00033 |
0.15 |
0.008 |
Valid |
|
VAR00034 |
0.252 |
0.000 |
Valid |
|
VAR00035 |
0.09 |
0.114 |
Invalid |
|
VAR00036 |
0.614 |
0.000 |
Valid |
|
VAR00037 |
0.656 |
0.000 |
Valid |
|
VAR00038 |
0.624 |
0.000 |
Valid |
|
VAR00039 |
0.519 |
0.000 |
Valid |
Table 4. Descriptive data
|
Variables |
Minimum |
Maximum |
Mean |
Std. Deviation |
|
FP |
0.003 |
0.341 |
0.0797 |
0.0597 |
|
TAXAVOID |
0.005 |
1.199 |
0.234 |
0.1108 |
|
GI |
0.25 |
1 |
0.6615 |
0.2746 |
|
TRANS |
0.1036 |
0.6036 |
0.2987 |
1.1154 |
|
SIZE |
11.3455 |
19.1224 |
15.337 |
1.7643 |
|
|
|
|
|
|
|
Observations |
308 |
308 |
308 |
308 |
Based on Table 4, company performance, as measured by ROA, shows a maximum value of 34.1% and a minimum value of 0.3%. This figure illustrates the significant difference between companies with low ROA and those with high ROA, meaning they are unable to efficiently utilize assets to generate profits.
Hypothesis testing
This study uses panel data regression analysis, with the first stage being the selection of the best model.
Table 5. Best model selection test
|
Test |
Prob. |
Result |
|
Chow test |
0.0000 |
FEM |
|
Hausman test |
0.0000 |
REM |
|
Lagrange multiplier test |
0.1831 |
REM |
Table 5 shows that based on the model selection tests (Chow test, Hausman test, and Lagrange multiplier test), the selected and best model is the random effects model (REM). Furthermore, when testing the classical assumptions, the test results indicate a violation of homoscedasticity and do not meet the assumption of normality of the error distribution. Therefore, to maintain the validity of the estimation results and obtain efficient estimates, the Feasible Generalized Least Squares (FGLS) estimation approach with cross-section weighted covariance is used. This approach allows the REM model to be used with consistent standard errors, as recommended by Wooldridge [65]. The multicollinearity test shows good results, with all correlation coefficients < 0.8.
FPi,t = 0.1066 – 0.0775TAXAVOIDi,t + 0.0708GIi,t + 0.2340TRANSi,t – 0.1428TAXAVOID*TRANSi,t – 0.2458GI*TRANSi,t – 0.0043SIZEi,t + εi,t (2)
Table 6. Hypothesis test results
|
Variables |
Coefficient |
t-statistic |
Prob. |
|
C |
0.1066 |
1.8313 |
0.0680 |
|
TAXAVOID |
-0.0775 |
-0.8431 |
0.3998 |
|
GI |
0.0708 |
1.8986 |
0.0568** |
|
TRANS |
0.2340 |
1.7538 |
0.0805** |
|
TAXAVOID*TRANS |
-0.1428 |
-0.4636 |
0.6433 |
|
GI*TRANS |
-0.2458 |
-2.1469 |
0.0326* |
|
SIZE |
-0.0043 |
-1.1832 |
0.2377 |
|
|
|
|
|
|
R-Square |
0.092 |
||
|
Adj. R-Square |
0.075 |
||
Based on Table 6, the tax avoidance coefficient is -0.0775. It is negatively correlated but has a probability value of 0.3998 > 0.05 and t-Statistic 0.8986 < 1.967 (t-table). This means that tax avoidance has no effect on company performance, or H1 is rejected. Tax avoidance is often carried out through aggressive or complex actions, so it cannot be directly seen in financial reports, especially the income statement or balance sheet. It will be even less visible when reclassifying financial reports. Thus, although the tax burden is reduced, it is not directly visible in ROA. Furthermore, tax avoidance is non-operational, while financial performance is derived more from the efficiency of asset use or cost structure, so its effect is insignificant. Furthermore, based on agency theory, conflicts between agents and principals often occur, so it is possible that the tax avoidance strategy is not for efficiency but rather for the personal interests of managers, thus not affecting company performance improvement. This finding is in line with the findings of Malik et al. [66] that corporate tax avoidance does not always increase profitability. This is because, according to agency theory, managers engage in tax avoidance solely to fulfill their interests. Furthermore, tax efficiency strategies are ineffective without appropriate risk management strategies and good governance. Therefore, managers should not rely too heavily on tax avoidance as an efficiency solution, as it is insignificant for company performance. The results of this study are also in line with the findings of Handayani [31]. The implication of this research is that managers must understand that tax strategy is not only about reducing the tax burden, but also about company efficiency and balancing it with legal compliance, risk management, and corporate reputation. Managers need to review tax strategies that are currently considered to contribute to profits when these tax strategies (tax avoidance) do not impact performance. There are many other factors to consider, such as improving service quality, governance, and the digitalization of business processes, among others, relevant to long-term goals.
Green innovation has a positive correlation with a coefficient value of 0.0708, indicating that a one-unit increase in green innovation will increase company performance by the same amount. The test results also show prob. values of 0.0586 < 0.1 and t-Statistic 1.8986 > 1.650 (t-table) This means that green innovation has a significant positive correlation with company performance, or H2 is accepted. Agustia et al. [62] stated that high demands from various stakeholders and competitors require companies to further develop new resources in their production processes, such as resources that can promote long-term energy efficiency, pollution reduction, waste recycling, environmentally friendly product design, and corporate environmental management. In accounting practice, cost efficiency in green innovation practices will increase profitability [15], meaning it will create value for stakeholders through environmental innovation, thus becoming a major attraction for investors [33].
Green innovation comprises product and process innovation [16]. This strategy focuses on natural resources in its processes. The natural resource-based view of companies is rooted in the interconnected strategic capabilities of all activities that can reduce environmental damage. Companies in this group are highly proactive and possess sufficient competencies to gain a competitive advantage in the market. Consequently, a proactive environmental strategy can generate benefits greater than the costs incurred. This positive impact can improve company performance [35]. These findings support previous research [16], which states that the environment should not be treated as separate or less strategic. Managerial concern for the environment demonstrates a positive impact of innovation on company performance. Green innovation is not merely a long-term issue. It can also significantly add value. Companies and managers should view green innovation as a strategic investment, not a cost. To act on these insights, managers should prioritize the development of environmentally friendly products and production processes, regularly evaluate green initiatives for both revenue and cost-saving potential, and integrate sustainability goals into performance metrics.
Sustainability transparency, as proxied by ESG and prosperity, has a positive correlation of 0.234. This indicates that higher sustainability transparency will improve company performance. The prob. value is 0.0805 < 0.1 and t-Statistic 1.7538 > 1.650 (t-table), indicating that sustainability transparency has a significant positive effect on company performance (H3 is accepted). Transparency is measured not only by the presence or absence of disclosure, but also by the extent to which the company discloses it (in terms of narrative, images, tables, monetary units, and non-monetary units). The results of this study indicate that the more detailed the information provided, the greater the level of management's commitment and attention to environmental, social, governance, and prosperity control mechanisms [26]. This finding is supported by that expressed by Albitar et al. [25], who stated that ESG disclosure is an important part of a company's strategy because it can have a crucial impact on company performance. This statement is supported by their findings, where ESG disclosure has a significant positive correlation with company performance. Furthermore, given the critical importance of sustainability transparency, companies must integrate environmental, social, and governance factors (in this study, the prosperity pillar) into their corporate plans, as these factors have been shown to influence corporate performance [67].
The research findings confirm stakeholder theory. Stakeholder theory states that companies are motivated to report various ESG initiatives not only due to regulatory requirements but also to meet the expectations and demands of all stakeholders involved [68]. Companies that engage in sustainability transparency tend to increase customer loyalty, foster long-term relationships with business partners, and minimize social conflict. This, in turn, positively contributes to improved corporate performance. The findings of this study also support the assertion by Dutt et al. [69] that organizations with higher levels of transparency and accountability in ESG-related activities tend to perform better financially. The managerial implication of these findings is that sustainability transparency is no longer merely an obligation or a demand from stakeholders but rather a business strategy (a strategic instrument) that can improve performance. Therefore, managers must position sustainability transparency as a long-term investment in sustainability and as part of core business processes.
The role of sustainability transparency was unable to moderate the effect of tax avoidance on corporate performance. The results showed a negative correlation of -0.1428. The prob. p-value is 0.6433 > 0.05 and t-Statistic 0.4636 < 1.967 (t-table). It can be concluded that H4 is rejected. Based on agency theory, managers tend to take actions that only benefit themselves [70]. Managers tend to engage in tax avoidance for short-term interests, such as pursuing high bonuses. In this case, stakeholder demands and attention to sustainability initiatives and transparency from the environmental, social, governance, and prosperity pillars should be a strong external control over managerial behavior. However, disclosures that are not substantially implemented or not implemented are ineffective in preventing the use of overly aggressive (conflicting) tax avoidance strategies. Furthermore, from a stakeholder theory perspective, stakeholders are more compliant with ethics and social responsibility and therefore may view tax avoidance as an inconsistent action that will harm others. When stakeholders are no longer convinced of the positive benefits of tax avoidance, they will perceive it as inconsistent or even as greenwashing, thereby reducing its legitimacy. Thus, sustainability transparency through ESG and prosperity disclosures is unable to moderate the relationship between tax avoidance and company performance.
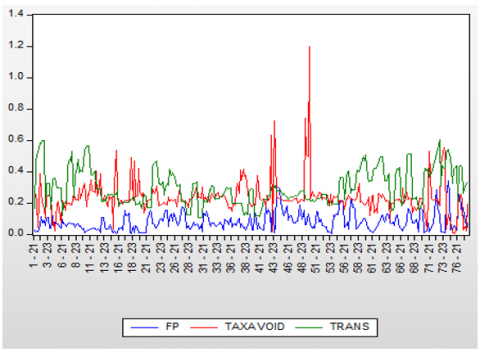
More clearly, Figure 2 shows an insignificant moderating relationship. This is indicated by the results showing that FP tends to stagnate despite fluctuating tax avoidance and sustainability transparency. This aligns with the argument that sustainability transparency (ESGP) is sometimes merely symbolic (greenwashing). Companies merely strive to fulfill their obligations in sustainability reporting, which demonstrates environmental, social, governance, and prosperity activities. Ultimately, sustainability transparency is unable to moderate or alter the relationship between tax avoidance and corporate performance.
Figure 2. Line graph (FP, TAXAVOID, TRANS)
Sustainability transparency weakens the influence of green innovation on company performance. Statistical results show a negative correlation with a coefficient value of -0.2458. The probability value is 0.0326 < 0.05 (2.1469 > 1.967). It can be concluded that H5 is rejected. The results of the study prove that although green innovation can initially contribute positively to company performance (increased profits and reputation), the demands of ESG implementation weaken its role. Commitment to ESG initiatives and prosperity need not only be stated in reports but also must be implemented in practice. This then causes companies to allocate large costs to meet compliance. These costs include those related to carbon emission footprints, social engagement, consistent training, audits, and others. All of these add costs that can reduce the financial benefits of green innovation. For example, when a company is developing renewable energy, it must also finance ESG training, various certifications, and so on, which in the short term will immediately reduce profitability. From a stakeholder perspective, their diverse existence can result in many inconsistencies in goals. As stated in Zhan [47], greater ESG involvement can reflect managerial opportunism, negatively impacting corporate innovation. This impact makes ESG a factor that weakens the effectiveness of green innovation in generating profits.
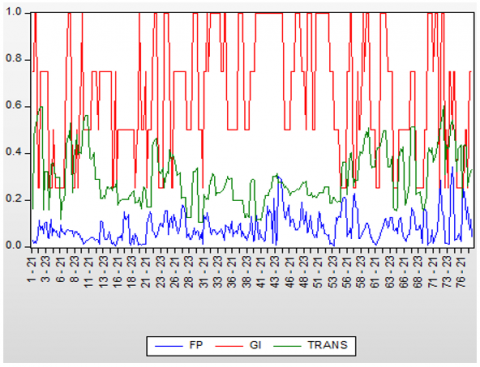
Figure 3 shows that even though green innovation (red) is high and fluctuating, company performance remains low and is not significantly affected. When sustainability transparency (green) increases in the mid-to-late period, the relationship between green innovation and company performance does not appear to strengthen. It is concluded that sustainability transparency actually weakens the influence of green innovation on company performance. This indicates that although green innovation is expected to increase efficiency [49], reduce environmental costs [54, 55], and strengthen a company's reputation [40, 41], these benefits are diminished when a company has a high level of transparency. High transparency accompanied by actual implementation requires detailed reporting, increasing costs, and thus reducing the effect of green innovation on company performance.
Figure 3. Line graph (FP, GI, TRANS)
Previous research [71] linked company size as a control variable in the relationship between ESG and company performance. However, the results of this study are inconsistent, with size not affecting company performance.
The regression results show that some independent variables significantly influence company performance. However, the R2 value is relatively low at 9.2%, with an adjusted R-Square of 7.5%. This is common in research using company-level panel data, as company performance can be influenced by many other factors outside the research model. The low R2 value indicates limited explanatory power. Nevertheless, the results still provide important information regarding the relationships between the variables studied.
The results of this study indicate that tax avoidance does not affect company performance. This finding suggests that tax avoidance strategies do not always have a direct impact on company performance in the short term. This aligns with the argument in agency theory, which states that tax avoidance will not impact profits if carried out by opportunistic managers. Therefore, risk management and control strategies are also important for achieving efficiency. Furthermore, green innovation has a positive impact on company performance. As stakeholders expect, sustainable innovation will contribute to increased profits by focusing on energy efficiency, improving product quality, and reducing the risk of environmental damage from operational processes, all of which can build a good reputation for the company.
Another finding is that sustainability transparency has a positive effect on company performance. This finding further strengthens and proves that disclosing non-financial activities is not only part of stakeholder obligations and demands but can add value, ultimately leading to increased financial returns. However, sustainability transparency was unable to moderate the relationship between tax avoidance and company performance, indicating that sustainability initiatives have not been able to neutralize negative perceptions of tax avoidance. In particular, sustainability disclosures of ESG and prosperity activities are inadequate and poorly implemented, resulting in a lack of impact on company performance. Furthermore, sustainability transparency weakens the positive effect of green innovation on company performance. ESG initiatives, which are expected to improve reputation and transparency, in fact require higher implementation costs or even increase agency costs due to managerial opportunism. Therefore, they often limit the effectiveness of green innovation strategies.
This study has several limitations, including a sample size limited to non-financial companies that consistently report AR and SR. This could bias the data by selecting only relatively strong or stable companies, resulting in a relatively low R2 value. Future researchers should choose samples that do not necessarily consistently report AR and SR, as this could better reflect real-world conditions and allow for greater generalization. Future researchers should also consider incorporating other external factors, such as macroeconomic conditions or industry dynamics. Macroeconomic conditions can influence a company's propensity to engage in tax evasion. Industry dynamics, for example, can indicate differences in sustainability strategies among companies with different characteristics.
We would like to thank the leadership of Universitas Teknologi Muhammadiyah Jakarta for their support. Their motivation, encouragement, and guidance were instrumental in enabling us to complete our research. This research was supported by the 2025 Research Grant Program from the “Kementrian Pendidikan Tinggi, Sains, dan Teknologi, Direktorat Jenderal dan Pengembangan”. The derivative grant contract number is 1012/LL3/AL.04/2025. We are grateful for the opportunity to participate in this Grant Program.
[1] Erin, O.A., Bamigboye, O.A., Oyewo, B. (2022). Sustainable development goals (SDG) reporting: An analysis of disclosure. Journal of Accounting in Emerging Economies, 12(5): 761-789. https://doi.org/10.1108/JAEE-02-2020-0037
[2] Imeni, M., Puška, A., Edalatpanah, S.A., Karimi, H. (2024). Managing financial risks in the petrochemical industry: A corporate social responsibility approach to sustainable development. Opportunities and Challenges in Sustainability, 3(4): 208-222. https://doi.org/10.56578/ocs030402
[3] Frostenson, M., Johnstone, L. (2023). Moving beyond the external face of accountability: Constructing accountability for sustainability from within. Sustainability Accounting, Management and Policy Journal, 14(7): 124-151. https://doi.org/10.1108/SAMPJ-04-2022-0198
[4] Malini, H. (2021). Transparancy and accountability contribution toward sustainability of banking sector in Indonesia. Business Innovation and Entrepreneurship Journal, 3(4): 275-282. https://doi.org/10.35899/biej.v3i4.337
[5] Jarboui, A., Kachouri Ben Saad, M., Riguen, R. (2020). Tax avoidance: Do board gender diversity and sustainability performance make a difference? Journal of Financial Crime, 27(4): 1389-1408. https://doi.org/10.1108/JFC-09-2019-0122
[6] Toumi, F., Bouraoui, M.A., Khlif, H. (2022). National culture and tax avoidance: A quantile regression analysis. Arab Gulf Journal of Scientific Research, 40(2): 196-211. https://doi.org/10.1108/AGJSR-05-2022-0047
[7] Chen, Z., Cheok, C.K., Rasiah, R. (2016). Corporate tax avoidance and performance: Evidence from China’s listed companies. Institutions and Economies, 8(3): 61-83.
[8] Khuong, N.V., Liem, N.T., Thu, P.A., Khanh, T.H.T. (2020). Does corporate tax avoidance explain firm performance? Evidence from an emerging economy. Cogent Business and Management, 7(1): 1780101. https://doi.org/10.1080/23311975.2020.1780101
[9] Baudot, L., Johnson, J.A., Roberts, A., Roberts, R.W. (2020). Is corporate tax aggressiveness a reputation threat? Corporate accountability, corporate social responsibility, and corporate tax behavior. Journal of Business Ethics, 163(2): 197-215. https://doi.org/10.1007/s10551-019-04227-3
[10] Whait, R.B., Christ, K.L., Ortas, E., Burritt, R.L. (2018). What do we know about tax aggressiveness and corporate social responsibility? An integrative review. Journal of Cleaner Production, 204: 542-552. https://doi.org/10.1016/j.jclepro.2018.08.334
[11] OECD. (2024). Addressing base erosion and profit shifting (BEPS). Organisation for Economic Co-Operation and Development. https://www.oecd.org/tax/beps/.
[12] Arifiana, Z., Wahyudi, S. (2025). Voluntary disclosure programs, tax morale, and tax penalties: Their influence on individual taxpayer compliance in the context tax regulations harmonization law. Sentralisasi, 14(2): 298-330. https://doi.org/10.33506/sl.v14i2.4474
[13] Xie, X., Huo, J., Zou, H. (2019). Green process innovation, green product innovation, and corporate financial performance: A content analysis method. Journal of Business Research, 101: 697-706. https://doi.org/10.1016/j.jbusres.2019.01.010
[14] Zhang, C., Ma, Y., Zhang, E. (2025). Does green innovation promote financial performance of Chinese listed companies? Journal of Innovation and Knowledge, 10(4): 1000740. https://doi.org/10.1016/j.jik.2025.100740
[15] Tariq, A., Badir, Y., Chonglerttham, S. (2019). Green innovation and performance: Moderation analyses from Thailand. European Journal of Innovation Management, 22(3): 446-467. https://doi.org/10.1108/EJIM-07-2018-0148
[16] Tang, M., Walsh, G., Lerner, D., Fitza, M.A., Li, Q. (2022). Green innovation, managerial concern and firm performance: An empirical study. Business Strategy and the Environment, 27(1): 39-51. https://doi.org/https://doi.org/10.1002/bse.1981
[17] Zhang, D., Rong, Z., Ji, Q. (2019). Green innovation and firm performance: Evidence from listed companies in China. Resources, Conservation and Recycling, 144: 48-55. https://doi.org/10.1016/j.resconrec.2019.01.023
[18] Rudyanto, A., Siregar, S.V. (2018). The effect of stakeholder pressure and corporate governance on the sustainability report quality. International Journal of Ethics and Systems, 34(2): 233-249. https://doi.org/10.1108/IJOES-05-2017-0071
[19] Xue, M., Boadu, F., Xie, Y. (2019). The penetration of green innovation on firm performance: Effects of absorptive capacity and managerial environmental concern. Sustainability, 11(9): 2455. https://doi.org/10.3390/su11092455
[20] Listyawati, R., Kusuma, H., Nustini, Y. (2025). The role of sustainability disclosure in enhancing bank performance: Evidence from Asean countries. Ikonomicheski Izsledvania, 34(6): 21-43.
[21] Elamer, A.A., Boulhaga, M., Ibrahim, B.A. (2024). Corporate tax avoidance and firm value: The moderating role of environmental, social, and governance (ESG) ratings. Business Strategy and the Environment, 33(7): 7446-7461. https://doi.org/10.1002/bse.3881
[22] Kim, N., Yoon, Y., Legendre, T.S. (2024). The state of ESG disclosure: An exploration of stakeholders and sustainability materiality. Tourism Analysis, 30(1): 63-85. https://doi.org/10.3727/108354224x17175130779643
[23] Bania, S., Biswas, J. (2024). Exploring relationship between ESG practices and financial attributes of leading companies. SCMS Journal of Indian Management, 21(2): 124-142.
[24] Kao, M.F., Jian, C.H., Tseng, C.H. (2024). Managerial ability and voluntary ESG disclosure and assurance: Evidence from Taiwan. Sustainability Accounting, Management and Policy Journal, 15(1): 207-231. https://doi.org/10.1108/SAMPJ-08-2022-0428
[25] Albitar, K. Haldoon, Hussainey, K., Kolade, N., Gerged, A.M. (2020). ESG disclosure and firm performance before and after IR: The moderating role of governance mecanisms. International Journal of Accounting & Information Management, 28(3): 429-444. https://doi.org/10.1108/IJAIM-09-2019-0108
[26] Susilawati, S., Aryati, T., Herawaty, V. (2024). Financial reporting quality, ESG and prosperity disclosure, and investment efficiency: The role of information asymmetry (moral hazard friction). Ikonomicheski Izsledvania, 33(7): 142-160.
[27] Fitri, S.A., Sudarmanto, E., Qothrunnada, N.A., Wahyuni, P. (2023). Analysis of the effect of tax compliance, tax avoidance, and financial reporting quality on company financial performance: A case study on a manufacturing company in Indonesia. West Science Accounting and Finance, 1(3): 119-129. https://doi.org/10.58812/wsaf.v1i03.402
[28] Gribnau, H., Jallai, A.G. (2019). Sustainable tax governance and transparency. In Challenges in Managing Sustainable Business. Palgrave Macmillan, Cham. https://doi.org/10.1007/978-3-319-93266-8_15
[29] Duhoon, A., Singh, M. (2023). Corporate tax avoidance: A systematic literature review and future research directions. LBS Journal of Management & Research, 21(2): 197-217. https://doi.org/10.1108/LBSJMR-12-2022-0082
[30] Jensen, M.C., Meckling, W.H. (1976). Theory of the firm: Managerial behavior, agency cost, and ownership structure. Journal of Financial and Economics, 3(4): 305-360.
[31] Handayani, R. (2020). Effect of tax avoidance ADN financial perpormance on firm value. International Journal of Managment Studies and Social Science Research, 2(5): 159-168.
[32] Kim, I., Kim, J., Kang, J. (2020). Company reputation, implied cost of capital and tax avoidance: Evidence from Korea. Sustainability, 12(23): 9997. https://doi.org/10.3390/su12239997
[33] Asni, N., Agustia, D. (2022). The mediating role of financial performance in the relationship between green innovation and firm value: Evidence from ASEAN countries. European Journal of Innovation Management, 25(5): 1328-1347. https://doi.org/10.1108/EJIM-11-2020-0459
[34] Doran, J., Ryan, G. (2016). The importance of the diverse drivers and types of environmental innovation for firm performance. Business Strategy and the Environment, 25(2): 102-119. https://doi.org/10.1002/bse.1860
[35] Ryszko, A. (2016). Proactive environmental strategy, technological eco-innovation and firm performance-case of Poland. Sustainability, 8(2): 156. https://doi.org/10.3390/su8020156
[36] O'Connell, M., Ward, A.M. (2020). Shareholder theory/shareholder value. In Encyclopedia of Sustainable Management. Cham: Springer International Publishing, pp. 1-7. https://doi.org/10.1007/978-3-030-02006-4
[37] Barforoush, N., Etebarian, A., Naghsh, A., Shahin, A. (2021). Green innovation a strategic resource to attain competitive advantage. International Journal of Innovation Science, 13(5): 645-663. https://doi.org/10.1108/IJIS-10-2020-0180
[38] Novitasari, M., Agustia, D. (2021). Green supply chain management and firm performance: The mediating effect of green innovation. Journal of Industrial Engineering and Management, 14(2): 391-403. https://doi.org/10.3926/jiem.3384
[39] Agnese, P., Care, R., Cerciello, M., Taddeo, S. (2024). Reconsidering the impact of environmental, social and governance practices on firm profitability. Management Decision, 63(1): 25-48. https://doi.org/10.1108/MD-10-2023-1943
[40] Meng, T., Hisham, M., Haji, D. (2023). ESG performance, investor attention, and company reputation: Threshold model analysis based on panel data from listed companies in China. Heliyon, 9(10): e20974. https://doi.org/10.1016/j.heliyon.2023.e20974
[41] Murè, P., Spallone, M., Mango, F., Marzioni, S., Bittucci, L. (2021). ESG and reputation: The case of sanctioned Italian banks. Corporate Social Responsibility and Environmental Management, 28(1): 265-277. https://doi.org/10.1002/csr.2047
[42] Gao, D., Li, S., Zhou, Y. (2025). Investment efficiency, ESG performance and corporate performance: Evidence from Chinese listed enterprises. Chinese Management Studies, 19(2): 567-599. https://doi.org/10.1108/CMS-06-2022-0210
[43] Boulton, T.J. (2024). Mandatory ESG disclosure, information asymmetry, and litigation risk: Evidence from initial public offerings. European Financial Management, 30(5): 2790-2839. https://doi.org/10.1111/eufm.12494
[44] Sugianto, N.A.P., Riandy, C.N., Zainavy, S.F., Hartikasari, A.I. (2022). The contribution of Environmental, Social, and Governance (ESG) disclosure to reduce investor asymmetry information. Proceedings Series on Social Sciences & Humanities, 7: 56-61. https://doi.org/10.30595/pssh.v7i.472
[45] Kräussl, R., Oladiran, T., Stefanova, D. (2024). A review on ESG investing: Investors’ expectations, beliefs and perceptions. Journal of Economic Surveys, 38(2): 476-502. https://doi.org/10.1111/joes.12599
[46] Moktar, N., Deli, M.M., Rauf, U.A.A., Idris, F., Purwati, A.A. (2023). ESG disclosure: The extent of investors’ confidence in stock market. International Journal of Academic Research in Progressive Education and Development, 12(3): 1005-1024. https://doi.org/10.6007/IJARPED/v12-i3/18989
[47] Zhan, S. (2023). ESG and corporate performance: A review. SHS Web of Conferences, 169: 01064. https://doi.org/10.1051/shsconf/202316901064
[48] Seok, J., Kim, Y., Kyung, Y. (2024). Technological forecasting & social change how ESG shapes firm value: The mediating role of customer satisfaction. Technological Forecasting & Social Change, 208: 123714. https://doi.org/10.1016/j.techfore.2024.123714
[49] Wan, H., Fu, J., Zhong, X. (2024). ESG performance and firms’ innovation efficiency: The moderating role of state-owned firms and regional market development. Business Process Management Journal, 30(1): 270-290. https://doi.org/10.1108/BPMJ-08-2023-0612
[50] Rustandi, R., Murwaningsari, E., Rachmawati, S. (2024). The effect of environmental, social and governance (ESG) business strategy on tax aggressiveness with corporate social responsibility (CSR) as a moderation variable. Asian Journal of Management, Entrepreneurship and Social Science, 4(1): 1142-1160. https://doi.org/10.63922/ajmesc.v4i01.676
[51] Abdelfattah, T., Aboud, A. (2020). Tax avoidance, corporate governance, and corporate social responsibility: The case of the Egyptian capital market. Journal of International Accounting, Auditing and Taxation, 38: 100304. https://doi.org/10.1016/j.intaccaudtax.2020.100304
[52] Ariff, A.M., Kamarudin, K.A., Musa, A.Z., Mohamad, N.A. (2024). Financial constraints, corporate tax avoidance and environmental, social and governance performance. Corporate Governance (Bingley), 24(7): 1525-1546. https://doi.org/10.1108/CG-08-2023-0343
[53] García-Granero, E.M., Piedra-Muñoz, L., Galdeano-Gómez, E. (2018). Eco-innovation measurement: A review of firm performance indicators. Journal of Cleaner Production, 191: 304-317. https://doi.org/10.1016/j.jclepro.2018.04.215
[54] Chang, K., Liu, L., Luo, D., Xing, K. (2023). The impact of green technology innovation on carbon dioxide emissions: The role of local environmental regulations. Journal of Environmental Management, 340: 117990. https://doi.org/10.1016/j.jenvman.2023.117990
[55] Du, K., Li, P., Yan, Z. (2019). Do green technology innovations contribute to carbon dioxide emission reduction? Empirical evidence from patent data. Technological Forecasting and Social Change, 146: 297-303. https://doi.org/10.1016/j.techfore.2019.06.010
[56] Ahen, F., Amankwah-Amoah, J. (2021). Sustainable waste management innovations in Africa: New perspectives and research agenda for improving global health. Sustainability, 13(12): 6646. https://doi.org/10.3390/su13126646
[57] Liu, D., Yousaf, Z., Rosak-Szyrocka, J. (2024). Environmental performance through green supply Chain management practices, green innovation, and zero waste management. Sustainability, 16(24): 11173. https://doi.org/10.3390/su162411173
[58] Aydoğmuş, M., Gülay, G., Ergun, K. (2022). Impact of ESG performance on firm value and profitability. Borsa Istanbul Review, 22(Sp2): S119-S127. https://doi.org/10.1016/j.bir.2022.11.006
[59] Tu, Y., Wu, W. (2021). How does green innovation improve enterprises’ competitive advantage? The role of organizational learning. Sustainable Production and Consumption, 26: 504-516. https://doi.org/10.1016/j.spc.2020.12.031
[60] Fernandez-Feijoo, B., Romero, S., Ruiz, S. (2014). Effect of stakeholders’ pressure on transparency of sustainability reports within the GRI framework. Journal of Business Ethics, 122(1): 53-63. https://doi.org/10.1007/s10551-013-1748-5
[61] Mutua, K., Powell-Turner, J., Spiers, M., Callaghan, J. (2025). An in-depth analysis of barriers to corporate sustainability. Administrative Sciences, 15(5): 161. https://doi.org/10.3390/admsci15050161
[62] Agustia, D., Sawarjuwono, T., Dianawati, W. (2019). The mediating effect of environmental management accounting on green innovation - Firm value relationship. International Journal of Energy Economics and Policy, 9(2): 299-306. https://doi.org/10.32479/ijeep.7438
[63] Park, S.R., Jang, J.Y. (2021). The impact of ESG management on investment decision: Institutional investors’ perceptions of country-specific ESG criteria. International Journal of Financial Studies, 9(3): 48. https://doi.org/10.3390/ijfs9030048
[64] Gunawan, J., Abadi, K. (2017). Content analysis method: A proposed scoring for quantitative and qualitative disclosures. In Handbook of Research Methods in Corporate Social Responsibility. Edward Elgar Publishing, pp. 349-363. https://doi.org/10.4337/9781784710927.00028
[65] Wooldridge, J.M. (2010). Econometric analysis of cross section and panel data. In Tolerance Analysis of Electronic Circuits Using MATHCAD. https://doi.org/10.1201/9781315215402-43
[66] Malik, M.S., Irfan, M., Munir, S. (2025). Corporate tax avoidance and firm performance: The moderating role of ownership concentration and board independence. Cogent Business and Management, 12(1): 2448277. https://doi.org/10.1080/23311975.2024.2448277
[67] Alslaibi, N., Abdelkarim, N. (2024). The power of ESG factors in driving financial growth: Insights from Palestine. Discover Sustainability, 5(1): 241. https://doi.org/10.1007/s43621-024-00430-z
[68] Ha, N.T.L., Khanh, T.N.H. (2024). Stakeholders and ESG disclosure. International Journal of Information, Business and Management, 16(4): 46-53.
[69] Dutt, M., Jain, R., Sharma, D., Bhattacharya, S. (2025). Corporate financial performance in the wake of ESG controversies: The Indian firm context. Australasian Accounting, Business and Finance Journal, 19(1): 118-136. https://doi.org/10.14453/aabfj.v19i1.07
[70] Jensen, M.C., Meckling, W.H. (2019). Theory of the firm: Managerial behavior, agency costs and ownership structure. Corporate Governance: Values, Ethics and Leadership, 77-132. https://doi.org/10.4159/9780674274051-006
[71] Velte, P. (2017). Does ESG performance have an impact on financial performance? Evidence from Germany. Journal of Global Responsibility, 8(2): 169-178. https://doi.org/10.1108/JGR-11-2016-0029