Achmad Rizwan![]() | Yoyok Hendarso
| Yoyok Hendarso![]() | Ardiyan Saptawan
| Ardiyan Saptawan![]() | Nurhayati Damiri*
| Nurhayati Damiri*![]()
© 2025 The authors. This article is published by IIETA and is licensed under the CC BY 4.0 license (http://creativecommons.org/licenses/by/4.0/).
OPEN ACCESS
Forests are a gift from God and serve as a strategic asset for national development due to their ecological, social, cultural, and economic benefits. However, forest and land fires (karhutla) continue to threaten the sustainability of these resources, making community preparedness a key aspect of mitigation. This study analyzes the determinants of community preparedness in preventing and controlling karhutla, with motivation as the main mediating variable. A cross-sectional design was used, involving 377 proportionally selected respondents from five sub-districts in Ogan Komering Ilir Regency. Data were collected through structured questionnaires and interviews, then analyzed using linear regression in SPSS (p = 0.05) and Importance-Performance Map Analysis (IPMA) via SmartPLS. The analysis was conducted in several stages: first, examining the influence of communication, resources, bureaucratic structure, organization, and program implementation on motivation; second, assessing how these factors and motivation affect preparedness; third, testing the mediating role of motivation; and fourth, identifying improvement priorities through IPMA. Results showed R² = 0.705 for the motivation model and R² = 0.828 for the preparedness model, indicating that 70.5% and 82.8% of the variation in each respective variable can be explained by the model. Motivation emerged as a dominant mediator with a coefficient of β = 0.927, strengthening the influence of structural factors on preparedness. IPMA positioned communication, resources, bureaucratic structure, and program implementation in the high-importance, high-performance quadrant, indicating the need for maintenance. In contrast, motivation appeared in the high-importance, low-performance quadrant, highlighting it as a priority area for intervention. Institutional and organizational attitudes showed good performance but low contribution, suggesting the need for managerial optimization to focus resources on more strategic aspects. These findings recommend participatory policies centered on strengthening community motivation and improving field program effectiveness to enhance collective preparedness. Community-based early warning systems, initial fire suppression training, environmentally friendly economic incentives, and inclusive risk communication campaigns are suggested to boost motivational performance and ensure a swift response when fire risks are detected at the local level.
forest and land fires, hotspots, community preparedness, motivation, prevention and control
Forests are a gift from God and an important asset for national development because they provide ecological, social, cultural, and economic benefits (Presidential Regulation of the Republic of Indonesia, 2021). Forests also function as inseparable conservation, protection, and production areas (Presidential Regulation of the Republic of Indonesia, 1999). However, forest and land fires (karhutla) are a serious threat that continues to occur in Indonesia. Globally, fires are a common disturbance to ecosystems and are increasing due to climate change and human activities [1]. In Indonesia, almost all forest and land fires are caused by human factors, either due to negligence or intentional [2].
Data from 2018–2023 show fluctuations in the extent of national forest fires, with peaks in 2019 (1.6 million ha) and 2023 (1.16 million ha). In South Sumatra, fires also spiked in 2019 (336 thousand ha) and 2023 (132 thousand ha) (Ministry of Environment and Forestry, 2020). Forest and land fires have major impacts, ranging from ecosystem damage, loss of biodiversity, decreased land productivity, to health problems due to smoke such as ARI, bronchitis, and eye irritation [3]. Burning peatlands, although smaller in area than mineral soil, have a much more severe impact [4]. Overall, forest fires pose long-term ecological, social, and economic risks that threaten environmental sustainability and community welfare [5]. Forest fires in Indonesia are generally caused by human activities, either due to deliberate land clearing by burning, or negligence [6].
However, the success of forest and land fire control does not only depend on law enforcement or infrastructure, but also on community preparedness. This preparedness includes knowledge, attitudes, risk perception, community participation, and institutional support. Regression models can be used to identify factors that influence the level of community preparedness in dealing with forest and land fires. By understanding the variables that have a significant influence, such as knowledge about forest and land fires, experience in dealing with fires, participation in training, and perception of risk, targeted interventions can be designed. In the context of OKI Regency, where most of the area consists of peatlands that are easily burned and have limited access to information and control infrastructure, understanding the determinants of community preparedness is very important. A data-based approach through a regression model will provide a clear picture of the main factors that need to be strengthened to encourage communities to be more prepared and responsive to the threat of forest and land fires. Therefore, this study is important to analyze the factors that influence community preparedness in preventing and controlling forest and land fires in Ogan Komering Ilir Regency using a regression model approach, so that it can be the basis for more effective and sustainable strategic planning.
2.1 Context of forest and land fires (Karhutla) in Indonesia and Ogan Komering Ilir (OKI)
Forest and land fires (karhutla) in Ogan Komering Ilir (OKI) Regency are a recurring ecological disaster triggered by peatland conversion, land clearing through burning methods, and climate change that leads to prolonged dry seasons [7]. The weak collaboration among actors in karhutla mitigation in OKI, with a dominant repressive approach from government authorities rather than empowering local communities. The impact of karhutla in this area has also been proven to increase the risk of respiratory diseases such as ARI (Acute Respiratory Infections), especially among vulnerable groups [8].
2.2 Community participation and disaster preparedness
Active community participation in disaster preparedness has been shown to be a critical factor in reducing karhutla risk [9]. In coastal communities also showed that disaster education and the use of social media can enhance preparedness by strengthening behavioral intention [10].
2.3 Structural determinants of preparedness
Good governance and effective communication are key elements in improving disaster preparedness. Noted that community and private sector participation are essential in formulating national karhutla prevention policies. the “Masyarakat Peduli Api” (Fire Concerned Community) initiative serves as an example of how empowerment-based communication patterns can enhance public roles in karhutla control [11].
2.4 The role of motivation as a mediating variable
Both intrinsic and extrinsic motivation have been shown to influence individual preparedness for disasters. Using the Self-Determination Theory approach, identified four main motivational dimensions that explain preparedness behavior: personal meaning, avoidance of negative outcomes, social normative pressure, and altruistic orientation [12].
2.5 Methodological approaches: PLS-SEM and IPMA
The PLS-SEM method has been widely used in disaster research due to its ability to handle complex models with moderate sample sizes. Used PLS-SEM to analyze the adoption of disaster mapping applications in Magelang. To enhance the practicality of the analysis results, Importance-Performance Map Analysis (IPMA) is used to identify improvement priorities by combining the level of importance and performance. Introduced this technique in strategic management, while developed the configurational IPMA (cIPMA) to distinguish between “must-have” and “nice-to-have” factors in decision-making processes [13].
3.1 Research design
This study uses a cross-sectional design with the aim of analyzing community preparedness in preventing and controlling forest and land fires, where motivation acts as a mediating variable [14, 15]. The variables studied include the demographic characteristics of respondents, such as age, gender, education level, type of employment, length of residence in the area, residential status, and land ownership [16]. In addition, this study also measures various factors that are thought to influence the level of community preparedness, including knowledge, individual attitudes [17], community perception of risk, communication effectiveness [18], resource availability , and attitudes of related institutions [19].
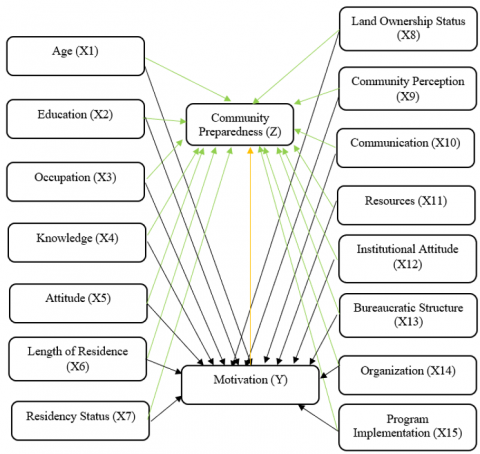
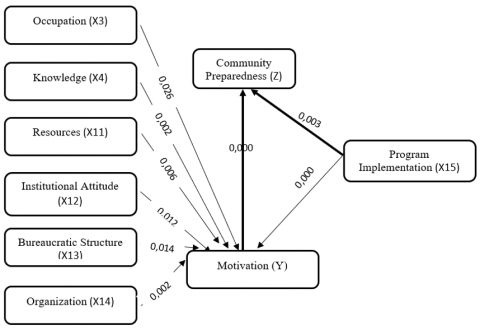
This study’s conceptual framework integrates the L. Green model and Edward III's policy implementation model to analyze community preparedness in facing forest and land fires. The L. Green model explains that preparedness behavior is influenced by predisposing factors (knowledge, attitudes), enabling factors (access to facilities and information), and reinforcing factors (social support), all mediated by motivation [20]. Meanwhile, Edward III’s model highlights the importance of policy communication, resources, implementers' disposition, and bureaucratic structure as key determinants of effective policy implementation [21]. In this framework, motivation serves as a mediating factor, while preparedness for forest and land fire prevention is the dependent variable. The conceptual framework of the study is in Figure 1.
3.2 Population and sample
The research population was active communities in fire-aware communities in 18 sub-districts in Ogan Komering Ilir Regency, with a total population of 6,540 people. The sample was determined using the Slovin formula with a 5% error rate, resulting in 377 respondents. The sample was distributed proportionally to five sub-districts representing the research area. After determining the sample size of 377 respondents, the next stage was to allocate the sample into groups (clusters) based on the sub-district using the proportional allocation method. This method ensures that the number of samples in each sub-district is proportional to the population size of each sub-district in the total population of 1,940 people. For example, Lempuing and Mesuji Makmur Sub-districts, each with a population of 380 people, were allocated 74 respondents, while Kayu Agung Sub-district with the largest population of 500 people, received the largest sample allocation of 97 respondents.
Figure 1. Conceptual framework of community preparedness regression model with motivation mediation
3.3 Data collection techniques
This study used a questionnaire as a measuring tool, with an interview technique for data collection. The variables measured include respondent characteristics (age, gender, education, occupation, length of residence, residency status, and land ownership), as well as factors influencing preparedness (knowledge, attitude, community perception, communication, resources, institutional attitudes, bureaucratic structure, organization, program implementation, motivation, and community preparedness). Most variables are measured using a ratio scale, while some use nominal and ordinal scales according to data characteristics.
3.4 Data analysis
The normality test in this study was conducted using the Normal Probability Plot graph to observe whether the residuals were normally distributed. The multicollinearity test was assessed using the Tolerance value (< 0.10) and VIF (> 10), which indicate the presence of multicollinearity symptoms [22]. The heteroscedasticity test was carried out using a scatterplot graph between predicted values and residuals to detect any patterns of variance inhomogeneity [23].
The initial data analysis employed multiple linear regression to examine the influence of independent variables (communication, resources, bureaucratic structure, organization, and program implementation) on motivation as the dependent variable [24]. The t-test was used to determine the partial effect of each variable, while the F-test was applied to test the simultaneous effect of all independent variables [25]. The model's strength was evaluated using the coefficient of determination (R²), which indicates the extent to which variations in the dependent variable can be explained by the independent variables [26]. All these analyses were conducted using SPSS software.
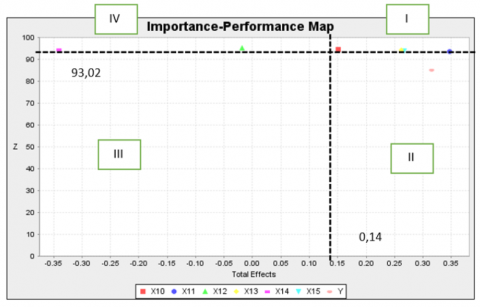
As a complement to the regression and structural analysis, this study also employed the Importance-Performance Map Analysis (IPMA) method to provide practical and managerial implications. IPMA was used to evaluate not only the importance (total effect) of each construct on the target variable (motivation or preparedness), but also its actual performance, measured by the average score of respondents’ perceptions toward the construct indicators [27]. The IPMA results are presented in a quadrant map that visualizes priority areas for performance improvement or maintenance.
The IPMA was conducted at both the construct and indicator levels, thereby offering more detailed strategic direction for policymakers. The combination of multiple linear regression and IPMA provides a comprehensive approach to identifying key factors and improvement priorities in efforts to enhance community preparedness for forest and land fire disasters.
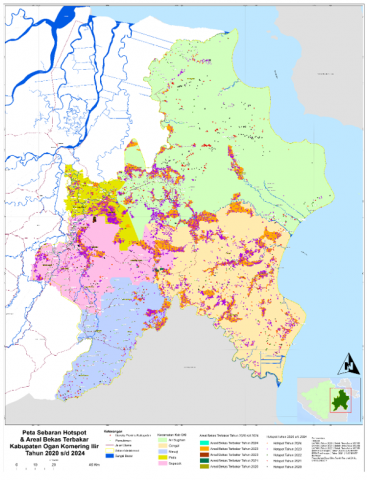
4.1 Distribution of hotspots and burned areas
The distribution of Hotspots and Burned Areas in Ogan Komering Ilir (OKI) Regency from 2020 to 2024 can be seen in Figure 2. Forest and land fire hotspot data from 2020 to 2024 show significant fluctuations, with an increasing pattern in the dry season (July–October). 2023 recorded a drastic spike with 10,257 hotspots, especially in Cengal District (2,536 points), Tulung Selapan (1,695), and Sungai Menang (1,508). Conversely, 2022 showed a significant decrease (144 points), allegedly due to increased effectiveness in fire management. Tulung Selapan and Air Sugihan Districts were consistently areas with high hotspots in the early years, while dominance shifted to Cengal and Sungai Menang in 2023 and 2024. Until October 2024, a significant decrease was recorded to 349 points, with the peak of fires still occurring in September and October.
Figure 2. Distribution of hotspots and burnt areas in Ogan Komering Ilir (OKI) Regency from 2020 to 2024
4.2 Fire area
The area of forest and land fires reflects the level of vulnerability of the region and the effectiveness of fire control efforts. Ogan Komering Ilir Regency experienced fluctuations in the area of fires during 2019–2024, influenced by weather conditions, land types, and mitigation efforts. Table 1 presents data on the annual area of fires based on land types, namely mineral and peat lands.
Table 1. Area of fires in Ogan Komering Ilir Regency 2019-2024
|
Year |
Mineral (ha) |
Peatland (ha) |
Total (ha) |
|
2019 |
103,159.3 |
91,665.2 |
194,824.5 |
|
2020 |
53.9 |
515.0 |
568.9 |
|
2021 |
786.1 |
248.4 |
1,034.6 |
|
2022 |
219.4 |
27.6 |
247.0 |
|
2023 |
39,566.0 |
40,459.9 |
80,026.0 |
|
2024 |
1,962.7 |
571.1 |
2,533.9 |
The area of forest and land fires in Ogan Komering Ilir Regency experienced sharp fluctuations during the 2019–2024 period. The peak of the fires occurred in 2019 with a total of 194,824.5 hectares, consisting of 103,159.3 hectares of mineral land and 91,665.2 hectares of peat land. A drastic decline occurred in 2020 (568.9 ha) and increased again in 2021 (1,034.6 ha). 2022 recorded another decline to 247.0 ha, before jumping significantly in 2023 to reach 80,026.0 ha. In 2024, the area of the fires fell to 2,533.9 ha.
4.3 Regression model
The analysis in this study is divided into several main stages: first, examining the influence of communication, resources, bureaucratic structure, organization, and program implementation on motivation; second, assessing how these factors and motivation affect preparedness; third, testing the mediating role of motivation; and fourth, identifying improvement priorities through IPMA.
(A)
(B)
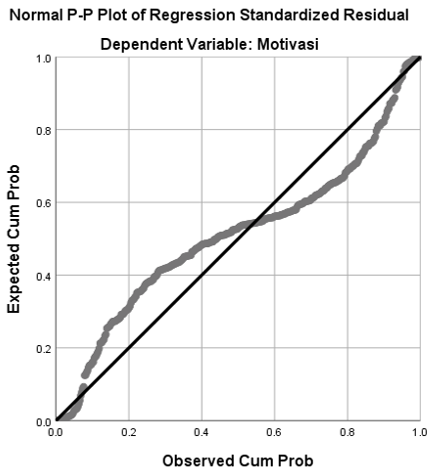
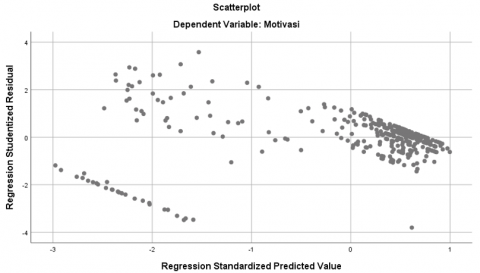
Figure 3. Normal probability plot graph and scatterplot graph
4.4 Multiple linear regression motivation analysis model
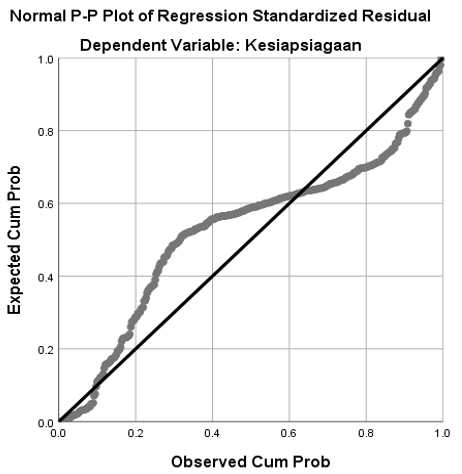
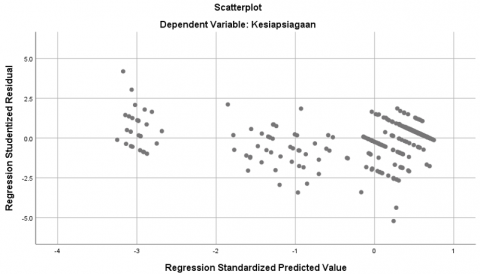
The independent variables consist of Age (X1), Education (X2), Occupation (X3), Knowledge (X4), Attitude (X5), Length of residence (X6), Residential status (X7), Land/land ownership status (X8), Community perception (X9), Communication (X10), Resources (X11), Institutional attitudes (X12), Bureaucratic structure (X13), Organization (X14), and Program implementation (X15). Before conducting regression analysis, classical assumption testing is required to ensure the validity and reliability of the model used. Classical assumption tests include normality tests (Figure 3(A)), multicollinearity tests (Table 2), and heteroscedasticity tests (Figure 3(B)), each of which aims to examine data distribution, relationships between independent variables, and consistency of residual variance. The following is an explanation of the methods used in classical assumption testing in this study.
The Normal P-P Plot of Standardized Residuals (Figure 3(A)) shows that most data points lie close to the diagonal line, indicating that the residuals of the regression model are approximately normally distributed. Although there are some minor deviations, the overall pattern still supports the fulfillment of the normality assumption. Meanwhile, the scatterplot of residuals versus predicted values (Figure 3(B)) shows that the data points are randomly distributed around the zero line without forming any specific pattern, indicating no signs of heteroscedasticity. This suggests that the assumption of homoscedasticity is also met.
However, a limitation that should be acknowledged is the presence of slight deviations in the P-P Plot, indicating that the residuals are not perfectly normally distributed. Although these deviations are relatively minor, they may influence the accuracy of regression parameter estimates, especially in studies with small sample sizes or when generalized to broader populations [28, 29]. Therefore, the interpretation of regression results should be approached with caution, considering the potential for minor bias in the residual distribution. Recent studies emphasize the importance of thoroughly checking regression assumptions to ensure model validity and prevent misleading conclusions [30, 31].
Table 2. Multicollinearity test results
|
Variabel |
Collinearity Statistics |
|
|
Tolerance |
VIF |
|
|
(Constant) |
|
|
|
Age |
0.835 |
1.197 |
|
Education |
0.841 |
1.189 |
|
Occupation |
0.978 |
1.023 |
|
Knowledge |
0.654 |
1.528 |
|
Attitude |
0.546 |
1.831 |
|
Length of Residence |
0.872 |
1.147 |
|
Residency Status |
0.861 |
1.161 |
|
Land Ownership Status |
0.857 |
1.167 |
|
Community Perception |
0.701 |
1.426 |
|
Communication |
0.366 |
2.732 |
|
Resources |
0.385 |
2.599 |
|
Institutional Attitude |
0.273 |
3.662 |
|
Bureaucratic Structure |
0.276 |
3.622 |
|
Organization |
0.200 |
5.007 |
|
Program Implementation |
0.184 |
5.439 |
Table 2 shows the results of the collinearity analysis, presenting the Tolerance and VIF values for each variable. Most variables have acceptable Tolerance values (greater than 0.1) and low VIF values (below 10), indicating no significant multicollinearity issues. However, the variables Organization (Tolerance = 0.200; VIF = 5.007) and Program Implementation (Tolerance = 0.184; VIF = 5.439) exhibit relatively low Tolerance values and higher VIFs compared to other variables. Although these VIF values are still below the commonly accepted threshold of 10, they suggest a potential for moderate multicollinearity that could affect the stability of the regression coefficients.
To minimize the potential impact of multicollinearity, researchers may consider several approaches, such as variable reduction through factor analysis or principal component analysis (PCA), or combining highly correlated variables into a single composite construct. Additionally, transforming variables or reevaluating the theoretical framework underlying the measurement can help reduce redundancy between variables [32].
Overall, the classical assumption tests indicate that the regression model meets the necessary conditions for linear regression analysis. Therefore, to analyze the relationship between the independent and dependent variables, this study uses multiple linear regression as the primary analytical method. Table 3 presents the results of the multiple linear regression test:
Table 3. Results of multiple linear regression motivation analysis model
|
Step |
Variable |
Unstandardized Coefficients |
t |
Sig. |
|
|
B |
Std. Error |
||||
|
1 |
(Constant) |
16.495 |
6.995 |
2.358 |
0.019 |
|
Age |
-0.100 |
0.057 |
-1.761 |
0.079 |
|
|
Education |
-1.555 |
1.210 |
-1.285 |
0.199 |
|
|
Occupation |
1.494 |
0.668 |
2.236 |
0.026 |
|
|
Knowledge |
0.909 |
0.297 |
3.066 |
0.002 |
|
|
Attitude |
0.538 |
0.309 |
1.741 |
0.083 |
|
|
Length of Residence |
-0.103 |
0.162 |
-0.640 |
0.523 |
|
|
Residency Status |
1.152 |
1.164 |
0.990 |
0.323 |
|
|
Land Ownership Status |
-1.678 |
1.132 |
-1.482 |
0.139 |
|
|
Community Perception |
-0.596 |
0.323 |
-1.843 |
0.066 |
|
|
Communication |
0.888 |
0.721 |
1.232 |
0.219 |
|
|
Resources |
1.948 |
0.709 |
2.746 |
0.006 |
|
|
Institutional Attitude |
3.113 |
1.352 |
2.302 |
0.022 |
|
|
Bureaucratic Structure |
3.273 |
1.322 |
2.476 |
0.014 |
|
|
Organization |
8.335 |
2.693 |
3.095 |
0.002 |
|
|
Program Implementation |
10.197 |
2.874 |
3.549 |
0.000 |
|
|
2 |
(Constant) |
16.264 |
6.980 |
2.330 |
.020 |
|
Age |
-.098 |
.057 |
-1.725 |
.085 |
|
|
Education |
-1.543 |
1.208 |
-1.277 |
.203 |
|
|
Occupation |
1.484 |
.667 |
2.224 |
.027 |
|
|
Knowledge |
.905 |
.296 |
3.055 |
.002 |
|
|
Attitude |
.513 |
.306 |
1.674 |
.095 |
|
|
Residency Status |
1.140 |
1.163 |
.980 |
.328 |
|
|
Land Ownership Status |
-1.705 |
1.130 |
-1.508 |
.132 |
|
|
Community Perception |
-.610 |
.322 |
-1.893 |
.059 |
|
|
Communication |
.926 |
.718 |
1.291 |
.198 |
|
|
Resources |
1.941 |
.709 |
2.738 |
.006 |
|
|
Institutional Attitude |
3.053 |
1.348 |
2.265 |
.024 |
|
|
Bureaucratic Structure |
3.202 |
1.316 |
2.432 |
.015 |
|
|
Organization |
8.356 |
2.691 |
3.105 |
.002 |
|
|
Program Implementation |
10.223 |
2.871 |
3.561 |
.000 |
|
|
3 |
(Constant) |
18.230 |
6.685 |
2.727 |
.007 |
|
Age |
-.099 |
.057 |
-1.741 |
.083 |
|
|
Education |
-1.601 |
1.207 |
-1.326 |
.186 |
|
|
Occupation |
1.456 |
.667 |
2.185 |
.030 |
|
|
Knowledge |
.911 |
.296 |
3.077 |
.002 |
|
|
Attitude |
.541 |
.305 |
1.774 |
.077 |
|
|
Land Ownership Status |
-1.971 |
1.097 |
-1.797 |
.073 |
|
|
Community Perception |
-.559 |
.318 |
-1.757 |
.080 |
|
|
Communication |
.902 |
.717 |
1.258 |
.209 |
|
|
Resources |
1.954 |
.709 |
2.758 |
.006 |
|
|
Institutional Attitude |
3.043 |
1.348 |
2.257 |
.025 |
|
|
Bureaucratic Structure |
3.253 |
1.315 |
2.473 |
.014 |
|
|
Organization |
8.182 |
2.685 |
3.047 |
.002 |
|
|
Program Implementation |
10.476 |
2.859 |
3.664 |
.000 |
|
|
4 |
(Constant) |
17.791 |
6.681 |
2.663 |
.008 |
|
Age |
-.100 |
.057 |
-1.755 |
.080 |
|
|
Education |
-1.548 |
1.207 |
-1.282 |
.201 |
|
|
Occupation |
1.365 |
.663 |
2.059 |
.040 |
|
|
Knowledge |
.904 |
.296 |
3.050 |
.002 |
|
|
Attitude |
.602 |
.301 |
1.999 |
.046 |
|
|
Land Ownership Status |
-1.941 |
1.098 |
-1.769 |
.078 |
|
|
Community Perception |
-.558 |
.318 |
-1.755 |
.080 |
|
|
Resources |
2.373 |
.626 |
3.789 |
.000 |
|
|
Institutional Attitude |
3.132 |
1.347 |
2.325 |
.021 |
|
|
Bureaucratic Structure |
3.299 |
1.316 |
2.507 |
.013 |
|
|
Organization |
8.164 |
2.687 |
3.038 |
.003 |
|
|
Program Implementation |
11.137 |
2.813 |
3.959 |
.000 |
|
|
5 |
(Constant) |
10.630 |
3.671 |
2.896 |
.004 |
|
Age |
-.073 |
.053 |
-1.379 |
.169 |
|
|
Occupation |
1.359 |
.664 |
2.047 |
.041 |
|
|
Knowledge |
.876 |
.296 |
2.962 |
.003 |
|
|
Attitude |
.605 |
.302 |
2.007 |
.045 |
|
|
Land Ownership Status |
-1.986 |
1.098 |
-1.808 |
.071 |
|
|
Community Perception |
-.545 |
.318 |
-1.713 |
.088 |
|
|
Resources |
2.343 |
.626 |
3.740 |
.000 |
|
|
Institutional Attitude |
3.227 |
1.346 |
2.397 |
.017 |
|
|
Bureaucratic Structure |
3.213 |
1.315 |
2.443 |
.015 |
|
|
Organization |
8.342 |
2.686 |
3.106 |
.002 |
|
|
Program Implementation |
11.103 |
2.815 |
3.944 |
.000 |
|
|
6 |
(Constant) |
7.593 |
2.940 |
2.583 |
.010 |
|
Occupation |
1.367 |
.664 |
2.056 |
.040 |
|
|
Knowledge |
.897 |
.296 |
3.032 |
.003 |
|
|
Attitude |
.629 |
.301 |
2.087 |
.038 |
|
|
Land Ownership Status |
-2.051 |
1.098 |
-1.868 |
.063 |
|
|
Community Perception |
-.536 |
.319 |
-1.683 |
.093 |
|
|
Resources |
2.377 |
.627 |
3.794 |
.000 |
|
|
Institutional Attitude |
3.084 |
1.344 |
2.295 |
.022 |
|
|
Bureaucratic Structure |
3.271 |
1.316 |
2.485 |
.013 |
|
|
Organization |
8.120 |
2.684 |
3.025 |
.003 |
|
|
Program Implementation |
11.412 |
2.810 |
4.062 |
.000 |
|
Based on the results of the regression analysis, the following equation was obtained: Y = 7.593 + 1.367 (Occupation) + 0.897 (Knowledge) + 0.629 (Attitude) - 2.051 (Land/land ownership status) - 0.536 (Community perception) + 2.377 (Resources) + 3.084 (Institutional attitude) + 3.271 (Bureaucratic structure) + 8.120 (Organization) + 11.412 (Program implementation) + Ɛ. This equation shows that variables such as occupation, knowledge, attitude, resources, institutional attitude, bureaucratic structure, organization, and program implementation have a positive influence on the level of community preparedness, with program implementation providing the greatest contribution. Conversely, land/land ownership status and community perception have a negative influence on preparedness. The constant value of 7.593 indicates that when all independent variables are zero, the community preparedness value is at that number. The remaining error (Ɛ) represents the variation not explained by the model.
The regression analysis indicates that program implementation exerts the greatest positive effect on community motivation. Effective, transparent, and participatory execution of public programs is therefore fundamental to fostering engagement—an observation consistent [33]. Who demonstrated that perceived program effectiveness significantly elevates participant motivation. Institutional factors—specifically organizational capacity, bureaucratic structure, and institutional attitudes—also exhibit strong positive relationships with motivation [34, 35]. These findings corroborate who argue that responsive bureaucracies and institutions committed to public service cultivate the trust necessary for sustained community participation [36].
Moreover, the availability of resources (financial, human, and infrastructural) significantly enhances motivation. Adequate resourcing not only improves program efficiency but also bolsters public perceptions of program success and longevity, thereby reinforcing motivation [37]. At the individual level, variables such as occupation, knowledge, and attitude positively influence motivation. This aligns with Bandura’s self‑efficacy theory, recently revisited, which posits that individuals’ confidence in their capabilities is a primary driver of active participation in collective endeavors [38].
Conversely, land‑ownership status and community perception exert negative effects on motivation. Insecure tenure reduces both responsibility and attachment to program outcomes, echoing, who highlight tenure security as a precondition for participatory investment. Likewise, negative perceptions of program quality, institutional effectiveness, or governmental intent foster skepticism and dampen participation [38, 39]. Consequently, cultivating positive perceptions through transparent communication and participatory processes is essential. Subsequent t‑tests (Table 4) confirm the partial significance of key predictors. Occupation influences motivation by providing meaningful work that enhances satisfaction and responsibility, while knowledge markedly increases the likelihood of participation by clarifying a program’s benefits and objectives [40].
Collectively, these results underscore the multifaceted nature of community motivation, highlighting program quality, institutional support, resource adequacy, and individual cognition as critical leverage points, while signaling the demotivating roles of insecure tenure and negative perceptions.
Table 4. Results of the motivation t-test
|
Variabel |
B |
t |
Sig. |
Note |
|
(Constant) |
16.495 |
2.358 |
0.019 |
|
|
Age |
-0.100 |
-1.761 |
0.079 |
Not Significant |
|
Education |
-1.555 |
-1.285 |
0.199 |
Not Significant |
|
Occupation |
1.494 |
2.236 |
0.026 |
Significant |
|
Knowledge |
0.909 |
3.066 |
0.002 |
Significant |
|
Attitude |
0.538 |
1.741 |
0.083 |
Not Significant |
|
Length of Residence |
-0.103 |
-0.640 |
0.523 |
Not Significant |
|
Residency Status |
1.152 |
0.990 |
0.323 |
Not Significant |
|
Land Ownership Status |
-1.678 |
-1.482 |
0.139 |
Not Significant |
|
Community Perception |
-0.596 |
-1.843 |
0.066 |
Not Significant |
|
Communication |
0.888 |
1.232 |
0.219 |
Not Significant |
|
Resources |
1.948 |
2.746 |
0.006 |
Significant |
|
Institutional Attitude |
3.113 |
2.302 |
0.022 |
Significant |
|
Bureaucratic Structure |
3.273 |
2.476 |
0.014 |
Significant |
|
Organization |
8.335 |
3.095 |
0.002 |
Significant |
|
Program Implementation |
10.197 |
3.549 |
0.000 |
Significant |
Furthermore, the availability of resources such as funds, tools, and technical support facilitates the implementation of activities, which has a positive effect on individual or group motivation. In addition, a positive and responsive institutional attitude provides a sense of trust and security, so that people feel more motivated to participate. The factor of an efficient and transparent bureaucratic structure is also important because it minimizes administrative obstacles, simplifies the process, and keeps the spirit of participation high [41]. The role of the organization as a community motivator and facilitator has also been shown to strengthen motivation through good coordination and member empowerment. Finally, the implementation of a program that runs smoothly and provides real results will increase the sense of ownership and ongoing motivation [42].
Next, an F test was carried out, which aims to test the significance of the influence of all independent variables simultaneously on the dependent variable, namely motivation. The F test is used to determine whether the regression model that was built as a whole is able to explain the variability of motivation significantly. The results of the F test analysis can be seen in Table 5:
Table 5. Results of the motivation F test
|
Model |
Sum of Squares |
df |
Mean Square |
F |
P Value |
|
Regression |
71666.884 |
10 |
7166.688 |
87.387 |
0.000g |
|
Residual |
30015.976 |
366 |
82.011 |
|
|
|
Total |
101682.859 |
376 |
|
|
|
The results of the F test show that the overall regression model is significant in explaining motivation variables, indicated by an F value of 87.387 with a p value = 0.000 (p < 0.05). This means that the independent variables included in the model together have a significant effect on motivation. In other words, this model is able to explain variations in motivation well, so it is suitable for use in predicting and analyzing factors that influence motivation.
Practically, the significance of this model indicates that a combination of factors such as work, knowledge, resources, institutional attitudes, bureaucratic structure, organization, and program implementation simultaneously play an important role in increasing individual or group motivation [43]. This is in line with recent research showing that regression models with contextual and structural variables can effectively predict motivation in various organizational and societal contexts [44]. A significant model also indicates the need for an integrated approach in resource management and capacity building to maintain and enhance motivation, as each variable contributes to shaping overall motivation [45].
Test of determination coefficient (R²). This test provides information on the strength of the regression model in explaining the proportion of variability in motivation caused by changes in the independent variables. The results of the determination coefficient test can be seen in Table 6:
Table 6. Results of the determination coefficient test of motivation
|
R |
R Square |
Adjusted R Square |
SE |
|
0.840 |
0.705 |
0.697 |
9.056 |
The results of the regression analysis show an R value of 0.840, indicating a strong relationship between the independent and dependent variables. R Square of 0.705 means that 70.5% of the variation in the dependent variable can be explained by the independent variables used in the model. The Adjusted R Square value of 0.697 indicates that this model is quite good at explaining data variation, with a slight correction for the number of variables used. SE (Standard Error) of 9.056 indicates the level of prediction error in this model. Overall, this model is quite good at explaining the relationship between the variables analyzed. The motivation analysis model in this study is visualized through the following image. The image systematically illustrates the relationship between the independent variables and the dependent variable (motivation).
4.5 Multiple linear regression community preparedness analysis model
Independent Variables: These are the variables that are assumed to influence other variables in the model. In this figure, the exogenous variables are shown on the left side and are labeled X1 to X15. These variables are: Age (X1), Education (X2), Occupation (X3), Knowledge (X4), Attitude (X5), Length of residence (X6), Residential status (X7), Land/land ownership status (X8), Community perception (X9), Communication (X10), Resources (X11), Institutional attitudes (X12), Bureaucratic structure (X13), Organization (X14), Program implementation (X15) and Motivation (Y). The Dependent Variable is Community Preparedness (Z).
Before conducting the regression analysis, classical assumption testing is required to ensure the validity and reliability of the model used. The classical assumption tests include the normality test (Figure4(A)), the multicollinearity test (Table 7), and the heteroscedasticity test (Figure 4(B)), each of which aims to examine the distribution of data, the relationship between independent variables, and the consistency of residual variance. The following is an explanation of the methods used in testing the classical assumptions in this study.
The Normal P-P Plot shows that the distribution of regression residuals for the variable Readiness is approximately normal, as indicated by the data points generally following the diagonal line, despite the presence of minor and non-significant deviations. Meanwhile, the results of the heteroscedasticity test using a scatterplot demonstrate that the residuals are randomly distributed around the horizontal axis without any discernible pattern, suggesting the absence of heteroscedasticity. Therefore, the assumptions of normality and homoscedasticity in the regression model are met, supporting the validity of the analysis results.
However, the slight deviations observed in the P-P Plot should still be acknowledged as a limitation, as they may indicate minor imperfections in the residual distribution that could affect parameter estimates if the model is applied to a larger sample or a different context. Several studies emphasize that even slight departures from normality or homoscedasticity, while often overlooked, can introduce small biases or affect the robustness of statistical inference—especially in small samples or complex models [46]. As such, the interpretation of regression results should be conducted with caution, considering the possibility of minor biases that may not be visually evident but could impact practical applications or the generalizability of the findings.
Table 7 presents the results of the collinearity analysis, showing the Tolerance and VIF values for each variable. A Tolerance value below 0.1 or a VIF greater than 10 is generally considered an indicator of serious multicollinearity. In this case, variables such as Organization (Tolerance = 0.195; VIF = 5.140) and Program Implementation (Tolerance = 0.178; VIF = 5.628) have relatively low Tolerance and moderately high VIF values, although still below the critical threshold. This suggests a potential for moderate multicollinearity that should be taken into account, as it may affect the stability of regression coefficients and the accuracy of interpretation.
(A)
(B)
Figure 4. Normal probability plot graph and scatterplot graph
Table 7. Multicollinearity test results
|
Variabel |
Collinearity Statistics |
|
|
Tolerance |
VIF |
|
|
(Constant) |
|
|
|
Age |
0.828 |
1.208 |
|
Education |
0.837 |
1.195 |
|
Occupation |
0.964 |
1.037 |
|
Knowledge |
0.638 |
1.568 |
|
Attitude |
0.542 |
1.846 |
|
Length of Residence |
0.871 |
1.149 |
|
Residency Status |
0.859 |
1.165 |
|
Land Ownership Status |
0.852 |
1.174 |
|
Community Perception |
0.695 |
1.440 |
|
Communication |
0.364 |
2.744 |
|
Resources |
0.377 |
2.653 |
|
Institutional Attitude |
0.269 |
3.716 |
|
Bureaucratic Structure |
0.271 |
3.684 |
|
Organization |
0.195 |
5.140 |
|
Program Implementation |
0.178 |
5.628 |
|
Motivation |
0.290 |
3.449 |
Most of the other variables show adequate Tolerance values and low VIFs, indicating no significant multicollinearity issues within the model. However, to improve precision and reduce the risk of bias due to intercorrelation among independent variables, it is advisable to consider approaches such as variable reduction using Principal Component Analysis (PCA) or exploratory factor analysis, and exploring the possibility of merging correlated variables into a single composite construct. Another alternative is to apply variable transformation to minimize redundancy or to revisit the conceptual definitions of each variable [47].
Overall, the classical assumption tests indicate that the regression model meets the requirements for multiple linear regression analysis. Therefore, to examine the relationship between the independent and dependent variables, this study employs multiple linear regression as the primary analytical method. Table 8 presents the results of the multiple regression analysis:
Table 8. Results of the community preparedness analysis model multiple linear regression
|
Step |
Variable |
Unstandardized Coefficients |
t |
Sig. |
|
|
B |
Std. Error |
||||
|
1 |
(Constant) |
-1.416 |
.900 |
-1.573 |
.117 |
|
Age |
.002 |
.007 |
.212 |
.832 |
|
|
Education |
.096 |
.155 |
.623 |
.534 |
|
|
Occupation |
.092 |
.086 |
1.072 |
.285 |
|
|
Knowledge |
.066 |
.038 |
1.708 |
.088 |
|
|
Attitude |
.042 |
.040 |
1.065 |
.288 |
|
|
Length of Residence |
.009 |
.021 |
.425 |
.671 |
|
|
Residency Status |
.058 |
.149 |
.386 |
.699 |
|
|
Land Ownership Status |
-.026 |
.145 |
-.176 |
.860 |
|
|
Community Perception |
.002 |
.041 |
.060 |
.952 |
|
|
Communication |
.015 |
.092 |
.167 |
.868 |
|
|
Resources |
.078 |
.092 |
.850 |
.396 |
|
|
Institutional Attitude |
.195 |
.174 |
1.118 |
.264 |
|
|
Bureaucratic Structure |
.141 |
.170 |
.828 |
.408 |
|
|
Organization |
.021 |
.349 |
.060 |
.952 |
|
|
Program Implementation |
1.103 |
.373 |
2.953 |
.003 |
|
|
Motivation |
.108 |
.007 |
16.137 |
.000 |
|
|
2 |
(Constant) |
-1.413 |
.897 |
-1.575 |
.116 |
|
Age |
.002 |
.007 |
.210 |
.834 |
|
|
Education |
.096 |
.155 |
.622 |
.534 |
|
|
Occupation |
.092 |
.086 |
1.075 |
.283 |
|
|
Knowledge |
.066 |
.038 |
1.745 |
.082 |
|
|
Attitude |
.042 |
.039 |
1.078 |
.282 |
|
|
Length of Residence |
.009 |
.021 |
.430 |
.667 |
|
|
Residency Status |
.059 |
.147 |
.402 |
.688 |
|
|
Land Ownership Status |
-.025 |
.145 |
-.173 |
.863 |
|
|
Communication |
.015 |
.092 |
.168 |
.867 |
|
|
Resources |
.078 |
.091 |
.858 |
.392 |
|
|
Institutional Attitude |
.196 |
.173 |
1.132 |
.258 |
|
|
Bureaucratic Structure |
.141 |
.170 |
.827 |
.409 |
|
|
Organization |
.022 |
.348 |
.064 |
.949 |
|
|
Program Implementation |
1.104 |
.372 |
2.967 |
.003 |
|
|
Motivation |
.108 |
.007 |
16.230 |
.000 |
|
|
3 |
(Constant) |
-1.408 |
.893 |
-1.576 |
.116 |
|
Age |
.002 |
.007 |
.214 |
.831 |
|
|
Education |
.096 |
.154 |
.621 |
.535 |
|
|
Occupation |
.092 |
.086 |
1.077 |
.282 |
|
|
Knowledge |
.066 |
.038 |
1.747 |
.081 |
|
|
Attitude |
.043 |
.039 |
1.090 |
.276 |
|
|
Length of Residence |
.009 |
.021 |
.431 |
.667 |
|
|
Residency Status |
.058 |
.146 |
.400 |
.690 |
|
|
Land Ownership Status |
-.025 |
.144 |
-.177 |
.860 |
|
|
Communication |
.015 |
.092 |
.167 |
.867 |
|
|
Resources |
.079 |
.091 |
.868 |
.386 |
|
|
Institutional Attitude |
.195 |
.172 |
1.133 |
.258 |
|
|
Bureaucratic Structure |
.143 |
.164 |
.872 |
.384 |
|
|
Program Implementation |
1.118 |
.297 |
3.767 |
.000 |
|
|
Motivation |
.109 |
.007 |
16.466 |
.000 |
|
|
4 |
(Constant) |
-1.415 |
.891 |
-1.587 |
.113 |
|
Age |
.002 |
.007 |
.212 |
.832 |
|
|
Education |
.097 |
.154 |
.628 |
.530 |
|
|
Occupation |
.091 |
.085 |
1.066 |
.287 |
|
|
Knowledge |
.066 |
.038 |
1.746 |
.082 |
|
|
Attitude |
.044 |
.039 |
1.135 |
.257 |
|
|
Length of Residence |
.009 |
.020 |
.419 |
.675 |
|
|
Residency Status |
.058 |
.146 |
.395 |
.693 |
|
|
Land Ownership Status |
-.025 |
.144 |
-.173 |
.863 |
|
|
Resources |
.086 |
.081 |
1.063 |
.288 |
|
|
Institutional Attitude |
.196 |
.171 |
1.145 |
.253 |
|
|
Bureaucratic Structure |
.144 |
.164 |
.877 |
.381 |
|
|
Program Implementation |
1.128 |
.291 |
3.884 |
.000 |
|
|
Motivation |
.109 |
.007 |
16.529 |
.000 |
|
|
5 |
(Constant) |
-1.449 |
.868 |
-1.669 |
.096 |
|
Education |
.001 |
.007 |
.206 |
.837 |
|
|
Occupation |
.096 |
.154 |
.626 |
.531 |
|
|
Knowledge |
.090 |
.085 |
1.059 |
.290 |
|
|
Attitude |
.065 |
.037 |
1.740 |
.083 |
|
|
Length of Residence |
.043 |
.038 |
1.126 |
.261 |
|
|
Residency Status |
.008 |
.020 |
.414 |
.679 |
|
|
Land Ownership Status |
.063 |
.142 |
.446 |
.656 |
|
|
Resources |
.085 |
.080 |
1.054 |
.292 |
|
|
Institutional Attitude |
.193 |
.170 |
1.134 |
.258 |
|
|
Bureaucratic Structure |
.144 |
.164 |
.879 |
.380 |
|
|
Program Implementation |
1.128 |
.290 |
3.889 |
.000 |
|
|
Motivation |
.109 |
.007 |
16.640 |
.000 |
|
|
6 |
(Constant) |
-1.337 |
.675 |
-1.981 |
.048 |
|
Education |
.084 |
.142 |
.593 |
.553 |
|
|
Occupation |
.090 |
.085 |
1.063 |
.289 |
|
|
Knowledge |
.065 |
.037 |
1.741 |
.083 |
|
|
Attitude |
.043 |
.038 |
1.121 |
.263 |
|
|
Length of Residence |
.008 |
.020 |
.401 |
.689 |
|
|
Residency Status |
.063 |
.142 |
.442 |
.659 |
|
|
Resources |
.085 |
.080 |
1.055 |
.292 |
|
|
Institutional Attitude |
.195 |
.169 |
1.151 |
.251 |
|
|
Bureaucratic Structure |
.145 |
.164 |
.885 |
.377 |
|
|
Program Implementation |
1.127 |
.290 |
3.890 |
.000 |
|
|
Motivation |
.109 |
.006 |
16.708 |
.000 |
|
|
7 |
(Constant) |
-1.326 |
.673 |
-1.969 |
.050 |
|
Education |
.085 |
.142 |
.596 |
.552 |
|
|
Occupation |
.091 |
.084 |
1.081 |
.281 |
|
|
Knowledge |
.066 |
.037 |
1.764 |
.079 |
|
|
Attitude |
.045 |
.038 |
1.187 |
.236 |
|
|
Residency Status |
.064 |
.141 |
.453 |
.651 |
|
|
Resources |
.084 |
.080 |
1.053 |
.293 |
|
|
Institutional Attitude |
.200 |
.169 |
1.187 |
.236 |
|
|
Bureaucratic Structure |
.150 |
.163 |
.923 |
.357 |
|
|
Program Implementation |
1.124 |
.289 |
3.887 |
.000 |
|
|
Motivation |
.108 |
.006 |
16.726 |
.000 |
|
|
8 |
(Constant) |
-1.233 |
.641 |
-1.925 |
.055 |
|
Education |
.082 |
.142 |
.576 |
.565 |
|
|
Occupation |
.089 |
.084 |
1.057 |
.291 |
|
|
Knowledge |
.066 |
.037 |
1.774 |
.077 |
|
|
Attitude |
.046 |
.038 |
1.230 |
.219 |
|
|
Resources |
.084 |
.080 |
1.048 |
.295 |
|
|
Institutional Attitude |
.199 |
.169 |
1.179 |
.239 |
|
|
Bureaucratic Structure |
.151 |
.163 |
.929 |
.354 |
|
|
Program Implementation |
1.132 |
.288 |
3.926 |
.000 |
|
|
Motivation |
.109 |
.006 |
16.787 |
.000 |
|
|
9 |
(Constant) |
-.915 |
.323 |
-2.828 |
.005 |
|
Occupation |
.090 |
.084 |
1.066 |
.287 |
|
|
Knowledge |
.068 |
.037 |
1.836 |
.067 |
|
|
Attitude |
.047 |
.038 |
1.237 |
.217 |
|
|
Resources |
.086 |
.080 |
1.078 |
.282 |
|
|
Institutional Attitude |
.192 |
.168 |
1.141 |
.255 |
|
|
Bureaucratic Structure |
.156 |
.162 |
.959 |
.338 |
|
|
Program Implementation |
1.133 |
.288 |
3.933 |
.000 |
|
|
Motivation |
.108 |
.006 |
16.793 |
.000 |
|
|
10 |
(Constant) |
-.914 |
.323 |
-2.827 |
.005 |
|
Occupation |
.090 |
.084 |
1.065 |
.288 |
|
|
Knowledge |
.073 |
.037 |
1.984 |
.048 |
|
|
Attitude |
.046 |
.038 |
1.215 |
.225 |
|
|
Resources |
.103 |
.078 |
1.320 |
.188 |
|
|
Institutional Attitude |
.253 |
.155 |
1.625 |
.105 |
|
|
Program Implementation |
1.182 |
.284 |
4.166 |
.000 |
|
|
Motivation |
.110 |
.006 |
17.249 |
.000 |
|
|
11 |
(Constant) |
-.814 |
.309 |
-2.630 |
.009 |
|
Knowledge |
.072 |
.037 |
1.968 |
.050 |
|
|
Attitude |
.044 |
.038 |
1.170 |
.243 |
|
|
Resources |
.102 |
.078 |
1.310 |
.191 |
|
|
Institutional Attitude |
.248 |
.155 |
1.593 |
.112 |
|
|
Program Implementation |
1.179 |
.284 |
4.155 |
.000 |
|
|
Motivation |
.110 |
.006 |
17.453 |
.000 |
|
|
12 |
(Constant) |
-.754 |
.305 |
-2.469 |
.014 |
|
Knowledge |
.084 |
.035 |
2.403 |
.017 |
|
|
Resources |
.105 |
.078 |
1.351 |
.177 |
|
|
Institutional Attitude |
.277 |
.153 |
1.806 |
.072 |
|
|
Program Implementation |
1.210 |
.283 |
4.282 |
.000 |
|
|
Motivation |
.111 |
.006 |
17.647 |
.000 |
|
|
13 |
(Constant) |
-.771 |
.305 |
-2.526 |
.012 |
|
Knowledge |
.088 |
.035 |
2.518 |
.012 |
|
|
Institutional Attitude |
.331 |
.148 |
2.227 |
.027 |
|
|
Program Implementation |
1.236 |
.282 |
4.381 |
.000 |
|
|
Motivation |
.113 |
.006 |
18.565 |
.000 |
|
The regression equation Y = −0.771 + 0.088 (Knowledge) + 0.331 (Institutional attitude) + 1.236 (Program implementation) + 0.113 (Motivation) + Ɛ shows that the variables of knowledge, institutional attitude, program implementation, and motivation have a positive effect on the level of community preparedness. The regression coefficient of 0.088 on the knowledge variable indicates that every one unit increase in knowledge will increase preparedness by 0.088 units, assuming other variables are constant. Similarly, increases in institutional attitude and program implementation each contribute 0.331 and 1.236 to preparedness. The motivation variable also has a positive effect of 0.113. The constant value of -0.771 indicates the value of preparedness when all independent variables are zero. Overall, this model reflects that program implementation is the most dominant factor in increasing community preparedness, followed by institutional attitudes, motivation, and knowledge.
The analysis shows that institutional attitude significantly influences community preparedness. This supports the view that responsive and service-oriented institutions foster a supportive environment for public engagement [19]. The knowledge variable also contributes positively to preparedness. As individuals gain a better understanding of programs, they are more likely to participate. Adequate resources and information improve both implementation efficiency and public perception, which in turn enhance motivation [48]. Moreover, individual motivation plays a key role in promoting preparedness. Individuals with high self-efficacy and a strong belief in the benefits of action are more likely to engage, even when facing external challenges. Overall, these findings highlight the importance of institutional support, knowledge, and personal motivation in strengthening community readiness [49].
After conducting multiple linear regression tests, the next step is to conduct a t-test to test the significance of the influence of each independent variable on the dependent variable, namely motivation, partially. The following is a table of t-test results:
Table 9. Community preparedness t-test results
|
Variabel |
B |
t |
Sig. |
Note |
|
(Constant) |
-1.416 |
-1.573 |
.117 |
|
|
Age |
.002 |
.212 |
.832 |
Not Significant |
|
Education |
.096 |
.623 |
.534 |
Not Significant |
|
Occupation |
.092 |
1.072 |
.285 |
Not Significant |
|
Knowledge |
.066 |
1.708 |
.088 |
Not Significant |
|
Attitude |
.042 |
1.065 |
.288 |
Not Significant |
|
Length of Residence |
.009 |
.425 |
.671 |
Not Significant |
|
Residency Status |
.058 |
.386 |
.699 |
Not Significant |
|
Land Ownership Status |
-.026 |
-.176 |
.860 |
Not Significant |
|
Community Perception |
.002 |
.060 |
.952 |
Not Significant |
|
Communication |
.015 |
.167 |
.868 |
Not Significant |
|
Resources |
.078 |
.850 |
.396 |
Not Significant |
|
Institutional Attitude |
.195 |
1.118 |
.264 |
Not Significant |
|
Bureaucratic Structure |
.141 |
.828 |
.408 |
Not Significant |
|
Organization |
.021 |
.060 |
.952 |
Not Significant |
|
Program Implementation |
1.103 |
2.953 |
.003 |
Significant |
|
Motivation |
.108 |
16.137 |
.000 |
Significant |
Based on Table 9, it can be seen that the results of the regression analysis show that most demographic, social, and structural variables such as age, education, occupation, knowledge, attitude, length of residence, population status, land/land ownership status, community perception, communication, resources, institutional attitudes, bureaucratic structure, and organization do not have a significant effect on community preparedness. This finding indicates that these factors are not strong enough to directly encourage preparedness in the context of this study.
On the contrary, program implementation and community motivation emerge as two primary factors that significantly enhance preparedness. Effective implementation ensures that interventions, education, and resources are well-targeted and consistently delivered. Emphasize the importance of evidence-based and community-driven programs in strengthening preparedness. Community motivation also plays a crucial role, as preparedness is influenced not only by knowledge but also by individuals’ awareness and internal drive to take preventive action [50]. Found that intrinsic motivation and risk perception significantly shape disaster preparedness behavior. The relevance of the Theory of Planned Behavior further reinforces this, suggesting that attitudes, perceived norms, and behavioral control shape intentions and actions in risk contexts [51].
Well-designed mitigation programs, combined with adequate social support, build both community capacity and self-confidence in facing disaster threats. In this regard, motivation acts as a key driver of sustained engagement. Therefore, enhancing community preparedness requires a dual focus: improving program implementation through participatory and empowering approaches, and strengthening motivation via effective education, risk communication, and the development of robust social networks. While demographic and social factors provide important context, they are insufficient without targeted interventions and internal motivation [52].
Next, an F test is conducted, which aims to test the significance of the influence of all independent variables simultaneously on the dependent variable, namely motivation. The F test is used to determine whether the regression model built as a whole is able to explain the variability of motivation significantly. The results of the F test analysis can be seen in Table 10:
Table 10. Results of the F test community preparedness
|
Model |
Sum of Squares |
df |
Mean Square |
F |
P Value |
|
Regression |
2349.799 |
4 |
587.450 |
448.108 |
0.000n |
|
Residual |
487.676 |
372 |
1.311 |
|
|
|
Total |
2837.475 |
376 |
|
|
|
Based on Table 10, it can be seen that the F Test in the regression analysis is used to test whether the independent variables in the model simultaneously have a significant effect on the dependent variable, namely community preparedness. The results of the F test show an F value of 448.108 with a p-value of 0.000 (p < 0.001), which means that the regression model used is statistically very significant in explaining variations in community preparedness.
This very large F value indicates that the combination of independent variables in the model together has a real influence on community preparedness, so that the regression model is suitable for use in predicting preparedness. This indicates that these variables are collectively able to explain differences in preparedness among individuals or groups in society.
Test of determination coefficient (R²). This test provides information about the strength of the regression model in explaining the proportion of variability in motivation caused by changes in independent variables. The results of the determination coefficient test can be seen in Table 11:
Table 11. Results of the community preparedness determination coefficient test
|
R |
R Square |
Adjusted R Square |
SE |
|
0.910 |
0.828 |
0.826 |
1.145 |
The multiple determination coefficient (R2) from Table 11 shows that the results of the regression analysis show an R value of 0.910, which indicates a very strong relationship between the independent and dependent variables. R Square of 0.828 means that 82.8% of the variation in the dependent variable can be explained by the independent variables in the model. The Adjusted R Square value of 0.826 indicates that this model is good at explaining the data, with little adjustment for the number of variables used. The SE (Standard Error) of 1.145 indicates a relatively low level of prediction error, indicating good model accuracy. Overall, this model is very good at explaining the relationship between the variables analyzed.
4.6 Community preparedness analysis model with motivation mediation
Path analysis is a development of multiple linear regression used to identify direct and indirect influences between variables. In this study, path analysis was used to evaluate the influence of various factors on community preparedness, with motivation as a mediating variable. The results of the analysis showed that of all the independent variables, only program implementation had a direct and significant influence on community preparedness. Meanwhile, motivation was significantly influenced by the variables of work, knowledge, resources, institutional attitudes, bureaucratic structure, organization, and program implementation. In addition, motivation was proven to have a significant influence on community preparedness, indicating a mediating role. This model emphasizes the importance of program implementation and increasing community motivation in strengthening preparedness.
The results of the analysis show that the bureaucratic structure has a fairly large influence on motivation with a coefficient of 0.356, and has a direct influence on community preparedness of 0.076. Meanwhile, the variables of organization and program implementation show a relatively small direct influence on motivation (0.001 and 0.033 respectively) and community preparedness (0.117 respectively). However, motivation as a mediating variable has a very significant influence on community preparedness, with a coefficient of 0.927. This finding indicates that motivation is the main factor that strengthens the influence of other variables on community preparedness.
This discussion aligns with recent research emphasizing the critical role of bureaucratic structure in facilitating community motivation through effective administrative support and coordination. A study found that a clear and responsive bureaucracy enhances public trust and encourages active participation in preparedness programs [53]. Although the variables of organization and program implementation showed limited direct effects, the overall effectiveness of implementation remains crucial for delivering resources and education that trigger motivation. As highlighted, structured program management contributes to increased trust and public commitment, while successful implementation enhances individuals’ self-efficacy—an essential factor for sustained action [54].
Base on Figure 5, importantly, motivation functions as a mediating variable linking structural factors to preparedness outcomes. Drawing from the theory of motivation and social behavior, both intrinsic and extrinsic motivations promote consistent preparedness behaviors when supported by enabling environments, such as effective organizational frameworks and program structures [55]. This is supported by path analysis results, which confirm that motivation significantly mediates the influence of program implementation (X15) and organization (X14) on preparedness (Z). The strongest indirect effects occur through these two variables, suggesting that well-designed and organized programs can substantially elevate motivation, which in turn enhances community preparedness. Effective communication and high motivation are key to the success of preparedness initiatives. Communication builds public awareness, strengthens commitment, and facilitates collective engagement in disaster risk reduction [56].
In addition, the organization variable (X14)—reflecting the role of community groups and social structures—also has a notable impact on both motivation and preparedness. Strong organizations enable information sharing, foster collective attitudes, and reinforce social cohesion, all of which are central to building preparedness [57]. Other supporting variables include institutional attitude (X12) and bureaucratic structure (X13), which reflect institutional responsiveness and governance quality. Institutional support strengthens public capabilities and resource access—key elements for community resilience. Finally, variables such as occupation (X3), knowledge (X4), and resources (X11) provide moderate contributions. Emphasized that socio-economic conditions, adequate information, and access to resources are foundational for fostering preparedness [58].
Base on Table 12, direct influence path analysis that variables with small effects and marginal significance, such as Attitude (X5), suggest that individual attitudes contribute to preparedness, but likely require reinforcement from other enabling factors to yield significant impact. In contrast, variables such as Education (X2), Land Ownership Status (X8), and Community Perception (X9) show insignificant negative effects. These results may reflect the complexity of social dynamics and localized contextual factors that are not fully captured by the current model. Supporting this interpretation, argue that lived experience and continuous program engagement can gradually improve public knowledge, awareness, and proactive behavior in disaster preparedness. This reinforces the conclusion that robust program implementation and strong organizational support are essential drivers of preparedness, primarily through their influence on motivation [59].
Overall, the findings underscore the critical role of institutional and organizational variables and highlight motivation as a central mediating mechanism linking structural factors to community preparedness. An integrated intervention strategy that focuses on enhancing motivation is therefore considered more effective in achieving sustainable improvements in community preparedness. To gain deeper insight into the model's dynamics, both indirect and total effects were calculated. Indirect effects refer to the influence of an independent variable on the dependent variable that occurs through one or more mediators. In this case, certain variables may not exhibit direct effects on preparedness, but they exert influence indirectly through motivation and other interconnected factors within the model [60].
Figure 5. Results of community preparedness analysis model with motivation mediation
Table 12. Results of direct influence path analysis
|
Path Analysis |
Coefficient |
Sig. |
|
Age → Motivation |
-0.100 |
0.079 |
|
Education → Motivation |
-1.555 |
0.199 |
|
Occupation → Motivation |
1.494 |
0.026 |
|
Knowledge → Motivation |
0.909 |
0.002 |
|
Attitude → Motivation |
0.538 |
0.083 |
|
Length of Residence → Motivation |
-0.103 |
0.523 |
|
Residency Status → Motivation |
1.152 |
0.323 |
|
Land Ownership Status → Motivation |
-1.678 |
0.139 |
|
Community Perception → Motivation |
-0.596 |
0.066 |
|
Communication → Motivation |
0.888 |
0.219 |
|
Resources → Motivation |
1.948 |
0.006 |
|
Institutional Attitude → Motivation |
3.113 |
0.022 |
|
Bureaucratic Structure → Motivation |
3.273 |
0.014 |
|
Organization → Motivation |
8.335 |
0.002 |
|
Program Implementation → Motivation |
10.197 |
0.000 |
|
Age → Community Preparedness |
0.002 |
0.832 |
|
Education → Community Preparedness |
0.096 |
0.534 |
|
Occupation → Community Preparedness |
0.092 |
0.285 |
|
Knowledge → Community Preparedness |
0.066 |
0.088 |
|
Attitude → Community Preparedness |
0.042 |
0.288 |
|
Length of Residence → Community Preparedness |
0.009 |
0.671 |
|
Residency Status → Community Preparedness |
0.058 |
0.699 |
|
Land Ownership Status → Community Preparedness |
-0.026 |
0.860 |
|
Community Perception → Community Preparedness |
0.002 |
0.952 |
|
Communication → Community Preparedness |
0.015 |
0.868 |
|
Resources → Community Preparedness |
0.078 |
0.396 |
|
Institutional Attitude → Community Preparedness |
0.195 |
0.264 |
|
Bureaucratic Structure → Community Preparedness |
0.141 |
0.408 |
|
Organization → Community Preparedness |
0.021 |
0.952 |
|
Program Implementation → Community Preparedness |
1.103 |
0.003 |
|
Motivation → Community Preparedness |
0.108 |
0.000 |
The results of the path analysis reveal a complex network of indirect relationships between independent variables (X1–X15) and community preparedness (Z), with motivation (Y) acting as a central mediating variable. This supports theoretical frameworks which assert that disaster preparedness is not solely shaped by individual or environmental characteristics but is strongly influenced by psychosocial factors, particularly motivation. Program Implementation (X15) and Organization (X14) showed very large indirect effects (≥ 0.5), with coefficients of 1.244 and 1.009 respectively (p < 0.01). These results underscore the pivotal role of well-planned, community-based programs and active local organizations in generating collective motivation, thereby enhancing preparedness. This aligns, who emphasize that the success of disaster policies largely depends on local participation and effective grassroots implementation [53].
Base on Table 13, Large indirect effects (0.3–0.49) were also observed for Institutional Attitude (X12) and Bureaucratic Structure (X13), indicating that trust in responsive institutions significantly enhances internal motivation. Moderate effects (0.1–0.29) were found for Occupation (X3), Knowledge (X4), Residential Status (X7), Communication (X10), and Resources (X11). Notably, knowledge and communication play key roles in shaping risk perception and triggering action [61]. Availability of resources and employment status also influence individuals' sense of efficacy, which contributes to readiness. The Attitude variable (X5) demonstrated only a small effect (0.01–0.09), suggesting that while positive attitudes contribute, they are insufficient without contextual support such as knowledge or community structure [62]. This supports the argument that attitude alone is not a strong predictor of preparedness.
Table 13. Results of indirect influence path analysis
|
Path Analysis |
Indirect Effects |
Total Effect |
|
Age → Motivation → Community Preparedness |
-0.100 × 0.108 = -0.011 |
0.002 + (-0.100 × 0.108) = -0.009 |
|
Education → Motivation → Community Preparedness |
-1.555 × 0.108 = -0.169 |
0.096 + (-1.555 × 0.108) = -0.073 |
|
Occupation → Motivation → Community Preparedness |
1.494 × 0.108 = 0.164 |
0.092 + (1.494 × 0.108) = 0.256 |
|
Knowledge → Motivation → Community Preparedness |
0.909 × 0.108 = 0.101 |
0.066 + (0.909 × 0.108) = 0.167 |
|
Attitude → Motivation → Community Preparedness |
0.538 × 0.108 = 0.060 |
0.042 + (0.538 × 0.108) = 0.102 |
|
Length of Residence → Motivation → Community Preparedness |
-0.103 × 0.108 = -0.012 |
0.009 + (-0.103 × 0.108) = -0.003 |
|
Residency Status → Motivation → Community Preparedness |
1.152 × 0.108 = 0.131 |
0.058 + (1.152 × 0.108) = 0.189 |
|
Land Ownership Status → Motivation → Community Preparedness |
-1.678 × 0.108 = -0.193 |
-0.026 + (-1.678 × 0.108) = -0.219 |
|
Community Perception → Motivation → Community Preparedness |
-0.596 × 0.108 = -0.069 |
0.002 + (-0.596 × 0.108) = -0.067 |
|
Communication → Motivation → Community Preparedness |
0.888 × 0.108 = 0.104 |
0.015 + (0.888 × 0.108) = 0.119 |
|
Resources → Motivation → Community Preparedness |
1.948 × 0.108 = 0.230 |
0.078 + (1.948 × 0.108) = 0.308 |
|
Institutional Attitude → Motivation → Community Preparedness |
3.113 × 0.108 = 0.370 |
0.195 + (3.113 × 0.108) = 0.565 |
|
Bureaucratic Structure → Motivation → Community Preparedness |
3.273 × 0.108 = 0.393 |
0.141 + (3.273 × 0.108) = 0.534 |
|
Organization → Motivation → Community Preparedness |
8.335 × 0.108 = 1.009 |
0.021 + (8.335 × 0.108) = 1.030 |
|
Program Implementation → Motivation → Community Preparedness |
10.197 × 0.108 = 1.244 |
1.103 + (10.197 × 0.108) = 2.347 |
Several variables exhibited negative indirect effects, notably Education (X2), Land Ownership (X8), and Community Perception (X9). The strongest negative effect was from X8, reflecting that land tenure insecurity reduces community participation and motivation—consistent with, who found that land conflicts weaken social cohesion and readiness [63]. Demographic factors like Age (X1) and Length of Stay (X6) had small, non-significant negative effects, reinforcing the idea that such variables are contextual and exert limited influence unless considered alongside social and psychological factors [64].
In sum, these findings confirm that motivation (Y) is a dominant mediator that translates structural, social, and individual factors into preparedness behavior. Effective interventions must prioritize strengthening motivation through enhanced program implementation, active community organizations, bureaucratic reforms, and institutional responsiveness—identified here as the most influential pathways to improved disaster preparedness [65].
4.7 Importance performance map analysis
In research using PLS-SEM, it is recommended to conduct further analysis to provide clear managerial implications regarding management priorities and attention. One method used is the Importance Performance Map Analysis (IPMA), which combines two dimensions, namely the level of importance of variables or indicators (importance) and their actual performance (performance) against the dependent variable or target construct in the model. With this approach, IPMA helps identify variables or indicators that are considered important by respondents and evaluate their performance, so that management can make data-based decisions and avoid erroneous assumptions. The IPMA process integrates descriptive analysis in the form of average performance values and inferential analysis in the form of total effects, which are then plotted in a quadrant map based on the X axis (importance/total effect) and the Y axis (performance/satisfaction). This mapping makes it easier to group variables or indicators into categories that need to be maintained or improved. IPMA results are presented in two forms, namely the construct level and the more detailed indicator level, providing comprehensive strategic guidance for management [66].
Based on Table 14, the average value (mean) for the importance of the employee performance construct is 0.224, while the mean for performance is 49.88. Values below this average are categorized as low, while values above the average are considered high. Using these two mean values, two dividing lines are created that divide the mapping graph into four quadrants, as shown in Figure 6. This IPMA analysis allows the identification of variables or factors that have shown good performance and need to be maintained, as well as factors that still need improvement. The explanation of each quadrant is as follows [67]: Quadrant I (top right) shows variables that are important and have performed well; Quadrant II (bottom right) includes variables that are important but still perform poorly; Quadrant III (bottom left) contains variables that are not important and also perform poorly; while Quadrant IV (top left) contains variables that are not important but have shown good performance. This approach provides a strategic framework for management in determining performance development priorities.
Table 14. Specific indirect effect results
|
Variable |
Construct Importance for Community Preparedness |
Construct Performances for Community Preparedness |
|
Communication |
0.151 |
94.58 |
|
Resources |
0.346 |
93.611 |
|
Institutional Attitude |
-0.018 |
95.052 |
|
Bureaucratic Structure |
0.262 |
94.389 |
|
Organization |
-0.341 |
94.289 |
|
Program Implementation |
0.267 |
94.012 |
|
Motivation |
0.315 |
85.172 |
|
Mean |
0.14 |
93.02 |
The Importance–Performance Map Analysis (IPMA) offers a strategic overview of management priorities in enhancing community preparedness. In Quadrant I, key factors such as Communication, Resources, Bureaucratic Structure, and Program Implementation are identified as both important and high-performing. These variables significantly contribute to preparedness and are being implemented effectively. Sustaining and further enhancing performance in these areas is therefore essential. Effective communication and resource management form the foundation of disaster preparedness, while a well-structured bureaucracy ensures responsive coordination and consistent program delivery [68]. In contrast, Quadrant II highlights Motivation as a highly important but underperforming factor. This indicates an urgent need to focus on strengthening community motivation to achieve more substantial improvements in preparedness. Emphasize that motivation is a key psychological driver of adaptive behavior in disaster contexts, which can be enhanced through targeted education and strong social support [69]. Accordingly, boosting motivation should be prioritized in preparedness strategies. Quadrant IV includes Institutional Attitudes and Organizational Attitudes, which, although well-executed, show relatively low impact on preparedness. This suggests the need for greater efficiency in allocating resources to these aspects. Strategic management framework, investments should be focused on areas with the highest value-added contribution to outcomes [70].
Based on the results of multiple linear regression analysis and path analysis, it can be concluded that the model used has met the classical assumptions and is strong enough to explain community preparedness, with Results showed R² = 0.705 for the motivation model and R² = 0.828 for the preparedness model, indicating that 70.5% and 82.8% of the variation in each respective variable can be explained by the model. Motivation emerged as a dominant mediator with a coefficient of β = 0.927, strengthening the influence of structural factors on preparedness. IPMA positioned communication, resources, bureaucratic structure, and program implementation in the high-importance, high-performance quadrant, indicating the need for maintenance. In contrast, motivation appeared in the high-importance, low-performance quadrant, highlighting it as a priority area for intervention. Institutional and organizational attitudes showed good performance but low contribution, suggesting the need for managerial optimization to focus resources on more strategic aspects. These findings recommend participatory policies centered on strengthening community motivation and improving field program effectiveness to enhance collective preparedness. Community-based early warning systems, initial fire suppression training, environmentally friendly economic incentives, and inclusive risk communication campaigns are suggested to boost motivational performance and ensure a swift response when fire risks are detected at the local level.
[1] Abunyewah, M., Erdiaw-Kwasie, M.O., Okyere, S.A., Thayaparan, G., Byrne, M., Lassa, J., Zander, K.K., Fatemi, M.N., Maund, K. (2023). Influence of personal and collective social capital on flood preparedness and community resilience: Evidence from Old Fadama, Ghana. International Journal of Disaster Risk Reduction, 94: 103790. https://doi.org/10.1016/j.ijdrr.2023.103790
[2] Alqudah, I.H.A., Carballo-Penela, A., Ruzo-Sanmartín, E. (2022). High-performance human resource management practices and readiness for change: An integrative model including affective commitment, employees’ performance, and the moderating role of hierarchy culture. European Research on Management and Business Economics, 28(1): 100177. https://doi.org/10.1016/j.iedeen.2021.100177
[3] Ardiyanto, S.Y., Andrikasmi, S. (2022). Prevention, control and law enforcement forest and land burning in Riau Province. In Proceedings of the 2nd Riau Annual Meeting on Law and Social Sciences (RAMLAS 2021), pp. 90-94. https://doi.org/10.2991/assehr.k.220406.021
[4] Askari, E., Savari, M., Rezaei, M. (2025). Factors affecting the application of protective measures before flood occurrence among local communities in Iran. Climate Risk Management, 49: 100730. https://doi.org/10.1016/j.crm.2025.100730
[5] Astuti, R., Fatimah, Y.A. (2024). Science in the court: Expert knowledge and forest fires on Indonesia’s plantations. Environmental Science and Policy, 151: 103631. https://doi.org/10.1016/j.envsci.2023.103631
[6] Berkman, E.T. (2018). The neuroscience of goals and behavior change. Consulting Psychology Journal, 70(1): 28-44. https://doi.org/10.1037/cpb0000094
[7] Bolan, S., Sharma, S., Mukherjee, S., Isaza, D.F.G., Rodgers, E.M., Zhou, P., Hou, D., Scordo, F., Chandra, S., Siddique, K.H.M., Bolan, N. (2025). Wildfires under changing climate, and their environmental and health impacts. Journal of Soils and Sediments. https://doi.org/10.1007/s11368-025-04020-y
[8] Borjigin, N., Cruz, A.M., Orduz, L.P. (2024). Understanding managers’ motivation in adopting protective measures: Preventing supply chain disruptions from flood-related Natechs. International Journal of Disaster Risk Reduction, 114: 104985. https://doi.org/10.1016/j.ijdrr.2024.104985
[9] Van den Broeck, A., Howard, J.L., Van Vaerenbergh, Y., Leroy, H., Gagné, M. (2021). Beyond intrinsic and extrinsic motivation: A meta-analysis on self-determination theory’s multidimensional conceptualization of work motivation. Organizational Psychology Review, 11(3): 240-273. https://doi.org/10.1177/20413866211006173
[10] Brown, G., Kyttä, M., Reed, P. (2022). Using community surveys with participatory mapping to monitor comprehensive plan implementation. Landscape and Urban Planning, 218: 104306. https://doi.org/10.1016/j.landurbplan.2021.104306
[11] Chan, J.Y., Leow, S.M.H., Bea, K.T., Cheng, W.K., Phoong, S.W., Hong, Z.W., Chen, Y.L. (2022). Mitigating the multicollinearity problem and its machine learning approach: A review. Mathematics, 10(8): 1283. https://doi.org/10.3390/math10081283
[12] Chicco, D., Warrens, M.J., Jurman, G. (2021). The coefficient of determination R-squared is more informative than SMAPE, MAE, MAPE, MSE and RMSE in regression analysis evaluation. PeerJ Computer Science, 7: 1-24. https://doi.org/10.7717/PEERJ-CS.623
[13] Craig-Scheckman, M., Ishiwatari, M., Aldrich, D.P. (2025). State, market, or community? Exploring public perceptions of disaster management strategies. Natural Hazards Research. https://doi.org/10.1016/j.nhres.2025.03.012
[14] Creswell, J.W., Poth, C.N. (2018). Qualitative Inquiry and Research Design: Choosing among Five Approaches (4th ed.). Thousand Oaks, CA: SAGE Publications.
[15] Cvetković, V.M. (2024). Community-based disaster risk reduction. Vladimir. https://doi.org/10.20944/preprints202408.1544.v1
[16] Das, M., Becker, J., Doyle, E.E.H. (2024). Fostering civic participation and collective actions for disaster risk reduction: Insights from Aotearoa New Zealand case studies. International Journal of Disaster Risk Reduction, 114: 104954. https://doi.org/10.1016/j.ijdrr.2024.104954
[17] Dinh, H.H., Basnet, S., Wesseler, J. (2023). Impact of land tenure security perception on tree planting investment in Vietnam. Land, 12(2): 503. https://doi.org/10.3390/land12020503
[18] Dushkova, D., Ivlieva, O. (2024). Empowering communities to act for a change: A review of the community empowerment programs towards sustainability and resilience. Sustainability, 16(19): 8700. https://doi.org/10.3390/su16198700
[19] Ehrnrooth, M., Barner-Rasmussen, W., Koveshnikov, A., Törnroos, M. (2021). A new look at the relationships between transformational leadership and employee attitudes—Does a high-performance work system substitute and/or enhance these relationships? Human Resource Management, 60(3): 377-398. https://doi.org/10.1002/hrm.22024
[20] Elkady, S., Hernantes, J., Labaka, L. (2024). Decision-making for community resilience: A review of decision support systems and their applications. Heliyon, 10(12): e33116. https://doi.org/10.1016/j.heliyon.2024.e33116
[21] Fan, D., Maliki, N.Z.B., Yu, S., Men, T. (2025). Assessment of resilience and key drivers of Tibetan villages in Western Sichuan. Scientific Reports, 15(1): 20594. https://doi.org/10.1038/s41598-025-07788-8
[22] Fathoni, M., Rachmawati, T.A., Dewi, E.S., Djati, A.P., Lestari, S., Yusuf, A., Waluyo, C.S. (2022). The preparedness of disaster among nurses in community health centers in rural areas during the COVID-19 pandemic in Malang City. Enfermería Clínica, 32(2): S54-S57. https://doi.org/10.1016/j.enfcli.2022.03.018
[23] Fazeli, S., Rashidi, T.H., Mojtahedi, M., Haghani, M. (2025). Measuring individual preparedness for flood and bushfire emergencies. International Journal of Disaster Risk Reduction, 127: 105651. https://doi.org/10.1016/j.ijdrr.2025.105651
[24] Feng, C., Feng, C., Li, L., Sadeghpour, A. (2020). A comparison of residual diagnosis tools for diagnosing regression models for count data. BMC Medical Research Methodology, 20(1): 175. https://doi.org/10.1186/s12874-020-01055-2
[25] Gamariel, M., Nkurunziza, N. (2021). Community participation and the performance of project implementation in Bumbogo Vup, Rwanda. International Journal of Social Science and Humanities Research, 9(3): 261-267.
[26] Ha, V.H., Dinh, N.C., Mizunoya, T. (2025). Staying or leaving: Unraveling the dynamics of evacuation decisions among floodplain residents in central Vietnam. International Journal of Disaster Risk Reduction, 119: 105315. https://doi.org/10.1016/j.ijdrr.2025.105315
[27] Handoyo, S. (2024). Public governance and national environmental performance nexus: Evidence from cross-country studies. Heliyon, 10(23): e40637. https://doi.org/10.1016/j.heliyon.2024.e40637
[28] Hauff, S., Richter, N.F., Sarstedt, M., Ringle, C.M. (2024). Importance and performance in PLS-SEM and NCA: Introducing the combined importance-performance map analysis (cIPMA). Journal of Retailing and Consumer Services, 78: 103723. https://doi.org/10.1016/j.jretconser.2024.103723
[29] Islam, M., Islam, K., Dalal, K., Hossain Hawlader, M.D. (2024). In-house environmental factors and childhood acute respiratory infections in under-five children: A hospital-based matched case-control study in Bangladesh. BMC Pediatrics, 24(1): 38. https://doi.org/10.1186/s12887-024-04525-4
[30] Jarantow, S.W., Pisors, E.D., Chiu, M.L. (2023). Introduction to the use of linear and nonlinear regression analysis in quantitative biological assays. Current Protocols, 3(6): e801. https://doi.org/10.1002/cpz1.801
[31] Joseph, C., Maluka, S.O. (2021). The influence of community factors in the implementation of community-based interventions to improve antenatal care: A qualitative study based on the IMCHA programme in Tanzania. Reproductive Health, 18(1): 1-14. https://doi.org/10.1186/s12978-021-01225-5
[32] Kim, T., Cho, W. (2024). Employee voice opportunities enhance organizational performance when faced with competing demands. Review of Public Personnel Administration, 44(4): 713-739. https://doi.org/10.1177/0734371X231190327
[33] Korhonen, J., Miettinen, J., Kylkilahti, E., Tuppura, A., Autio, M., Lähtinen, K., Pätäri, S., Pekkanen, T.L., Luhas, J., Mikkilä, M., Linnanen, L., Ollikainen, M., Toppinen, A. (2021). Development of a forest-based bioeconomy in Finland: Insights on three value networks through expert views. Journal of Cleaner Production, 299: 126867. https://doi.org/10.1016/j.jclepro.2021.126867
[34] Krauter, J. (2023). New perspectives on leaders’ motivational and emotional experiences and the role of basic psychological needs not to fail organizational change in a multi-crisis context—A content analysis. Open Journal of Leadership, 12(3): 258-310. https://doi.org/10.4236/ojl.2023.123014
[35] Kusa, R., Duda, J., Suder, M. (2021). Explaining SME performance with fsQCA: The role of entrepreneurial orientation, entrepreneur motivation, and opportunity perception. Journal of Innovation and Knowledge, 6(4): 234-245. https://doi.org/10.1016/j.jik.2021.06.001
[36] Lee, M.T., Raschke, R.L. (2016). Understanding employee motivation and organizational performance: Arguments for a set-theoretic approach. Journal of Innovation and Knowledge, 1(3): 162-169. https://doi.org/10.1016/j.jik.2016.01.004
[37] Lim, J.Y., Moon, K.K. (2025). The public service motivation’s impact on turnover intention in Korean public organizations: Do perceived organizational politics matter? Behavioral Sciences, 15(4): 474. https://doi.org/10.3390/bs15040474
[38] Lim, W.M. (2025). What is qualitative research? An overview and guidelines. Australasian Marketing Journal, 33(2): 199-229. https://doi.org/10.1177/14413582241264619
[39] McCarter, C.P.R., Clay, G.D., Wilkinson, S.L., Sigmund, G., Davidson, S.J., Taufik, M., Page, S., Shuttleworth, E.L., McLagan, D., Chenier, G., Clark, A., Waddington, J.M. (2024). Peat fires and legacy toxic metal release: An integrative biogeochemical and ecohydrological conceptual framework. Earth-Science Reviews, 256: 104867. https://doi.org/10.1016/j.earscirev.2024.104867
[40] Memon, M.A., Ramayah, T., Cheah, J.H., Ting, H., Chuah, F., Cham, T.H. (2021). Pls-sem statistical programs: A review. Journal of Applied Structural Equation Modeling, 5(1): i–xiv. https://doi.org/10.47263/JASEM.5(1)06
[41] Murayama, K., von Keyserlingk, L. (2025). A critical analysis of the current motivation theories in educational psychology: Why the same theories continue to dominate. Educational Psychologist, 1-16. https://doi.org/10.1080/00461520.2025.2473894
[42] Naveed, R.T., Alhaidan, H., Al Halbusi, H., Al-Swidi, A.K. (2022). Do organizations really evolve? The critical link between organizational culture and organizational innovation toward organizational effectiveness: Pivotal role of organizational resistance. Journal of Innovation and Knowledge, 7(2): 100178. https://doi.org/10.1016/j.jik.2022.100178
[43] Ni, M., Xia, L., Wang, X., Wei, Y., Han, X., Liu, Y., Pan, S. (2025). Psychological influences and implications for household disaster preparedness: A systematic review. Frontiers in Public Health, 13: 1-13. https://doi.org/10.3389/fpubh.2025.1457406
[44] Ogahara, Z., Jespersen, K., Theilade, I., Nielsen, M.R. (2022). Review of smallholder palm oil sustainability reveals limited positive impacts and identifies key implementation and knowledge gaps. Land Use Policy, 120: 106258. https://doi.org/10.1016/j.landusepol.2022.106258
[45] Ogie, R.I., James, S., Moore, A., Dilworth, T., Amirghasemi, M., Whittaker, J. (2022). Social media use in disaster recovery: A systematic literature review. International Journal of Disaster Risk Reduction, 70: 102783. https://doi.org/10.1016/j.ijdrr.2022.102783
[46] Oktari, R.S., Sofyan, H., Hidayati, A., Rolanda, R., Syamsidik, Puturuhu, F., Sasaki, D. (2025). Enhancing coastal community preparedness: The role of education, experience, and exposure to information. Progress in Disaster Science, 26: 100429. https://doi.org/10.1016/j.pdisas.2025.100429
[47] P. Vatcheva, K., Lee, M. (2016). Multicollinearity in regression analyses conducted in epidemiologic studies. Epidemiology: Open Access, 6(2): 1-20. https://doi.org/10.4172/2161-1165.1000227
[48] Pham, T.P.T., Van Nguyen, T., Van Nguyen, P., Ahmed, Z.U. (2024). The pathways to innovative work behavior and job performance: Exploring the role of public service motivation, transformational leadership, and person-organization fit in Vietnam’s public sector. Journal of Open Innovation: Technology, Market, and Complexity, 10(3): 100315. https://doi.org/10.1016/j.joitmc.2024.100315
[49] Purnamasari, R., Hasanudin, A.I., Zulfikar, R., Yazid, H. (2025). Technological infrastructure and financial resource availability in enhancing public services and government performance: The role of digital innovation adoption in Indonesia. Social Sciences and Humanities Open, 11: 101621. https://doi.org/10.1016/j.ssaho.2025.101621
[50] Raharja, S., Marimin, Machfud, Papilo, P., Safriyana, Massijaya, M.Y., Asrol, M., Darmawan, M.A. (2020). Institutional strengthening model of oil palm independent smallholder in Riau and Jambi Provinces, Indonesia. Heliyon, 6(5): e03875. https://doi.org/10.1016/j.heliyon.2020.e03875
[51] Rashed, R.Q.G., Abubakar, A.A., Madani, O., Al-Mamary, Y.H. (2025). Enhancing student engagement and motivation for sustainable education: The role of internship and institutional support. Sustainability, 17(12): 5291. https://doi.org/10.3390/su17125291
[52] Rizwan, A., Hendarso, Y., Saptawan, A., Damiri, N. (2025). Model of collaborative for forest and land fire prevention and management in Ogan Komering Ilir regency South Sumatra Province Indonesia. International Journal of Innovative Research and Scientific Studies, 8(5): 536-543. https://doi.org/10.53894/ijirss.v8i5.8764
[53] Rosopa, P.J., Schaffer, M.M., Schroeder, A.N. (2013). Managing heteroscedasticity in general linear models. Psychological Methods, 18(3): 335-351. https://doi.org/10.1037/a0032553
[54] Rossi, A., Lenzini, G. (2020). Transparency by design in data-informed research: A collection of information design patterns. Computer Law and Security Review, 37: 105402. https://doi.org/10.1016/j.clsr.2020.105402
[55] Roustaei, N. (2024). Application and interpretation of linear-regression analysis. Medical Hypothesis, Discovery, and Innovation in Ophthalmology, 13(3): 151-159. https://doi.org/10.51329/mehdiophthal1506
[56] Salloum, S.A., Bettayeb, A., Salloum, A., Aburayya, A., Khadragy, S., Hamoudi, R., Alfaisal, R. (2023). Novel machine learning based approach for analysing the adoption of metaverse in medical training: A UAE case study. Informatics in Medicine Unlocked, 42: 101354. https://doi.org/10.1016/j.imu.2023.101354
[57] Saputra, E. (2019). Beyond fires and deforestation: Tackling land subsidence in peatland areas, A case study from Riau, Indonesia. Land, 8(5): 76. https://doi.org/10.3390/land8050076
[58] Sarani, A., Malmir, A. (2020). Multiple intelligences as predictors of foreign language pragmatic knowledge: The case of five frequent English speech acts. Teaching English Language, 14(1): 183-211. https://doi.org/10.22132/tel.2020.107876
[59] Scholze, A., Hecker, A. (2024). The job demands-resources model as a theoretical lens for the bright and dark side of digitization. Computers in Human Behavior, 155: 108177. https://doi.org/10.1016/j.chb.2024.108177
[60] Shatz, I. (2024). Assumption-checking rather than (just) testing: The importance of visualization and effect size in statistical diagnostics. Behavior Research Methods, 56(2): 826-845. https://doi.org/10.3758/s13428-023-02072-x
[61] Sinaga, E.M. (2023). The influence of price on purchase decision with quality of service as intervening variable. JPPI (Jurnal Penelitian Pendidikan Indonesia), 9(1): 125-133. https://doi.org/10.29210/020221734
[62] Sitanggang, I.S., Syaufina, L., Trisminingsih, R., Ramdhany, D., Nuradi, E., Hidayat, M.F.A., Rahmawan, H., Wulandari, Ardiansyah, F., Albar, I., Krisnanto, F. (2022). Indonesian forest and land fire prevention patrol system. Fire, 5(5): 136. https://doi.org/10.3390/fire5050136
[63] Sormin, R.D. (2021). The effect of communication, resources, disposition and structure of bureaucracy on medical participation of men’s operations in City of Bandar Lampung (Study of George Edward III Policy Implementation Model). International Journal for Innovation Education and Research, 9(7): 323-338. https://doi.org/10.31686/ijier.vol9.iss7.3254
[64] Suhardono, S., Fitria, L., Suryawan, I.W.K., Septiariva, I.Y., Mulyana, R., Sari, M.M., Ulhasanah, N., Prayogo, W. (2024). Human activities and forest fires in Indonesia: An analysis of the Bromo incident and implications for conservation tourism. Trees, Forests and People, 15: 100509. https://doi.org/10.1016/j.tfp.2024.100509
[65] Sydnes, M., Kjeve, M., Sydnes, A.K. (2025). Interorganizational coordination during emergencies and crises. International Journal of Disaster Risk Reduction, 121: 105310. https://doi.org/10.1016/j.ijdrr.2025.105310
[66] Talan, G., Sharma, G.D., Pareira, V., Muschert, G.W. (2024). From ESG to holistic value addition: Rethinking sustainable investment from the lens of stakeholder theory. International Review of Economics and Finance, 96(PA): 103530. https://doi.org/10.1016/j.iref.2024.103530
[67] Tang, L., Zhu, X. (2023). Academic self-efficacy, grit, and teacher support as predictors of psychological well-being of Chinese EFL students. Frontiers in Psychology, 14: 1-15. https://doi.org/10.3389/fpsyg.2023.1332909
[68] Thelen, P.D., Yue, C.A., Verghese, A.K. (2022). Increasing employee advocacy through supervisor motivating language: The mediating role of psychological conditions. Public Relations Review, 48(5): 102253. https://doi.org/10.1016/j.pubrev.2022.102253
[69] Tian, X., Zhang, Y. (2025). The mediating role of intrinsic motivation in the relationship between external support and performance goals among Chinese high school students: The moderating effect of gender. Acta Psychologica, 259: 105375. https://doi.org/10.1016/j.actpsy.2025.105375
[70] Wu, Q., Li, R. (2024). The driving mechanism of citizens’ protective behaviors for rainstorm flood disasters in China: An empirical study based on the protection motivation theory and protective action decision model. Heliyon, 10(22): e38482. https://doi.org/10.1016/j.heliyon.2024.e38482
[71] Yuniarsih, E.T., Salam, M., Jamil, M.H., Nixia Tenriawaru, A. (2024). Determinants determining the adoption of technological innovation of urban farming: Employing binary logistic regression model in examining Rogers’ framework. Journal of Open Innovation: Technology, Market, and Complexity, 10(2): 100307. https://doi.org/10.1016/j.joitmc.2024.100307