Nureni O. Adeboye![]() | Timothy A. Ogunleye
| Timothy A. Ogunleye![]() | Julius R. Oluwadare* | Olumide S. Adesina
| Julius R. Oluwadare* | Olumide S. Adesina![]() | Adedayo Adedotun
| Adedayo Adedotun![]() | Ahamerula U. Mbata
| Ahamerula U. Mbata
© 2025 The authors. This article is published by IIETA and is licensed under the CC BY 4.0 license (http://creativecommons.org/licenses/by/4.0/).
OPEN ACCESS
Inflation volatility is a critical area of research in macroeconomics, particularly in developing countries where economic stability is often compromised by fluctuating inflation rates. Thus, this study investigates the official data of inflation rates published in Nigeria between 2003 and 2022, using the Exponential Generalized Autoregressive Conditional Heroscedasticity (E-GARCH) and Asymmetric Generalized Autoregressive Conditional Heroscedasticity (A-GARCH) to capture the time varying nature of inflation volatility and explore the dynamics relationships between inflation and the key economic variables of exchange rates, net import rates and interest rates. The study revealed that the Nigerian inflation exhibits significant clustering, with notable asymmetric effects of positive and negative shocks. Exchange rate fluctuations and interest rates significantly impact the inflation volatility, highlighting the interconnectivity of these economics factors. The GARCH models revealed that negative economic shocks contribute more substantially to inflationary instability compared to positive shocks, and both models demonstrate comparable fit as reflected in their values of AIC (E-GARCH-6.9990; A-GARCH-6.9990); BIC (E-GARCH-7.3971; A-GARCH-6.0673); RMSE (E-GARCH-0.7685; A-GARCH-1.0150) which suggests that the E-GARCH model may perform better in terms of predictive accuracy despite the A-GARCH model being the most parsimonious. Hence, the two models were engaged in a 5-years (2023-2027) forecast of inflation rate volatility over time, and the E-GARCH demonstrated superior performance in capturing inflation volatility over A-GARCH with the forecast uncertainty (sigma) remain relatively stable until the year 2023, indicating consistent forecast accuracy during the periods. However, there is a systematic increase in sigma forecast from 2024 onwards suggesting a significant rise in forecast uncertainty.
exogenous variables, forecast, GARCH model, inflation rates, volatility
Nigeria's economy has been characterized by high inflation rates, exchange rate volatility, excess of imports over exports, and interest rate fluctuations which have had significant impacts on the overall economic performance [1]. Inflation volatility is a major concern in macroeconomics, particularly in developing countries where economic stability is often compromised by fluctuating inflation rates [2]. Understanding the determinants of inflation and the volatility surrounding it is essential for policymakers, as high inflation can lead to uncertainty, reduced investment, and overall economic instability.
In particular has been a persistent problem in Nigeria with rates often exceeding the Central Bank of Nigeria (CBN) annual target range of 6-9% and this has always eroded the purchasing power of citizens, reduced the value of savings and undermined economic growth [3].
Inflation volatility refers to the degree of fluctuation in inflation rates over a specific period. It is a critical economic indicator that can significantly impact macroeconomic stability, investment decisions, and overall economic growth [4]. High inflation volatility often leads to uncertainty in the economy, affecting consumer behavior, business planning, and monetary policy implementation. For instance, when inflation rates are unpredictable, consumers may delay spending, and businesses might hesitate to invest, fearing that rising costs could erode their profits [5, 6]. A study by Ehikioya [3] indicates that inflation volatility is influenced by various factors, including supply shocks, demand fluctuations, and monetary policy decisions. The relationship between inflation and economic indicators is complex; for instance, high inflation can result from strong demand during periods of economic growth, while rising production costs can lead to cost-push inflation [7]. Theoretical frameworks, such as the Phillips curve, suggest a trade-off between inflation and unemployment, emphasizing the need for careful monetary policy management. In many developing countries, inflation volatility poses significant challenges, often stemming from external shocks such as fluctuating commodity prices or exchange rate instability. Countries like Nigeria have experienced substantial inflation volatility due to factors such as oil price shocks, exchange rate fluctuations, and varying fiscal policies [4].
Exogenous variables are external factors that can significantly influence the inflation dynamics of an economy [8]. In the context of inflation volatility, these variables play a critical role in shaping price stability and overall economic performance. Key exogenous variables affecting inflation volatility include exchange rates, interest rates, and net import rates among others. Understanding how these variables interact with inflation is crucial for official statisticians, policymakers and economists seeking to maintain economic stability.
The exogenous variable of exchange rate volatility has been a significant challenge for Nigeria with the naira experiencing frequent fluctuations against major currencies globally. This volatility has affected the prices of country’s imports, contributed to inflation, messed-up the monetary policy rates, and impacted the overall competitiveness of the economy. Monetary policy is one of the instruments of economic stabilization, and the main objectives of monetary policy in Nigeria are to preserve the value of the naira and to maintain enough foreign exchange reserves [9]. In Nigeria, the central bank maintains the stability of the naira exchange rate in order to achieve its objective of maintaining price stability, because domestic prices (inflation) are very responsive to exchange rate fluctuations. According to Okechukwu et al. [1], countries where exchange rate volatility tends to have adverse effects on inflationary pressure, more stable exchange rate through central bank intervention in the foreign exchange market is required in order to stabilize the economy. According to Musa [7], exchange rate is one of the most significant exogenous variables affecting inflation volatility. They represent the value of one currency in terms of another and are influenced by a variety of factors, including market sentiment, economic indicators, and government policies. Fluctuations in exchange rates can lead to substantial changes in the cost of imported goods and services. A depreciation of the local currency typically increases the price of imports, contributing to inflationary pressures [10]. For instance, when the naira depreciate against major currencies like the US dollar or Euro, the cost of imported goods rises, leading to higher inflation rates. A study by Gidigbi et al. [11] highlights the critical relationship between exchange rate stability and inflation in emerging economies. Their study indicates that countries with volatile exchange rates often experience greater inflation volatility due to increased uncertainty regarding the future costs of goods and services. In Nigeria, the exchange rate has been subject to significant fluctuations, primarily due to external shocks such as changes in global oil prices, geopolitical tensions, and shifts in monetary policy by major economies. For instance, Nigeria's economy is heavily reliant on oil exports, and fluctuations in global oil prices can directly affect the naira's value. When oil prices fall, the naira often depreciates, leading to higher import costs and, consequently, inflation [11]. Moreover, policy changes, such as the Central Bank of Nigeria's (CBN) decisions regarding foreign exchange regulations and interventions, can further exacerbate exchange rate volatility. For example, the CBN's efforts to stabilize the naira through interventions can create short-term stability, but these measures may lead to longer-term distortions in the market [12]. As a result, the relationship between exchange rates and inflation in Nigeria is complex and multifaceted, underscoring the need for careful monitoring and analysis of currency fluctuations to anticipate their potential impact on inflation volatility.
Among multiple considerations of the various exogenous factors affecting the inflationary trend of any developing economy, the issue of the mechanism of interest rate, its variability and trends through time have proven to deserve significant attention. Interest rate is the sum exacted on money given by a lender to a borrower and expressed as a proportion of the principal [13]. This definition identifies it as the cost of borrowing from a lender. According to Sabina et al. [14] and Cabral et al. [15], interest rate is a crucial exogenous variable influencing inflation volatility. Central banks often adjust interest rates as part of their monetary policy regime to manage inflation and stimulate or slow down economic activity. Higher interest rates generally reduce consumer spending and investment, leading to lower inflationary pressures. Conversely, lower interest rates can stimulate economic activity by making borrowing cheaper, which can, in turn, lead to increased inflation [16]. The relationship between interest rates and inflation has been extensively studied, with findings indicating a significant correlation between the two variables. Eldomiaty et al. [17] provide insights into how central banks use interest rates to control inflation, highlighting the importance of adjusting rates in response to changing economic conditions. When inflation is perceived to be rising above target levels, central banks may increase interest rates to dampen demand and bring inflation back in line with targets. This mechanism is particularly relevant in economies experiencing high inflation volatility, where swift adjustments in interest rates can help stabilize prices. In Nigeria, the CBN has employed interest rate adjustments to manage inflation, particularly in response to external shocks and domestic economic pressures [18]. For example, during periods of rising inflation driven by external factors, such as increases in global oil prices or food shortages due to climate change, the CBN may raise interest rates to curb demand and stabilize prices [16]. However, the effectiveness of this approach can be challenged by other factors, such as structural issues in the economy, limited access to credit, and the overall business environment. Moreover, the relationship between interest rates and inflation can be influenced by expectations. If consumers and businesses anticipate higher inflation in the future, they may adjust their buying behavior in ways that exacerbate inflationary pressures, creating a self-fulfilling cycle [18]. Understanding this dynamic is essential for policymakers aiming to stabilize inflation in the face of fluctuating interest rates.
Net import rates, defined as the difference between a country’s imports and exports, also significantly influence inflation dynamics, according to Choi et al. [19]. Net import rate which refers to the fluctuations in the value of imports relative to export has also played a significant role in Nigeria economic performance. The country's reliance on imported goods and services has made it vulnerable to external shock including changes in global commodity prices and exchange rates [14]. A high level of imports relative to exports can create upward pressure on inflation, especially in economies that rely heavily on imported goods for consumption and production. In the case of Nigeria, which imports a significant portion of its consumer goods, industrial inputs, and food, changes in net import rates can directly impact inflation [19]. A study by Roncaglia de Carvalho et al. [20] emphasizes the importance of trade balances in understanding inflationary pressures in developing economies. When a country has a high net import rate, it often experiences increased demand for foreign currency to pay for these imports, leading to depreciation of the local currency. As discussed earlier, this depreciation can further increase the cost of imports, resulting in higher prices for consumers and contributing to inflation volatility. Additionally, external factors such as global commodity prices, trade policies, and international economic conditions can impact net import rates. For instance, fluctuations in global oil prices directly affect Nigeria's trade balance, as oil is a significant export commodity. During periods of high oil prices, Nigeria benefits from increased export revenues, which can strengthen the naira and reduce inflationary pressures. Conversely, when oil prices fall, the negative impact on export revenues can lead to a higher net import rate, increasing inflation volatility [16]. Furthermore, government policies that affect import tariffs and trade agreements can also play a role in shaping net import rates and, subsequently, inflation dynamics. For example, the imposition of tariffs on certain goods may reduce imports, leading to temporary price stability. However, if domestic production cannot meet consumer demand, prices may still rise due to shortages, contributing to inflation volatility [20].
To analyze inflation volatility, econometric models like the Generalized Autoregressive Conditional Heteroskedasticity (GARCH) family are commonly employed. These models capture the clustering of volatility over time, allowing economists to understand better the dynamics of inflation fluctuations [7, 21, 22]. By examining inflation volatility, policymakers can design effective strategies to stabilize prices, fostering a conducive environment for sustainable economic growth [23, 24]. Other literatures that have employed the GARCH models in their studies [25-28].
While the existing literature provides valuable insights into inflation dynamics, some studies have identified limitations in their methodologies. For instance, many studies rely on linear models that may not adequately capture the complexity of inflation volatility. The current study's use of E-GARCH and A-GARCH models addresses this gap by allowing for asymmetries in volatility response, thus providing a more nuanced understanding of inflation dynamics.
The E-GARCH model is designed to address some limitations of traditional GARCH models by allowing for asymmetric effects of shocks on volatility. It captures the phenomenon of volatility clustering, where periods of high volatility are followed by high volatility and periods of low volatility are followed by low volatility [21]. This model is particularly effective in situations where the magnitude and direction of shocks affect volatility differently. The key feature of the E-GARCH model, according to Cassim [21], is its ability to model asymmetries in volatility responses. In traditional GARCH models, volatility responses to positive and negative shocks are often assumed to be symmetric. However, in many real-world scenarios, negative shocks (e.g., adverse economic news) tend to have a greater impact on volatility than positive shocks (e.g., favorable news). The E-GARCH model incorporates this asymmetry by using a logarithmic transformation of the conditional variance, ensuring that estimated volatilities remain positive and allowing for a more nuanced understanding of volatility dynamics [24].
The A-GARCH model extends the GARCH framework by explicitly accounting for asymmetries in the impact of shocks on volatility [24]. This model is particularly useful in capturing the differential effects of positive and negative shocks on volatility, reflecting the reality that negative shocks often lead to greater increases in volatility compared to positive shocks of the same magnitude. The A-GARCH model introduces an additional parameter to account for the asymmetry, allowing it to model how volatility responds differently to negative versus positive shocks [22]. This is achieved through an indicator function that distinguishes between positive and negative past innovations. By incorporating this feature, the A-GARCH model provides a more accurate representation of volatility behavior, especially in contexts where financial markets or economic conditions exhibit pronounced asymmetries [23]. Thus, the adoption of E-GARCH and A-GARCH models for this research are appropriate for capturing asymmetric volatility nature of the sourced data and the associated exogenous variables. Unlike the traditional GARCH models, which require non-negativity constraints on parameters, these models provide greater flexibility in modeling complex volatility structures such as clustering, interplays of negative and positives shocks as occasioned in this research.
Going by the above insightful backgrounds, inflation volatility presents a significant challenge to economic stability and policy effectiveness in Nigeria. Despite its importance, existing research often falls short in capturing the intricate ways of external factors like exchange rates, net import rates, and interest rates as they affect inflation volatility. For instance, Ehikioya [3] explores the impact of exchange rate volatility on Nigeria's economic growth but does not address its specific effect on inflation volatility. Similarly, Okechukwu et al. [1] examine how exchange rates and interest rates influence stock market returns volatility in Nigeria, leaving a gap in understanding their impact on inflation specifically while Chigozie et al. [29] utilized an ARDL approach to study the effects of interest rates and exchange rates on economic growth, but do not focus on inflation volatility. Also, Morina et al. [9] and Uddin et al. [30] addressed exchange rate volatility but do not fully explore how these variables impact inflation volatility in Nigeria, just to mention few. This research, however, will offer a more comprehensive understanding of how these macroeconomic variables influence inflation volatility, a topic inadequately explored in previous studies [13, 14].
Combining and comparing advanced models of E-GARCH and A-GARCH as presented in this study provides a more robust approach to analyze inflation volatility by capturing the dynamic and asymmetric nature of economic shocks. The study aims to fill the established gaps by comparing the efficacy of E-GARCH and A-GARCH models in the evaluation of inflation volatility and ascertain the impacts of exchange rates, net import rates, and interest rates on the asymetric nature of inflation volatility. By comparing these advanced models, the research seeks to provide a clearer understanding of the factors influencing inflation volatility and inform more effective economic policies. The results will impact significantly on policy formulation by providing policymakers with deeper insights into the relationships between key economic variables and inflation, thereby informing more effective monetary policies. Improved understanding of these relationships will also aid in the development of strategies to manage inflation, a critical issue in Nigeria. The findings will also contribute to macroeconomic stability by providing valuable information for promoting economic growth and stability, addressing inflation challenges, and contributing to Nigeria’s broader economic development, and by extension, the West African region.
2.1 Materials
The materials for this study were sourced from World Bank database and it is available online at https://data.worldbank.org/indicator/FP.CPI.TOTL.ZG?locations=NG. This source provides reliable historical economic data critical for the empirical analysis of this study. The data spanned from 2003 to 2022, due to paucity of information. The data was sourced in the year 2023 and the research was concluded in the year 2024.
The primary variable of interest in this study is the inflation rate, which serves as the main dependent variable for fitting the volatility models. The exogenous variables considered are exchange rate (ER), net import (NI), and interest rate (IR). The exchange rate, expressed as Naira per US Dollar, will be included to assess its impact on inflation volatility. This variable captures the fluctuations in currency value and its potential influence on domestic inflation. The Net Import Rate calculated as total imports minus total exports, will provide insights into how trade balances affect inflation. It reflects the net impact of trade on the domestic economy while the Interest Rate is measured through the monetary policy rate, set by the Central Bank of Nigeria. This rate influences borrowing costs and economic activity, and will be analyzed to understand its effect on inflation volatility. All these variables were computed in rates to avoid any transformation prior to modelling.
2.2 Methods
The methods utilized include Descriptive statistics, Trend visualization, and Volatility estimation using both E-GARCH and A-GARCH. The E-GARCH model is specified as given below:
$\begin{gathered}\log \sigma_t^2=\omega_0+\sum_{i=1}^q \omega_{0, i-1}\left\{\epsilon_{t-1}<0\right\}+ \sum_{i=1}^q\left(\alpha_{0 . i+1}\left\{\epsilon_{t-i}>0\right\}+\left(\alpha_{0 . i-1}\left\{\epsilon_{t-i}<\right.\right.\right. 0\}) \log \epsilon_{t-i}^2+\sum_{j=1}^p \beta_{0, j} \log \sigma_{t-j}^2+\sum_{k=1}^{\ell} \gamma_{0, k}+ \eta_{t-k}^{+}+\gamma_{0, k}-\eta_{t-k}^{-}\end{gathered}$ (1)
$\log \left(\sigma_t^2\right)=\omega+\sum_{i=1}^p \alpha_i \frac{y_{t-i}}{\sigma_{t-i}}+\sum_{j=1}^q \beta_j \log \left(\sigma_{t-j}^2\right)$ (2)
where, $\sigma_t{ }^2$ represents the conditional variance (volatility) at time $\mathrm{t}, \omega$ is a constant term, $y_t$ is the error term (the innovation) at time $\mathrm{t}, \alpha_i$ are the coefficients that measure the impact of past innovations on current volatility and $\beta_j$ are the coefficients that capture the influence of past volatility on current volatility. In this specification, the logarithmic transformation of the conditional variance ensures that the estimated volatility remains positive, a crucial requirement for any volatility model.
The Asymmetric Generalized Autoregressive Conditional Heteroskedasticity (A-GARCH) model is an extension of traditional GARCH models that specifically accounts for asymmetries in the volatility response to shocks in time series data. The A-GARCH model can be expressed mathematically as:
$\begin{gathered}\sigma_t^2=\alpha_0+\alpha_1 u_{t-1}^2+\cdots+\alpha_p u_{t-p}^2+\beta_1 \sigma_{t-1}^2+\cdots +\beta_q \sigma_{t-q}^2\end{gathered}$ (3)
$\sigma_t^2=\omega+\alpha y_{t-1}^2+\beta \sigma_{t-1}^2+\gamma\left(y_{t-1}^2 I_{t-1}\right)$ (4)
where, $\sigma_t{ }^2$ represents the conditional variance (volatility) at time $\mathrm{t}, \omega$ is a constant term, $y_{t-1}$ is the error term (the innovation) at time ${ }_{\mathrm{t}-1}, \sigma_{t-1}{ }^2$ is the lagged conditional variance, $\alpha$ measures the effect of past squared innovations on current volatility, $\beta$ measures the influence of past volatility on current volatility and $\gamma$ captures the asymmetry, indicating how much the volatility increases in response to negative shocks compared to positive shocks. The inclusion of the indicator function $\mathrm{I}_{\mathrm{t}-1}$ which takes the value of 1 if the previous innovation $\mathrm{y}_{\mathrm{t}-1}$ is negative and 0 otherwise, allows the AGARCH model to distinguish between the effects of positive and negative shocks. This is essential for accurately modeling inflation volatility, as it reflects the reality that adverse economic conditions often lead to heightened uncertainty and fluctuations in inflation rates.
The evaluation metrics used for model comparison are Akaike Information Criterion (AIC), Bayesian Information Criterion (BIC) and Root Mean Squared Error (RMSE).
The results in Table 1 present a descriptive summary of key economic indicators in Nigeria, including exchange rate, interest rate, import rate, and inflation rate, based on a sample size of 20 observations. The mean exchange rate is 212.17, with a standard error of 22.63, indicating significant variability. The median exchange rate is 157.41, while the mode is 425.98, showing a skewness of 0.98, suggesting a rightward asymmetry. The standard deviation is 101.20, reflecting considerable fluctuation. For the interest rate, the mean is 5.69, with a standard error of 1.29. The median and mode are 5.92 and 18.18, respectively, exhibiting a slight positive skewness of 0.06. The standard deviation is 5.75, indicating moderate variability. The import rate has a mean of 103.84 and a median of 104.05, with a standard deviation of 15.37. The skewness is minimal (0.08), reflecting a relatively symmetric distribution. Inflation rate data shows a mean of 12.59, with a standard deviation of 3.61 and a negative skewness of -0.11. Overall, these descriptive statistics highlight significant variations and patterns across the economic indicators under analysis.
Table 1. Descriptive summary
|
|
Exchange Rate |
Interest Rate |
Import Rate |
Inflation Rate |
|
Mean |
212.17 |
5.69 |
103.84 |
12.59 |
|
Standard Error |
22.63 |
1.29 |
3.44 |
0.81 |
|
Median |
157.41 |
5.92 |
104.05 |
12.38 |
|
Mode |
425.98 |
18.18 |
141.50 |
18.85 |
|
Standard Deviation |
101.20 |
5.75 |
15.37 |
3.61 |
|
Sample Variance |
10242.27 |
33.11 |
236.23 |
13.03 |
|
Kurtosis |
-0.48 |
0.15 |
1.29 |
-0.58 |
|
Skewness |
0.98 |
0.06 |
0.08 |
-0.11 |
|
Range |
307.41 |
23.81 |
69.90 |
13.46 |
|
Minimum |
118.57 |
-5.63 |
71.60 |
5.39 |
|
Maximum |
425.98 |
18.18 |
141.50 |
18.85 |
|
Sum |
4243.48 |
113.87 |
2076.78 |
251.70 |
|
Count |
20.00 |
20.00 |
20.00 |
20.00 |
The descriptive analysis results highlighted substantial variability across the considered metrics. Notably, the inflation rate exhibited considerable fluctuations, reflecting the broader economic challenges faced by Nigeria. The pronounced volatility of the inflation rate underscores the importance of effective monetary and fiscal policies to stabilize prices and promote economic growth. The trends observed over the years indicate that external shocks and domestic factors significantly influence inflation dynamics, necessitating a comprehensive approach to economic management.
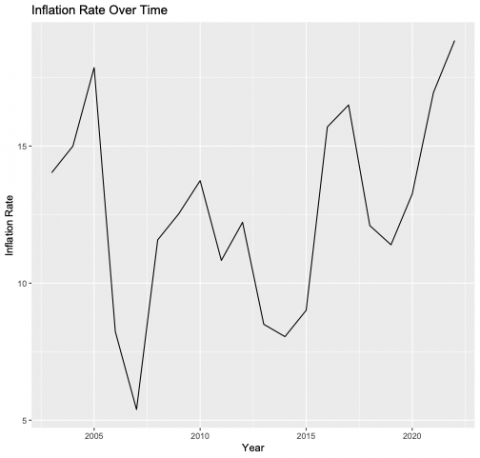
Figure 1. Trend of inflation rate over time
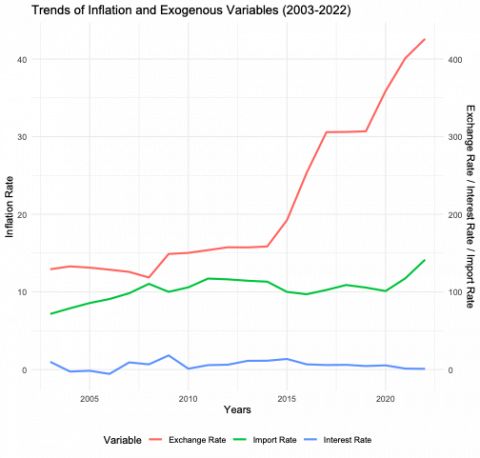
Figure 2. Trends of exchange rate, interest rate and import rate over the years
Figure 1 and Figure 2 present the trends of inflation rate and the exogenous variables over time. The line chart in Figure 1 illustrates fluctuations in the inflation rate from approximately 2004 to 2023. The rate exhibits significant volatility, with periods of sharp increases followed by declines. There's a notable peak around 2007, followed by a downward trend until 2010. Subsequently, the inflation rate experiences another surge, reaching a higher peak before gradually declining towards the end of the period. The chart highlights the dynamic nature of inflation, with periods of stability interspersed with periods of rapid change. The charts of Figure 2 illustrate the trends of exchange rate, interest rate, and import rate from 2003 to 2022. The exchange rate shows a relatively stable period until 2015, followed by a sharp increase. The interest rate fluctuates with an upward trend from 2015 onwards. The import rate exhibits a steady growth throughout the period, with a notable acceleration after 2015. These trends suggest potential interrelationships among the variables, such as the impact of exchange rate depreciation on import costs and the government's monetary policy response. Thus further analysis is required to determine the exact nature of these relationships as presented in this study.
Table 2 presents the parameter estimates for the E-GARCH model, highlighting key coefficients that determine inflation volatility in Nigeria. The mean parameter (μ) is estimated at 14.545, with a standard error of 0.016, yielding a t-value of 906.644 and a p-value of 0, indicating a highly significant mean effect on inflation. Also, the model's intercept (ω) is 6.314, with a standard error of 2.319 and a t-value of 2.723, resulting in a p-value of 0.0065, suggesting that this parameter is also statistically significant. The parameter α1, which measures the short-term effects of shocks, is estimated at 7.410, with a standard error of 3.007 and a t-value of 2.464, leading to a p-value of 0.0137, which indicates parameter significance. The persistence parameter (β1) is estimated at 0.969, showing strong persistence in volatility with a very low standard error and a t-value of 49.963, resulting in a p-value of 0, which also highlights the significance of the persistence parameter. Finally, the asymmetry parameter (γ1) is estimated at 9.647, with a standard error of 2.293, indicating significant asymmetric effects on inflation volatility. Overall, all parameters in the E-GARCH model demonstrate strong significance and contribute to understanding inflation dynamics.
Table 2. Parameter estimates for E-GARCH model
|
|
Estimate |
Std Error |
T-Test |
Pr(>|t|) |
|
mu |
14.545047 |
0.016043 |
906.6443 |
0 |
|
omega |
6.313817 |
2.318539 |
2.7232 |
0.006466 |
|
alpha1 |
7.410442 |
3.00724 |
2.4642 |
0.013732 |
|
beta1 |
0.969003 |
0.019395 |
49.9626 |
0 |
|
gamma1 |
9.646618 |
2.293176 |
4.2067 |
0.000026 |
Table 3 presents the impact of exogenous variables on inflation rate volatility, as estimated by the model. The coefficient for the exchange rate is 0.0209, with a standard error of 0.0004. The t-value is 59.341, and the p-value is 0.000, indicating a highly significant positive impact on inflation rate volatility. This suggests that an increase in the exchange rate is associated with a rise in inflation volatility. For the interest rate, the coefficient is -0.0447, with a standard error of 0.0019. The t-value is -23.3292, and the p-value is 0.000, reflecting a highly significant negative effect. This implies that a higher interest rate is associated with reduced inflation volatility. The import rate has a coefficient of -0.0386, with a standard error of 0.0007. The t-value is -56.1165, and the p-value is 0.000, indicating a highly significant negative impact on inflation rate volatility. This means that an increase in the import rate is linked to lower inflation volatility. Overall, the results show that both interest rate and import rate have significant negative impacts on inflation volatility, while only the exchange rate has a significant positive effect.
Table 3. Impact of exogenous variables on inflation rate volatility
|
|
Estimate |
Std Error |
T-Test |
Pr(>|t|) |
|
Exchange Rate |
0.020857 |
0.000351 |
59.341 |
0.000 |
|
Interest Rate |
-0.044681 |
0.001915 |
-23.3292 |
0.000 |
|
Import Rate |
-0.038632 |
0.000688 |
-56.1165 |
0.000 |
Table 4 presents the Nyblom stability test conducted for the E-GARCH model parameters. The test evaluates the stability of the estimated parameters, where lower values indicate greater stability. The stability indices for individual parameters are as follows: μ (0.2474), Exchange Rate (0.2565), Interest Rate (0.8066), Import Rate (0.2590), ω (0.2703), α1 (0.0459), β1 (0.6967), and γ1 (0.4130). The joint stability index is 7.2257, which reflects the combined stability of all parameters. The results indicate that most parameters are relatively stable, with α1 showing the highest stability, while the Interest rate parameter has the lowest stability. This suggests that while the E-GARCH model parameters are generally stable, there are variations in stability among the variables.
Table 4. Nyblom stability test results for E-GARCH model parameters
|
mu |
EXR |
IR |
ImR |
Omega |
Alpha1 |
Beta1 |
Gamma1 |
Joint stability |
|
0.2474 |
0.2565 |
0.8066 |
0.2590 |
0.2703 |
0.0459 |
0.6967 |
0.4130 |
7.2257 |
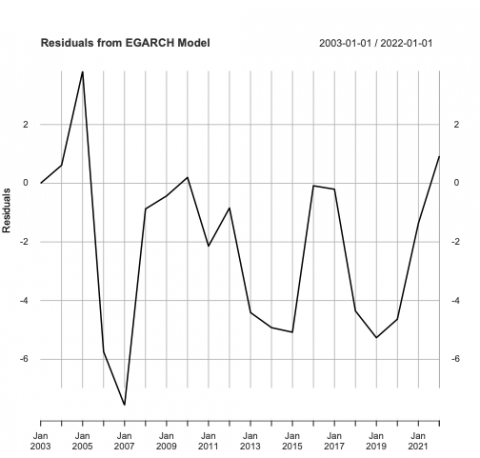
The plot presented in Figure 3 visualizes the residuals from an EGARCH model over time. Ideally, residuals should be randomly distributed around zero with no apparent patterns. In this case, the residuals exhibit some volatility clustering, with periods of higher and lower volatility. While there are no extreme outliers, the presence of clusters suggests that the EGARCH model might not fully capture the conditional heteroscedasticity in the data.
Figure 3. Residual plot for E-GARCH
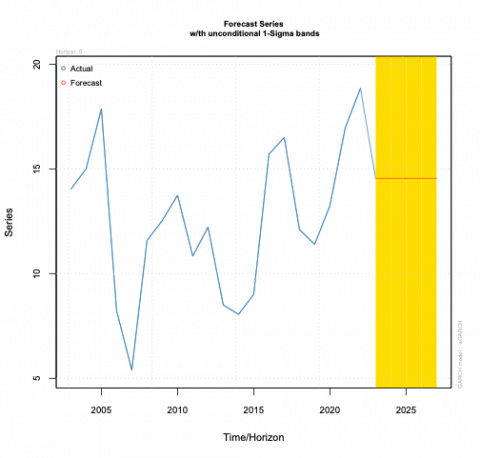
Figure 4. 5-years forecast for inflation rate (E-GARCH)
The E-GARCH volatility forecast equation is presented in Eq. (5) with the 5-Years Forecast for Inflation Rate (E-GARCH) presented in Figure 4. The chart illustrates actual and forecasted values of inflation rate over time, accompanied by confidence intervals. The actual data exhibits fluctuations with a general upward trend until around 2020, followed by a sharp decline. The forecast, represented by the red dots, attempts to predict future values based on the historical data. The shaded area represents the prediction interval, indicating the range within which future values are likely to fall with a certain degree of confidence. It's evident that the model has captured the general trend of the data, but the accuracy of the forecast, especially for the sharp decline, is uncertain due to the wide prediction interval.
$\begin{aligned} & \log \left(\sigma^2 \mathrm{t}\right)=6.314+7.410 \frac{\epsilon_{t-1}}{\sigma_{t-1}}+0.969 \log \left(\sigma^2 \mathrm{t}-1\right)+ 9.647 \frac{\epsilon_{t-1}}{\sigma_{t-1}}+0.0209 \mathrm{ER}_{\mathrm{t}}-0.0447 \mathrm{IR}_{\mathrm{t}}-0.0386 \mathrm{NIt}\end{aligned}$ (5)
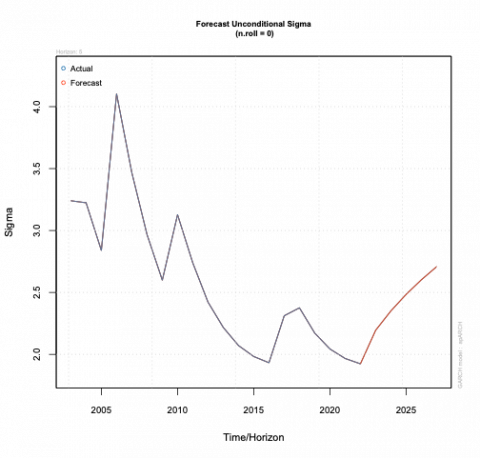
Figure 5. 5-years forecast for inflation rate sigma (E-GARCH)
The plot presented in Figure 5 visualizes the forecast uncertainty (sigma) over time. Notably, the sigma remains relatively stable at a low level until approximately 2023, indicating consistent forecast accuracy during that period. However, there's a dramatic increase in sigma from 2023 onwards, suggesting a significant rise in forecast uncertainty. This sharp escalation implies that predicting future values beyond 2023 becomes increasingly challenging due to higher volatility or unforeseen factors impacting the country’s inflation.
Table 5 presents the parameter estimates for the A-GARCH model. The mean parameter (μ) is estimated at 11.964, with a standard error of 5.163 and a t-value of 2.31735, indicating statistical significance with a p-value of 0.0205. This suggests that the mean inflation rate is significantly different from zero. The constant term (ω) has an estimate of 4.274, but it is not statistically significant, as indicated by its high standard error (21.030) and a p-value of 0.839. The alpha1 parameter, representing the effect of past squared returns, is estimated at 0.0429, but it is also not significant (p-value = 0.895). The beta1 parameter, reflecting the persistence of volatility, is estimated at 0.5244, with a p-value of 0.278, indicating it is not significant. The gamma1 parameter which captures asymmetry, is estimated at -0.9462 and also shows no significance at p-value of 0.712. The delta parameter is fixed at 3.5, with a standard error of 5.070 and a p-value of 0.490, indicating a lack of significance. Overall, the A-GARCH model suggests limited statistical significance of its estimated parameters.
Table 5. Parameter estimates for A-GARCH model
|
|
Estimate |
Std Error |
T-Test |
Pr( > |t|) |
|
mu |
11.963528 |
5.162599 |
2.31735 |
0.020485 |
|
omega |
4.273618 |
21.030263 |
0.20321 |
0.838969 |
|
alpha1 |
0.042927 |
0.325585 |
0.13184 |
0.895107 |
|
beta1 |
0.524384 |
0.483171 |
`1.08529 |
0.277791 |
|
gamma1 |
-0.946238 |
2.564106 |
-0.36903 |
0.712104 |
|
delta |
3.5 |
5.070433 |
0.69028 |
0.49002 |
Table 6 details the impact of exogenous variables on inflation rate volatility using the A-GARCH model. The coefficient for the exchange rate is 0.0183, with a standard error of 0.0057. The t-value is 3.2225, and the p-value is 0.0013, indicating a statistically significant positive impact. This suggests that an increase in the exchange rate is associated with higher inflation rate volatility. For the interest rate, the coefficient is -0.1991, with a standard error of 0.0878. The t-value is -2.2673, and the p-value is 0.0234, showing a significant negative effect. This implies that a higher interest rate tends to reduce inflation rate volatility. The import rate has a coefficient of -0.0201, with a standard error of 0.0514. The t-value is -0.3922, and the p-value is 0.6949, indicating that the import rate does not have a significant impact on inflation rate volatility. Overall, the exchange rate and interest rate significantly influence inflation rate volatility, whereas the net import rate does not.
Table 6. Impact of exogenous variables on inflation rate volatility
|
|
Estimate |
Std Error |
T-Test |
|
Exchange Rate |
0.018292 |
0.005676 |
3.2225 |
|
Interest Rate |
-0.19908 |
0.087804 |
-2.26732 |
|
Import Rate |
-0.020143 |
0.051365 |
-0.39215 |
Table 7 presents the stability test results for the A-GARCH model parameters. The stability indices for individual parameters are estimated as μ (0.1060), mxreg1 (0.0741), mxreg2 (0.1944), mxreg3 (0.0859), ω (0.0544), α1 (0.1638), β1 (0.1089), γ1 (0.1638), and δ (0.1582). These indices measure the stability of each parameter, with lower values indicating greater stability. The results show that the parameters μ, ω, and mxreg1 exhibit the highest stability, with indices below 0.1100. Conversely, the parameters mxreg2, α1, γ1, and δ show moderate stability, while β1 and mxreg3 have slightly higher stability values. Overall, the test indicates generally stable parameters for the A-GARCH model.
Table 7. Nyblom stability test results for A-GARCH model parameters
|
mu |
mxreg1 |
mxreg2 |
mxreg3 |
omega |
alpha1 |
beta1 |
gamma1 |
delta |
|
0.10601 |
0.07413 |
0.19436 |
0.08587 |
0.0544 |
0.16376 |
0.10886 |
0.16384 |
0.15822 |
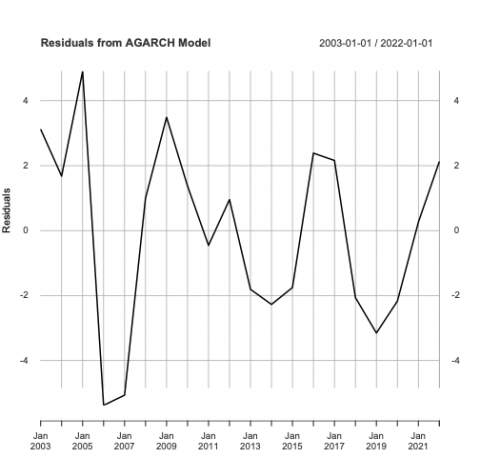
The plot presented in Figure 6 visualizes the residuals from an AGARCH model over time. Ideally, residuals should be randomly distributed around zero with no apparent patterns. In this case, the residuals exhibit significant fluctuations, suggesting that the AGARCH model might not fully capture the volatility dynamics in the data. There are periods of clustering, indicating potential autocorrelation or heteroscedasticity, which could affect the model's performance.
Figure 6. Residual plot for A-GARCH
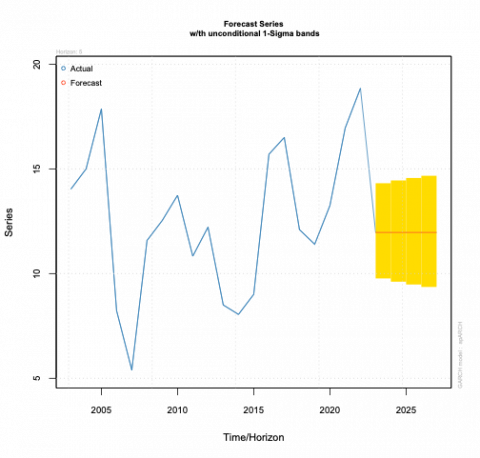
Figure 7. 5-years forecast for inflation rate (A-GARCH)
The A-GARCH volatility forecast equation is presented in Eq. (6) while Figure 7 presents its 5-years forecast for the inflation rate. The chart illustrates actual and forecasted values of inflation rate over time, along with prediction intervals. The actual series exhibits fluctuations with a peak around 2015, followed by a decline towards 2020. The forecast, represented by the red dots, captures the general trend but underestimates the peak value. The prediction intervals, indicated by the shaded area, widen towards the end of the forecast period, suggesting increased uncertainty in future predictions.
$\begin{gathered}\sigma_{\mathrm{t}}^2=4.274+0.0429 \epsilon^2{ }_{\mathrm{t}-1}+0.5244 \sigma^2{ }_{\mathrm{t}-1}-0.9462 \epsilon^2{ }_{\mathrm{t}-1} \\ \mathrm{x} I\left(\epsilon_{\mathrm{t}-1}<0\right)+3.5+0.0183 E R_t-0.1991 I R_t- 0.0201 N I_t\end{gathered}$ (6)
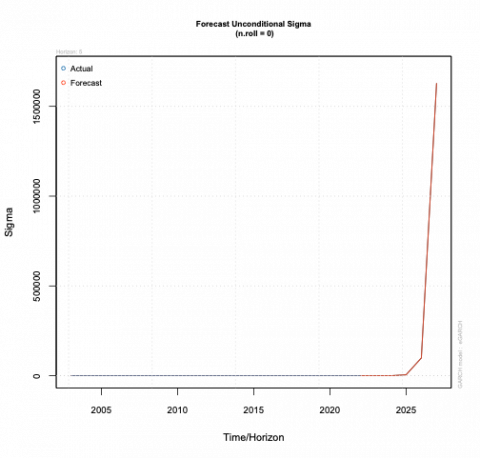
Figure 8. 5-years forecast for inflation rate sigma (A-GARCH)
Figure 8 depicts the forecast uncertainty (sigma) over time. Initially, there's a period of relative stability in sigma, suggesting consistent forecast accuracy. However, a significant increase in sigma is observed around 2015, indicating growing uncertainty in predictions. This upward trend continues until the end of the forecast period, implying that future forecasts become increasingly less reliable due to heightened volatility or unforeseen factors.
Table 8 presents the evaluation metrics for comparing the A-GARCH and E-GARCH models based on various criteria. Both models share the same Akaike Information Criterion (AIC) value of 6.9988, suggesting that they have equivalent model fit when considering complexity. However, the Bayesian Information Criterion (BIC) reveals a difference, with the A-GARCH model scoring 6.0673, indicating a better fit relative to complexity compared to the E-GARCH model, which has a BIC of 7.3971. The Root Mean Square Error (RMSE) further distinguishes the models, showing that the E-GARCH model has a lower RMSE of 0.7686, indicating better predictive accuracy and performance compared to the A-GARCH model, which has an RMSE of 1.0150. A lower RMSE suggests better predictive accuracy because it reflects a model that consistently makes closer predictions to the true values. Overall, while both models demonstrate comparable fit through the AIC, the BIC and RMSE metrics suggest that the E-GARCH model may perform better in terms of predictive accuracy, despite the A-GARCH model being more parsimonious. These metrics provide essential insights for model selection based on fit and accuracy.
Table 8. Evaluation metrics for model comparison
|
|
AIC |
BIC |
RSME |
|
AGARCH |
6.998818 |
6.067274 |
1.014955 |
|
EGARCH |
6.998818 |
7.397111 |
0.7685582 |
The E-GARCH model emerged as the more robust method for capturing inflation volatility compared to the A-GARCH model. The E-GARCH results indicated significant coefficients for the mean, intercept, short-term effects, persistence, and asymmetry, suggesting that the model effectively captures both the clustering of volatility and the influence of past shocks on current inflation rates. Specifically, the high persistence parameter indicates that shocks to inflation rates tend to have long-lasting effects, which is critical for policymakers to consider when designing interventions to mitigate inflation.
The impact of exogenous variables on inflation volatility is another key finding of the study. The positive and significant coefficient for the exchange rate suggests that fluctuations in currency value directly affect inflation rates. This relationship underscores the vulnerability of the Nigerian economy to external factors, particularly exchange rate movements. Conversely, the negative coefficients for the interest rate and import rate indicate that increases in these variables can help mitigate inflationary pressures. This finding is particularly relevant in the context of Nigeria's reliance on imports and the importance of interest rate adjustments as a monetary policy tool.
More so, the Nyblom stability test results revealed that most parameters in the E-GARCH model were stable, signifying the model's robustness in capturing inflation dynamics. This stability is essential for reliable forecasting, as it indicates that the relationships identified between inflation and its determinants are consistent over time. The wide prediction intervals observed in the E-GARCH model's forecasts reflect the uncertainty surrounding future inflation rates, highlighting the challenges policymakers face in anticipating and responding to inflationary trends.
This study aimed to investigate the inflation rate dynamics in Nigeria, focusing on the volatility of key economic indicators and the effectiveness of different modeling techniques to understand the factors influencing inflation. With a specific emphasis on the Exponential Generalized Autoregressive Conditional Heteroskedasticity (E-GARCH) model and the Autoregressive Generalized Conditional Heteroskedasticity (A-GARCH) model, the research sought to provide insights into the behavior of inflation in Nigeria and the implications for policymakers.
The key findings of the study revealed a significant degree of volatility in Nigeria's inflation rates, influenced by various external and domestic factors. Notably, the E-GARCH model provided compelling evidence of the persistence of inflationary shocks, indicating that past fluctuations have a lasting impact on current inflation levels. This result underscores the critical nature of addressing inflation in a timely manner, as delays in intervention may exacerbate economic instability.
The study found that the exchange rate plays a pivotal role in influencing inflation rates, with positive coefficients indicating that fluctuations in currency value directly contribute to inflationary pressures. This highlights the vulnerability of the Nigerian economy to external shocks, particularly in the context of a volatile global market. Policymakers in Nigeria can mitigate exchange rate fluctuations through a combination of monetary, fiscal, and structural policies. The choice between stabilizing interest rates and managing forex reserves depends on the underlying causes of exchange rate volatility. Some of the potential measures to curb this scenario are interest adjusments by CBN, inflation targeting, foreign exchange reserves management, enhancing foreign exchange earnings, and maintaining fiscal discipline on the part of the government. Conversely, the negative coefficients associated with interest rates and import rates suggest that increases in these variables may help mitigate inflationary pressures. This finding is especially relevant for policymakers, as it indicates that appropriate adjustments in monetary policy can effectively manage inflation.
The comparison between the E-GARCH and A-GARCH models demonstrated the superior performance of the E-GARCH model in capturing inflation volatility. The analysis revealed that the E-GARCH model's results were not only statistically significant but also provided more reliable forecasts for future inflation rates. The evaluation metrics consistently favored the E-GARCH model, reinforcing its utility in economic forecasting. This underscores the importance of selecting appropriate modeling techniques that align with the specific characteristics of the economic data being analyzed. The insights gained from the E-GARCH model, particularly regarding the persistence of inflationary shocks and the influence of exchange rates, are invaluable for policymakers. By understanding the dynamics of inflation and the effectiveness of different models, stakeholders can better navigate the economic challenges facing Nigeria and implement strategies that promote stability and sustainable growth.
Understanding the persistence of inflationary shocks and the factors driving inflation can inform more effective monetary and fiscal policies. Policymakers should prioritize developing strategies that respond swiftly to inflationary pressures, particularly in light of the significant role of exchange rate fluctuations. Additionally, the findings suggest that a careful balance must be struck between interest rates and inflation management, as overly aggressive monetary tightening could stifle economic growth. Furthermore, the study's results advocate for enhancing the monitoring of key economic indicators to enable timely interventions. By adopting a proactive approach to inflation management, Nigeria can better navigate the economic challenges posed by inflationary volatility, fostering stability and sustainable growth.
Finally, this research contributes to the existing body of knowledge on inflation dynamics in Nigeria, highlighting the importance of robust modeling techniques in understanding economic behavior. The insights garnered from the comparison of A-GARCH and E-GARCH models provide valuable information for policymakers and stakeholders aiming to address inflation effectively.
While this study provides valuable insights into the dynamics of inflation in Nigeria using E-GARCH and A-GARCH models, several limitations must be acknowledged. First, the study's reliance on historical data limits the ability to capture sudden economic shifts or unprecedented events that may have influenced inflation trends. For instance, significant occurrences such as the COVID-19 pandemic and global supply chain disruptions could not be comprehensively included as elucidated in the work of Adeboye et al. [27], which might have potentially skewed the results. The focus on specific variables, exchange rates, interest rates, and import rates could have overshadowed other relevant factors such as political instability, public health crises, or global economic conditions that could also affect inflation.
[1] Okechukwu, I.A., Mbadike, N.S., Ugwuanyim, G., Ozurumba, B.A. (2019). Effects of exchange rate, interest rate, and inflation on stock market returns volatility in Nigeria. International Journal of Management Science and Business Administration, 5(6): 38-47. https://doi.org/10.18775/ijmsba.1849-5664-5419.2014.56.1005
[2] Ha, J., Kose, M.A., Ohnsorge, F. (2019). Understanding inflation in emerging and developing economies. World Bank Policy Research Working Paper, No. 8761.
[3] Ehikioya, B.I. (2019). The impact of exchange rate volatility on the Nigerian economic growth: An empirical investigation. Journal of Economics and Management, 37(3): 45-68. https://doi.org/10.22367/jem.2019.37.03
[4] Mandeya, S.M., Sin-Yu, H. (2022). Inflation, inflation uncertainty and the economic growth nexus: A review of the literature. Folia Oeconomica Stetinensia, 22(1): 172-190.
[5] Fagbemi, F., Ajibike, J.O. (2019). Nigerian economic performance: Exploring dynamics of exchange rate, inflation and economic output. International Journal of Social Sciences Perspectives, 5(2): 57-71. https://doi.org/10.33094/7.2017.2019.52.57.71
[6] Olamide, E., Ogujiuba, K., Maredza, A. (2022). Exchange rate volatility, inflation and economic growth in developing countries: Panel data approach for SADC. Economies, 10(3): 67. https://doi.org/10.3390/economies10030067
[7] Musa, N. (2021). Impact of exchange rate volatility on inflation in Nigeria. Journal of Contemporary Research in Business, Economics and Finance, 3(1): 26-38. https://doi.org/10.33094/26410265.2021.31.26.38
[8] Aydin, C. (2017). The inflation-growth nexus: A dynamic panel threshold analysis for D-8 countries. Romanian Journal of Economic Forecasting, 20(4): 134-151.
[9] Morina, F., Hysa, E., Ergün, U., Panait, M., Voica, M.C. (2020). The effect of exchange rate volatility on economic growth: Case of the CEE countries. Journal of Risk and Financial Management, 13(8): 177. https://doi.org/10.3390/jrfm13080177
[10] Morvillier, F. (2020). Do currency undervaluations affect the impact of inflation on growth? Economic Modelling, 84: 275-292. https://doi.org/10.1016/j.econmod.2019.04.018
[11] Gidigbi, M.O., Babarinde, G.F., Lawan, M.W. (2018). Inflation and exchange rate volatility pass-through in Nigeria. Journal of Management, Economics, and Industrial Organization, 2(3): 18-40.
[12] Alagidede, P., Ibrahim, M. (2017). On the causes and effects of exchange rate volatility on economic growth: Evidence from Ghana. Journal of African Business, 18(2): 169-193. https://doi.org/10.1080/15228916.2017.1247330
[13] Hatmanu, M., Cautisanu, C., Ifrim, M. (2020). The impact of interest rate, exchange rate and European business climate on economic growth in Romania: An ARDL approach with structural breaks. Sustainability, 12(7): 2798. https://doi.org/10.3390/su12072798
[14] Sabina, N.E., Manyo, T.S., Ugochukwu, U.S. (2017). Modeling exchange rate volatility and economic growth in Nigeria. Noble International Journal of Economics and Financial Research, 2(6): 88-97.
[15] Cabral, R., Carneiro, F.G., Mollick, A.V. (2020). Inflation targeting and exchange rate volatility in emerging markets. Empirical Economics, 58: 605-626. https://doi.org/10.1007/s00181-018-1478-8
[16] Majumder, M.K., Raghavan, M., Vespignani, J. (2022). The impact of commodity price volatility on fiscal balance and the role of real interest rate. Empirical Economics, 63(3): 1375-1402. https://doi.org/10.1007/s00181-021-02168-3
[17] Eldomiaty, T., Saeed, Y., Hammam, R., AboulSoud, S. (2020). The associations between stock prices, inflation rates, interest rates are still persistent: Empirical evidence from stock duration model. Journal of Economics, Finance and Administrative Science, 25(49): 149-161. https://doi.org/10.1108/jefas-10-2018-0105
[18] Olayinka, M.S. (2021). Interest rates and inflation rate interplay: Impact on Policy decision in Nigeria since year 2000. International Journal of Economics, Management and Accounting, 29(1): 129-166. https://doi.org/10.31436/ijema.v29i1.819
[19] Choi, S., Furceri, D., Loungani, P., Mishra, S., Poplawski-Ribeiro, M. (2018). Oil prices and inflation dynamics: Evidence from advanced and developing economies. Journal of International Money and Finance, 82: 71-96. https://doi.org/10.1016/j.jimonfin.2017.12.004
[20] Roncaglia de Carvalho, A., Ribeiro, R.S., Marques, A.M. (2018). Economic development and inflation: A theoretical and empirical analysis. International Review of Applied Economics, 32(4): 546-565. https://doi.org/10.1080/02692171.2017.1351531
[21] Cassim, L. (2018). Modelling asymmetric conditional heteroskedasticity in financial asset returns: an extension of Nelson’s EGARCH model. MPRA Paper 86615, University Library of Munich, Germany.
[22] BenSaïda, A. (2021). The good and bad volatility: A new class of asymmetric heteroskedastic models. Oxford Bulletin of Economics and Statistics, 83(2): 540-570. https://doi.org/10.1111/obes.12398
[23] Omari, C.O., Mwita, P.N., Waititu, A.G. (2017). Modeling USD/KES exchange rate volatility using GARCH models.
[24] Ekong, C.N., Onye, K.U. (2017). Application of garch models to estimate and predict financial volatility of daily stock returns in Nigeria. International Journal of Managerial Studies and Research (IJMSR), 5(8): 18-34.
[25] Arnold, N.G., Balakrishnan, R., Barkbu, B.B., Davoodi, H.R. Lagerborg, A., Lam, W.R., Medas, P.A., Otten, J., Rabier, L., Roehler, C., Shahmoradi, A., Spector, M. Weber, S., Zettelmeyer, J. (2022). Reforming the EU fiscal framework: Strengthening the fiscal rules and institutions. International Monetary Fund.
[26] Fasanya, I.O., Adekoya, O.B. (2017). Modelling inflation rate volatility in Nigeria with structural breaks. CBN Journal of Applied Statistics, 8(1): 175-193.
[27] Adeboye, N.O., Abimbola, V.O., Folorunso, S.O. Akinbo, R.Y. (2023). Modelling the volatility of African capital markets in the presence of Covid-19 pandemic: Evidence from the five emerging economies in Africa. Statistics in Transition New Series, 24(2): 17-36. https://doi.org/10.59170/stattrans-2023-018
[28] Muhammad Abdullahi, B., Shehu Shuaibu, M., Junaid Alam, M., Lawan Salisu, N. (2023). The Asymmetric Impact of Oil Price Volatility on Nigeria's Inflation. Annals of “Dunarea de Jos” University of Galati Fascicle I. Economics and Applied Informatics.
[29] Chigozie, M.P., Ukwuani, B.O., Joy, O.O. (2017). Effect of globalization on entrepreneurship development in south-east Nigeria. International Journal of Academic Research in Economics and Management Sciences, 6: 174-188.
[30] Uddin, G.S., Muzaffar, A.T., Arouri, M., Sjö, B. (2017). Understanding the relationship between inflation and growth: A wavelet transformation approach in the case of Bangladesh. The World Economy, 40(9): 1918-1933. https://doi.org/10.1111/twec.12429